Forex Signals Explained: A Trader's Guide to Using Them Well
On this page
What Forex Signals Actually Tell You
Most traders lose money on signals that were technically correct.
The direction was right.
The execution wasn’t.
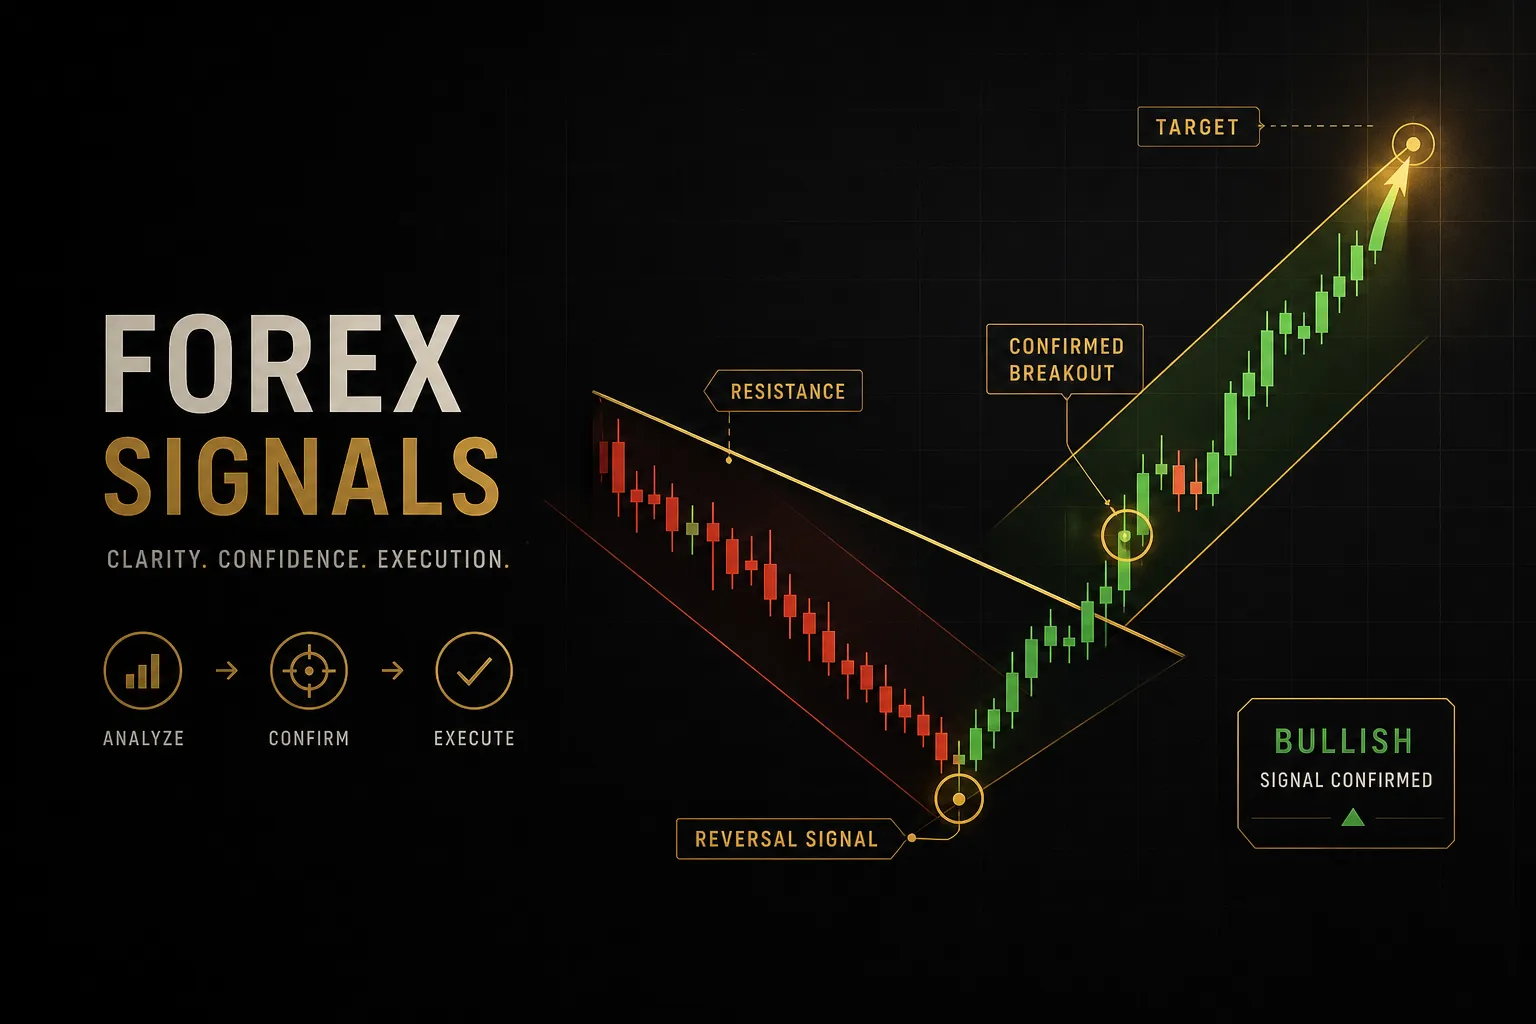
A forex signal is an alert identifying a potential trade opportunity in a currency pair, usually built from technical analysis, price action, fundamental data, or some combination of the three. It tells you that conditions matching a defined set of criteria have appeared.
It does not tell you the trade will win.
That distinction sounds obvious.
In practice, it’s where the money goes.
Most guides flatten signals into “buy EUR/USD at 1.0850” and stop there. They skip the parts that decide your actual result: where the idea becomes invalid, how much you risk, what happens when spread widens at the London open, and whether the signal still applies forty minutes after it was published.
A directional call and a complete trade plan are two different objects.
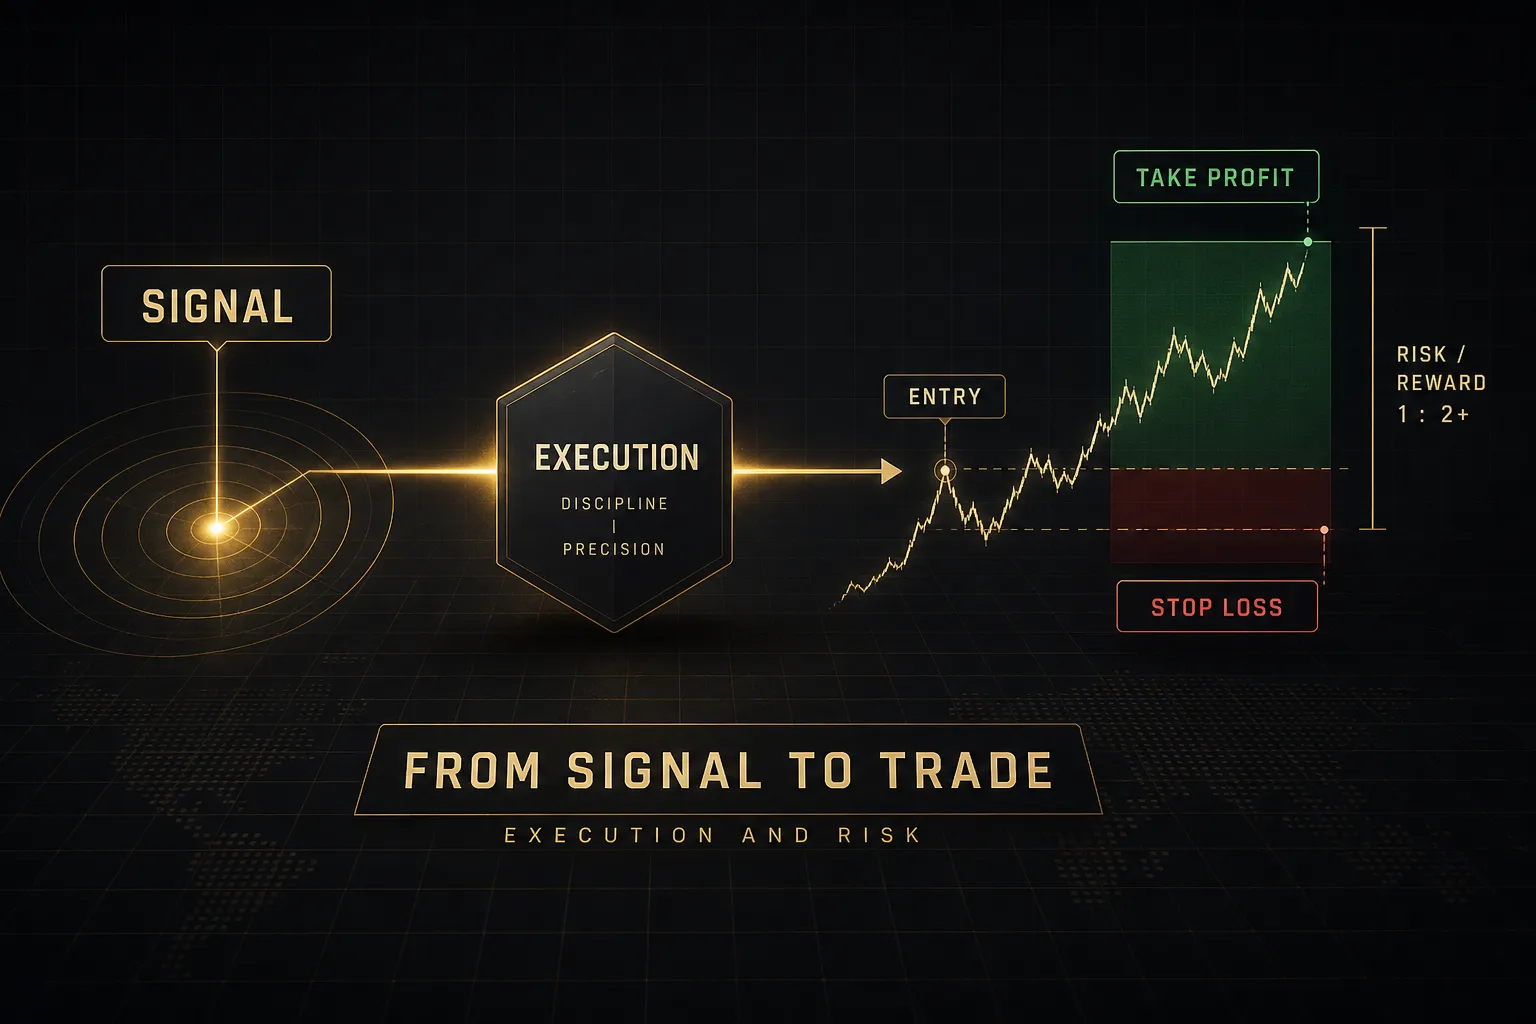
The first is a hypothesis about trend direction. The second includes an entry trigger, a stop-loss placement that defines invalidation, a take-profit target, a position size derived from those levels, and a time window after which the setup expires.
A signal identifies opportunity. A trade plan converts that opportunity into a defined, survivable risk. Confusing the two is the single most common reason signal-following fails.
This guide is written for beginner and intermediate traders who want to evaluate signals rather than obey them. You’ll get the anatomy of an actionable signal, a method for judging whether an advertised accuracy figure means anything, a position-sizing formula you can apply in thirty seconds, and a testing protocol that costs nothing but time.
By the end you should be able to look at any signal and answer three questions immediately.
What’s my invalidation? What’s my size? And does this still apply right now, given the session, the volatility, and the economic calendar?
If a signal provider can’t help you answer those, the problem isn’t your discipline.
It’s the signal.
Anatomy of a Complete Signal
Compare two alerts.
“Buy GBP/USD.” Versus “Buy GBP/USD, limit 1.2740, stop 1.2695, target 1.2830, valid until London close, H4 uptrend intact, ATR volatility normal.”
Only one of those is tradeable.
The difference isn’t detail for its own sake. Every missing field is a decision you’ll have to make under pressure, usually badly.
Minimum Fields That Make a Signal Actionable
These are the non-negotiables.
A signal missing any of them requires you to fill the gap yourself, which means you’re the analyst now, not the follower.
- Timestamp with timezone. A signal generated at 08:15 GMT during the London session behaves nothing like the same setup at 22:00 GMT in thin liquidity. Without a timestamp you can’t judge whether the setup is still live or already three hours stale.
- Currency pair and direction. Obvious, but specify which side of the pair. “Long EUR/USD” and “short the dollar against the euro” mean the same thing, and ambiguity in fast markets costs pips.
- Entry type and level. Market order or limit order changes everything. A market entry accepts current price and current spread; a limit entry at a support and resistance level may never fill, which is a better outcome than chasing.
- Invalidation level. This is the stop-loss placement, and more importantly it’s the price at which the underlying idea is proven wrong. It should sit beyond a structural level, not at a round number chosen for convenience.
- Take-profit target and risk-reward ratio. A target without a stated ratio hides the math. If a signal risks 45 pips to make 30, you need to know that before you take it, not after.
- Expiry window. Every setup decays. “Valid for 4 hours” or “invalid after the New York open” prevents you entering a trade whose context has already changed.
- Market context. Higher-timeframe trend direction, current session, and volatility state (typically measured with ATR). Context tells you whether this is a trend continuation in a strong market or a countertrend fade in a choppy one.
Here’s the trap that catches most people: a signal identifies direction, but entry timing and exit management need their own rules.
The provider says buy.
You still decide whether to enter at market, wait for a pullback to a liquidity zone, scale out at 1R, or move the stop to breakeven.
Treating a directional alert as a full execution plan is how correct calls turn into losing trades.
Signal vs Indicator vs Copy Trading
Three terms, constantly conflated, with very different risk profiles.
- Indicator. The tool. Moving averages, RSI, MACD, and ATR are calculations applied to price data. An indicator produces conditions; it doesn’t produce decisions. A 50/200 moving average crossover is an indicator event.
- Signal. The alert generated when indicator conditions, price action patterns, or fundamental triggers meet a defined ruleset. You receive it, you evaluate it, you decide. Manual execution, human judgment retained.
- Copy trading. Automated mirroring. Another trader’s executions replicate into your account proportionally, including their entries, exits, and mistakes. You retain no decision at trade level, only the choice to connect or disconnect.
The practical consequence: signals let you skip trades that conflict with your market structure read.
Copy trading doesn’t.
If a copied trader triples position size after a losing streak, your account experiences that decision in real time.
How Signals Are Generated
Generation method determines time sensitivity, and time sensitivity determines whether you can realistically act on it.
| Method | Strengths | Weaknesses | Time Sensitivity | Ideal Use Case |
|---|---|---|---|---|
| Manual / discretionary | Reads context, market structure, and unusual conditions machines miss | Inconsistent, emotionally influenced, hard to backtest | Moderate: minutes to hours | Swing traders on H4/Daily who value narrative |
| Indicator-based | Transparent rules, easy to verify, reproducible on your own charts | Lags in ranging markets; false signals cluster in low volatility | High on M5/M15, low on Daily | Traders learning a repeatable technical framework |
| Algorithmic | Zero emotion, high frequency, consistent execution logic | Curve-fitting risk; breaks when regime shifts | Very high: seconds to minutes | Automated accounts with fast, low-spread execution |
| Fundamental | Captures central bank policy, rate differentials, currency strength shifts | Poor entry precision; timing can be weeks early | Low: days to weeks | Position traders sizing small and holding long |
| Hybrid | Fundamental bias filters technical entries, cutting countertrend noise | More rules means more ways to disagree with yourself | Moderate | Intermediate traders building a full process |
Match the method to your life.
An algorithmic scalping signal delivered while you’re in a meeting is worthless.
Not slightly worse.
Worthless.
Judging Accuracy and Legitimacy
A provider advertising “87% accuracy” is telling you almost nothing useful.
Win rate on its own is the most misleading number in trading.
Win Rate vs Expectancy and Drawdown
What actually matters is trade expectancy: the average amount you expect to win or lose per trade, expressed as (win rate × average win) − (loss rate × average loss).
Run the numbers on two systems.
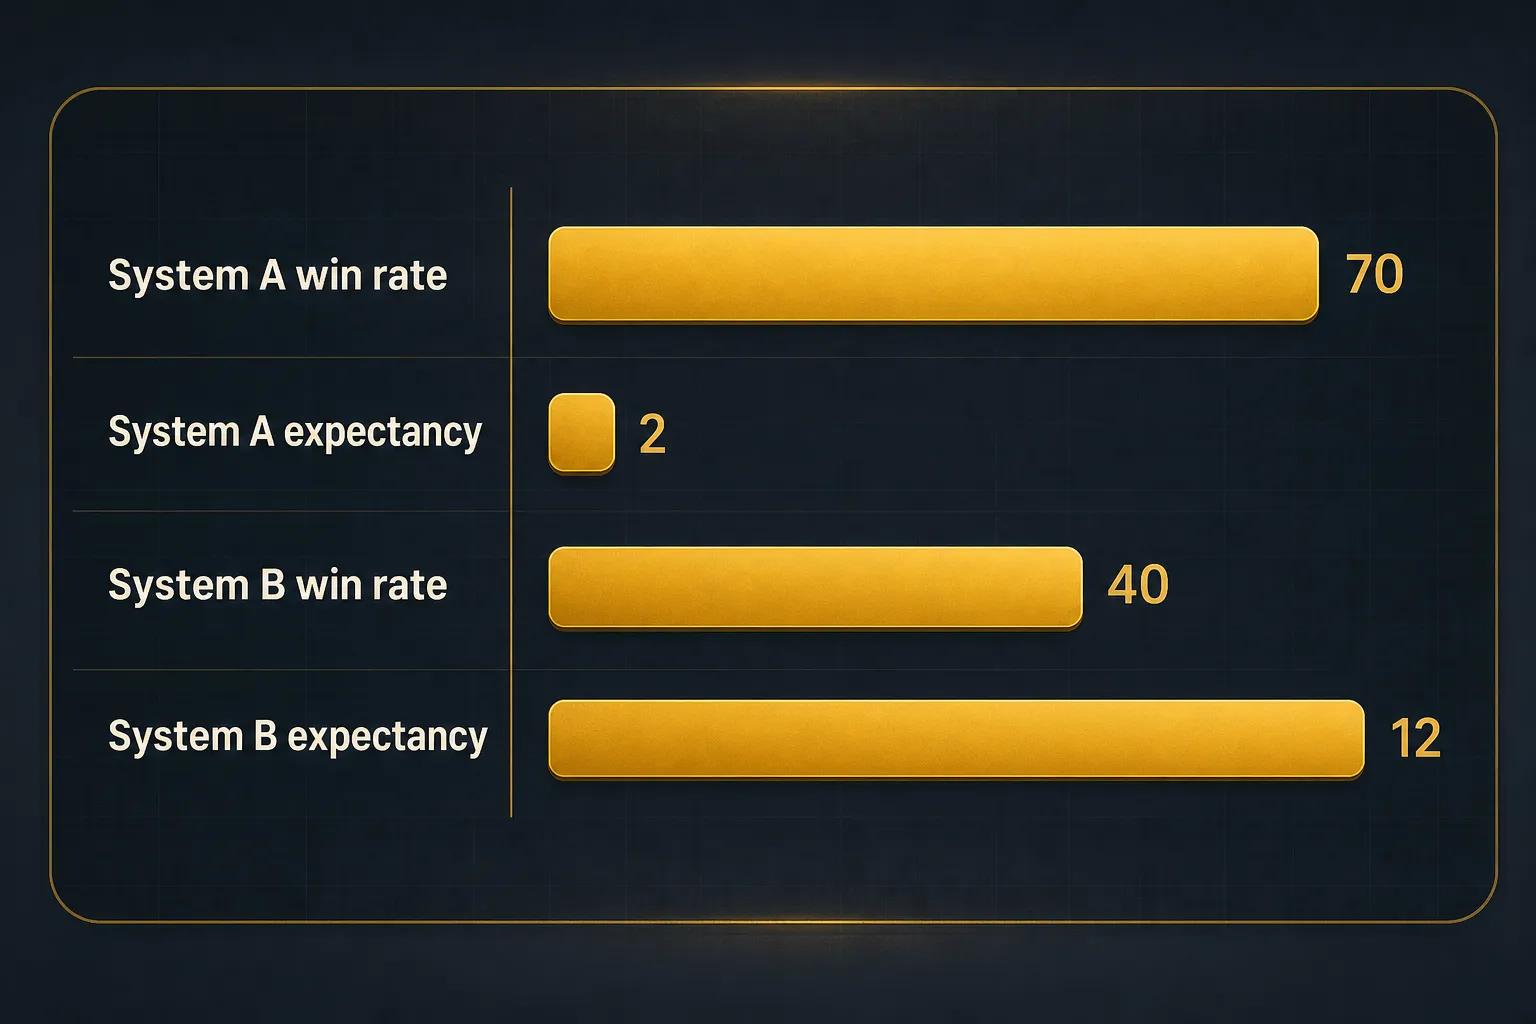
System A wins 70% of trades, averaging 20 pips per win and losing 40 pips per loss. Expectancy: (0.70 × 20) − (0.30 × 40) = 14 − 12 = +2 pips per trade.
System B wins only 40%, averaging 60 pips per win against 20-pip losses. Expectancy: (0.40 × 60) − (0.60 × 20) = 24 − 12 = +12 pips per trade.
Six times better, with a win rate that looks embarrassing in marketing copy.
The reward-to-risk ratio does the heavy lifting.
High win rates usually come from tight targets and wide stops, a structure that works beautifully until one loss erases fifteen wins.
Sample size is the next filter.
Thirty coin flips can produce twenty heads.
Treat any accuracy claim based on fewer than 20 to 30 verified trades as noise, and prefer 100+ before drawing conclusions about a strategy’s real edge.
Then ask about losing streaks.
A system with a 55% win rate will produce a run of five consecutive losses roughly every 55 trades, purely by chance.
If you haven’t planned for that emotionally and financially, you’ll abandon a profitable system at exactly the wrong moment.
Maximum drawdown matters more than total return.
A provider showing 90% annual gains with a 60% peak-to-trough drawdown is describing an account most people would close in month three.
Finally, the gap nobody advertises.
Published results are usually calculated on clean mid-price fills.
Your actual result subtracts spread on entry and exit, commission, slippage during volatile releases, and the trades you simply missed because the alert arrived while you were asleep.
On a 30-pip target with a 1.5-pip average spread and half a pip of slippage, you’ve already surrendered around 7% of the gross move before anything else happens. Scalping signals on tight targets can lose 20-30% of their theoretical edge to costs alone.
Due-Diligence Checklist for Providers
Before you send anyone money or capital, work through this.
Every item is a yes-or-no question.
- Verified live results, not backtests. Third-party verified track records from a platform that reads the account directly beat screenshots by an enormous margin. Backtested equity curves prove only that the rules were fitted to past data.
- Full trade history including losses. If you can’t see the losing trades, you’re seeing marketing. A published results page that shows drawdowns and losing months is a credibility signal, not a weakness.
- Disclosed risk parameters. Risk per trade, maximum concurrent positions, and whether the system ever averages down. Martingale-style recovery hidden inside a “high accuracy” record is the classic blow-up pattern.
- Identifiable provider. A real name, a real business entity, a contactable address. Anonymous Telegram channels have no accountability and no recourse.
- Regulatory status where applicable. Pure educational signals are typically unregulated information products, but anyone managing money, taking a share of profits, or offering personalised advice usually needs authorisation in their jurisdiction. Check the register rather than the website badge.
- Consistent methodology. The provider should be able to explain how signals are generated in a way you could partially reproduce. “Proprietary AI” with no further explanation is not an explanation.
From Signal to Trade: Execution and Risk
Two traders receive the identical signal.
One finishes the month up 4%, the other down 11%.
Same entries, same exits, same pair.
The difference is entirely in sizing and execution.
Position Sizing From the Stop-Loss
Position size is not a preference.
It’s arithmetic derived from your stop distance.
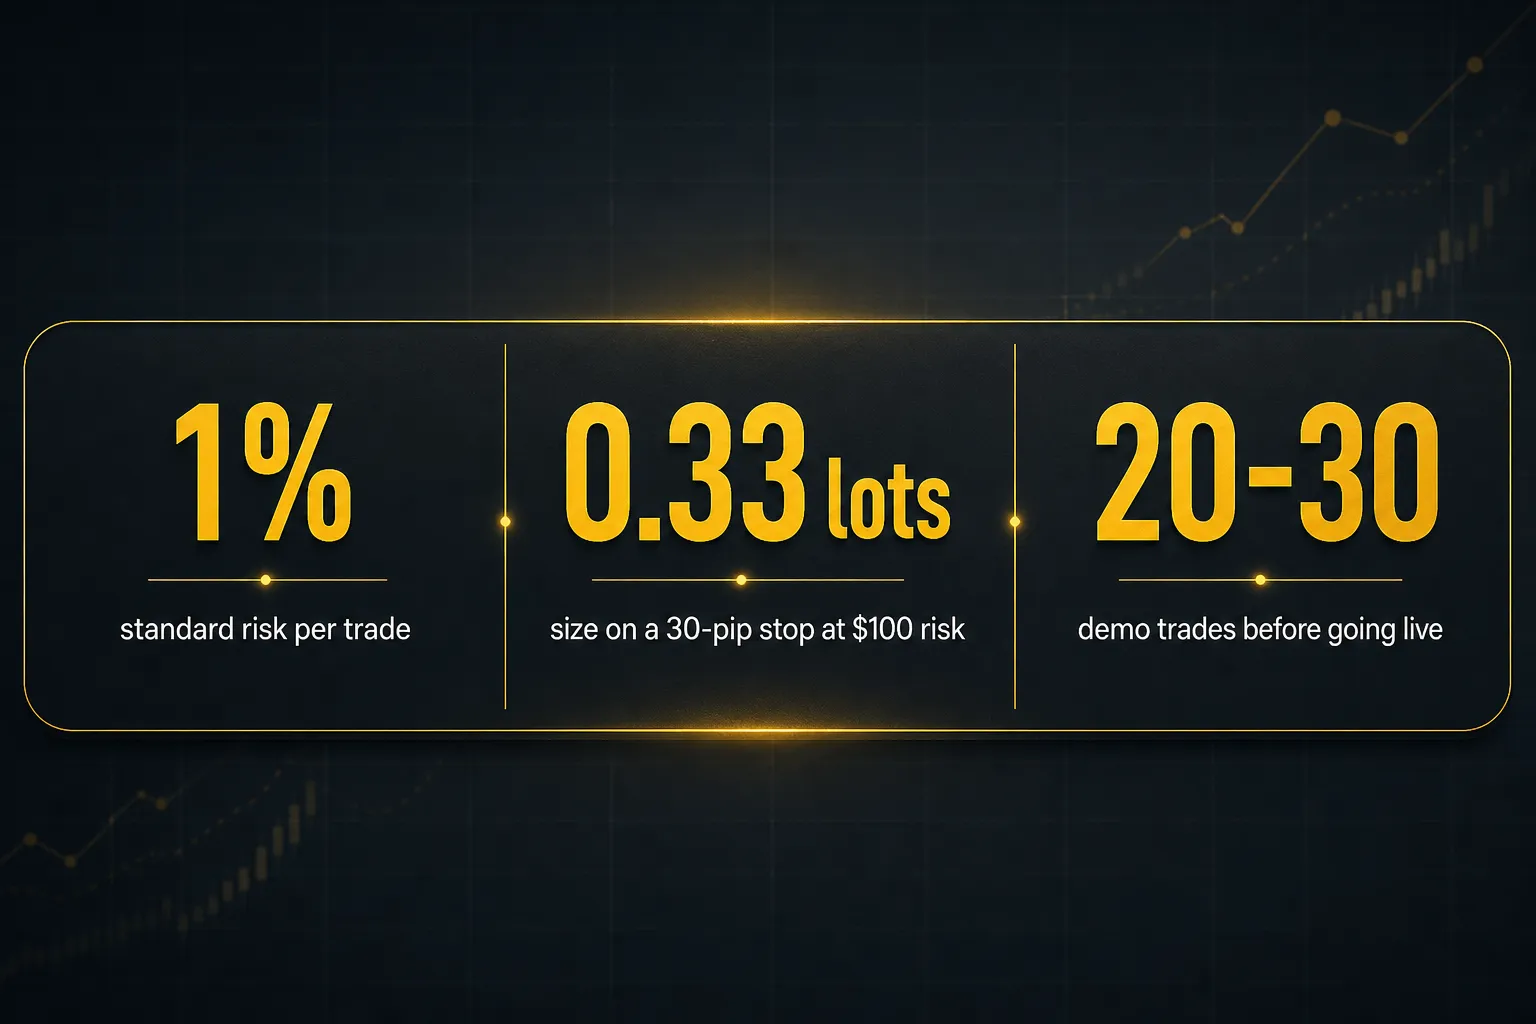
- Fix your risk percentage first. Choose a number between 0.5% and 2% of account equity and keep it constant. Most consistently profitable retail traders sit at 1% or below, because at 2% risk a run of eight losses removes roughly 15% of the account.
- Convert risk percentage to currency. On a $10,000 account risking 1%, your maximum loss on this trade is $100. That’s the whole budget. No exceptions for signals that feel especially strong.
- Measure the stop-loss distance in pips. Take it from the signal’s invalidation level, not from a comfortable round number. If entry is 1.0850 and the stop sits at 1.0820, that’s 30 pips.
- Apply the formula. Lot size = (account balance × risk %) ÷ (stop-loss distance in pips × pip value per lot). With $100 risk, a 30-pip stop, and $10 pip value per standard lot: $100 ÷ (30 × $10) = 0.33 lots.
- Adjust for the pair’s pip value. Pip value differs when the quote currency isn’t your account currency. On a JPY or exotic cross, calculate it fresh rather than assuming $10 per standard lot.
- Keep risk constant regardless of confidence. The signal you feel best about is not statistically more likely to win, and confidence correlates poorly with outcome. Increasing size on “high conviction” setups is how a single trade undoes a quarter.
The counterintuitive part: wider stops don’t mean more risk.
They mean smaller position size.
A 60-pip stop on the same $10,000 account with 1% risk gives you 0.16 lots, and your maximum loss is still $100.
Multi-Timeframe Confirmation Workflow
Multiple timeframe analysis is the cheapest filter available. It costs two minutes and removes a meaningful share of low-quality entries.
- Establish bias on the Daily chart. Identify market structure: higher highs and higher lows, or the reverse. Mark the major support and resistance zones. This is your directional permission slip.
- Refine on H4. Check whether price is trending, consolidating, or approaching a significant liquidity zone. A signal that fires into major resistance in an uptrend is a lower-probability trade than the same signal firing off a retested breakout.
- Check momentum alignment. Use RSI or MACD on the H4 to see whether momentum supports the signal direction or is diverging against it. Divergence isn’t a veto, but it’s a reason to size at the low end of your range.
- Time the entry on M15 or M5. Wait for a defined entry trigger: a candle close beyond a level, a rejection wick at your zone, a break of a minor structure. This is where you turn a directional idea into a specific price.
- Confirm the stop still makes sense. If lower-timeframe entry timing gives you a tighter stop below structure, the same dollar risk buys a larger position and a better risk-reward ratio. That’s the entire point of the exercise.
- Skip the trade if timeframes conflict. Daily downtrend plus a long signal equals a countertrend trade. Sometimes valid, always harder. If you’re building consistency, pass.
Delay, Slippage, and News Risk
The gap between a published signal and your filled order is where theoretical edge quietly disappears.
- Account for delivery delay. A signal that reaches you eight minutes late on an M5 setup is a different trade entirely. Set a personal rule: if price has moved more than 30% of the way to target, skip it rather than chase.
- Expect spread widening at session boundaries. Spreads typically expand around the daily rollover, during the Asia-London handover, and in the seconds surrounding data releases. A 1.2-pip EUR/USD spread can hit 6-8 pips for a few seconds.
- Plan for slippage on stops. Stop-loss orders execute at the next available price, not your requested price. During high-impact releases, gaps of 10-20 pips on major pairs are routine, which means your “1% risk” can become 1.6%.
- Verify broker quote differences. Your broker’s feed may differ from the provider’s by a pip or two. A limit entry that filled for them may miss for you, and a stop that survived for them may trigger for you.
- Reconcile timezones before every session. Providers publish in GMT, EST, or broker server time, and the difference decides whether “valid until London close” means 16:30 or 11:30 for you. Convert once, write it down.
- Check the economic calendar before every entry. A technically flawless setup is irrelevant fifteen minutes before a central bank decision or NFP print. Either stand aside or reduce size deliberately.
News doesn’t just add volatility.
It changes the market’s underlying premise, which means the technical structure the signal was built on may no longer exist.
Testing Signals Before Risking Money
You can learn nearly everything you need to know about a signal service without funding an account. Most traders skip this step because it’s slow and unglamorous, then pay tuition to the market instead.
What Non-Repainting Really Means
A non-repainting indicator confirms its signal on candle close and locks it permanently. Once the candle closes, that arrow, alert, or entry level cannot move, disappear, or reposition itself later.
Repainting systems do the opposite.
They recalculate as new data arrives, so a historical chart shows a flawless sequence of perfectly timed entries that never actually existed in real time.
The backtest looks extraordinary.
The live results are… not that.
You can test this yourself in an afternoon.
Screenshot a live chart with the indicator applied, note every signal and its exact bar, then reload the same chart hours later and compare.
If signals have shifted, vanished, or newly appeared on old candles, the system repaints and its published history is fiction.
The second test: run the indicator on a replay or bar-by-bar mode and check whether signals fire mid-candle or only at close. Mid-candle signals that later withdraw are the classic repainting tell.
Structured systems built around this constraint make independent evaluation possible.
PipTrend, for example, uses a locked-on-close signal engine, so a printed signal stays exactly where it printed, alongside a 12-timeframe confirmation table that shows whether trend direction agrees across the full range from M1 to Monthly rather than on a single convenient chart.
Its results page is published openly and includes losing trades, which is what lets a trader audit the record instead of trusting a headline percentage.
The value of a non-repainting, multi-timeframe system isn’t that it removes judgment. It’s that it gives you a stable, honest input to apply judgment to.
A Realistic Demo-Testing Protocol
Forward testing on demo, under your own broker and your own execution conditions, is the only test that reflects reality.
Commit to a minimum of 20 to 30 demo trades before risking capital, and take every signal that meets your criteria, including the ones you feel uneasy about. Cherry-picking during testing produces a flattering, useless dataset.
Use a pre-trade checklist every single time: Does the higher timeframe agree? Is there an entry trigger, or am I guessing? Where’s the invalidation? What’s my size at 1% risk? Is anything on the economic calendar in the next two hours?
Take, skip, modify, or wait, and record which you chose.
Then keep a trade journal with entry, exit, size, R-multiple result, screenshot, and a one-line note on why you took or skipped it. After thirty entries, patterns emerge that no provider’s statistics will ever show you: which sessions you execute well, which pairs you handle badly, and whether your losses come from the signals or from your own deviations.
Forex Signal FAQs
Are forex signals worth it?
Forex signals are worth it only when paired with your own risk management and execution rules.
They can compress the learning curve by showing you what a structured setup looks like and by surfacing opportunities you’d otherwise miss across dozens of pairs.
But a signal cannot size your position, respect your maximum drawdown, or stop you revenge-trading after a loss.
Traders who profit from signals treat them as one input among several, not as instructions.
Can you make money with forex signals?
Yes, but profitability comes from position sizing and execution discipline far more than from the signals themselves.
A system with positive trade expectancy still produces losing streaks, and only consistent risk per trade lets you survive them long enough to realise the edge.
Costs matter too: spread, commission, and slippage can consume 10-30% of a short-term strategy’s theoretical return.
Assume any advertised result overstates what you’ll personally achieve.
What is the best forex signal?
There is no single best forex signal, only the best fit for your timeframe, capital, and availability.
A scalping signal on M5 is useless if you can’t watch charts during the London session, while a swing signal on Daily charts requires patience and a wider stop.
Judge providers on verified live results including losses, transparent methodology, disclosed risk parameters, and a sample of at least 20-30 trades.
Fit and transparency beat headline win rates every time.
How do I get reliable forex signals?
Reliable signals come from providers with third-party verified track records, published losing trades, and a clearly explained generation method.
Start by testing any source on demo for 20-30 trades under your own broker’s spreads and execution before funding anything.
Check whether the underlying system is non-repainting by comparing live chart signals against the same chart reloaded later.
If a provider won’t show you drawdown or full history, that’s your answer.
Are forex signals legal?
Forex signals are legal in most jurisdictions as information and educational products.
The regulatory picture changes when a provider crosses into personalised investment advice, discretionary account management, or performance-fee arrangements, which typically require licensing from bodies such as the FCA, ASIC, CySEC, or the CFTC and NFA.
As of 2026, enforcement attention has increased on unregistered signal sellers making performance claims.
Verify a provider’s status on the relevant regulator’s public register rather than relying on logos displayed on a website.
What is the difference between forex signals and copy trading?
Signals require you to decide and execute manually; copy trading executes automatically in your account.
With signals you retain the ability to skip a setup that conflicts with your market structure read, adjust position size, or exit early.
With copy trading you inherit another trader’s entries, exits, and risk decisions in real time, including any sudden increase in size after losses.
Signals build skill; copy trading outsources it, along with the control.
Making Signals Part of Your Process
If you’re new, do not fund a live account on the strength of a provider’s marketing page. Run 20-30 demo trades with a written pre-trade checklist and a journal, then judge the results against your own execution, not theirs.
If you’re experienced, audit your current signal source this week against the due-diligence checklist above.
Verified live results, full history with losses, disclosed risk parameters, identifiable provider.
Anything failing two or more of those deserves a hard look.
A signal is an input to a process.
It doesn’t replace position sizing, multiple timeframe analysis, or your own judgment about whether the setup makes sense right now.
One concrete action tonight: pull up your last five signal-based trades and check whether each one had a defined invalidation level before you entered.
If any didn’t, that’s not a signal problem.
That’s the first thing to fix.
Sources
Risk Disclaimer: Trading involves risk. Past performance doesn't guarantee future results. Only trade with money you can afford to lose. PipTrend is a tool to assist your trading decisions, not financial advice.