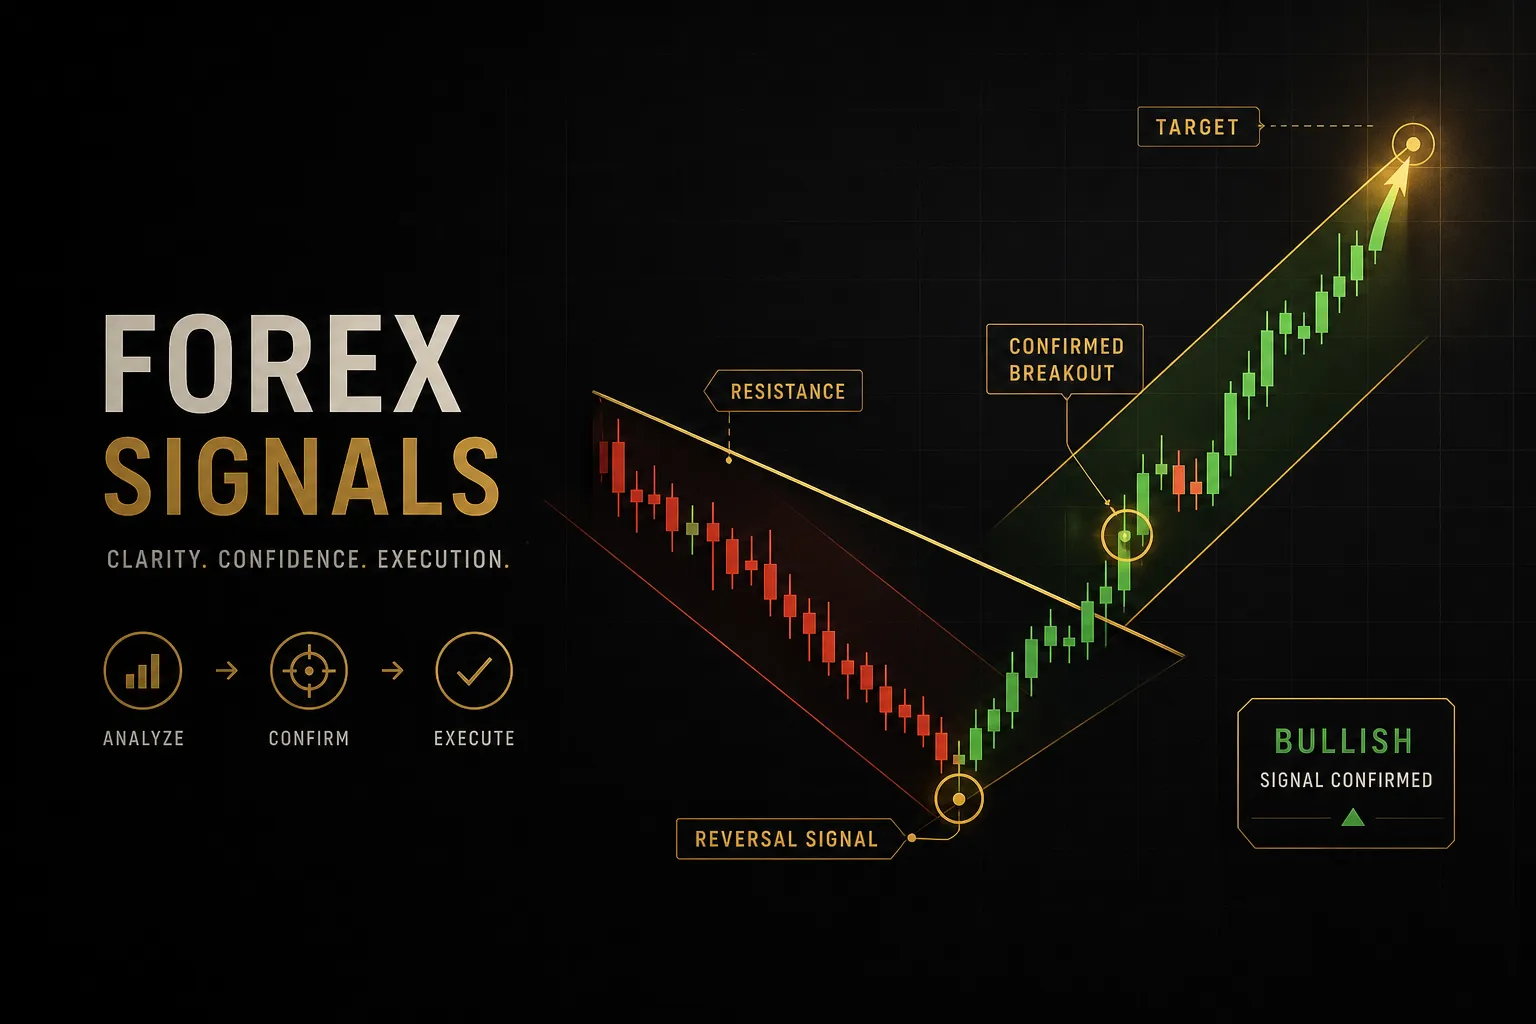
What Trading Signals Actually Mean for Traders
On this page
Why Signals Confuse So Many Traders
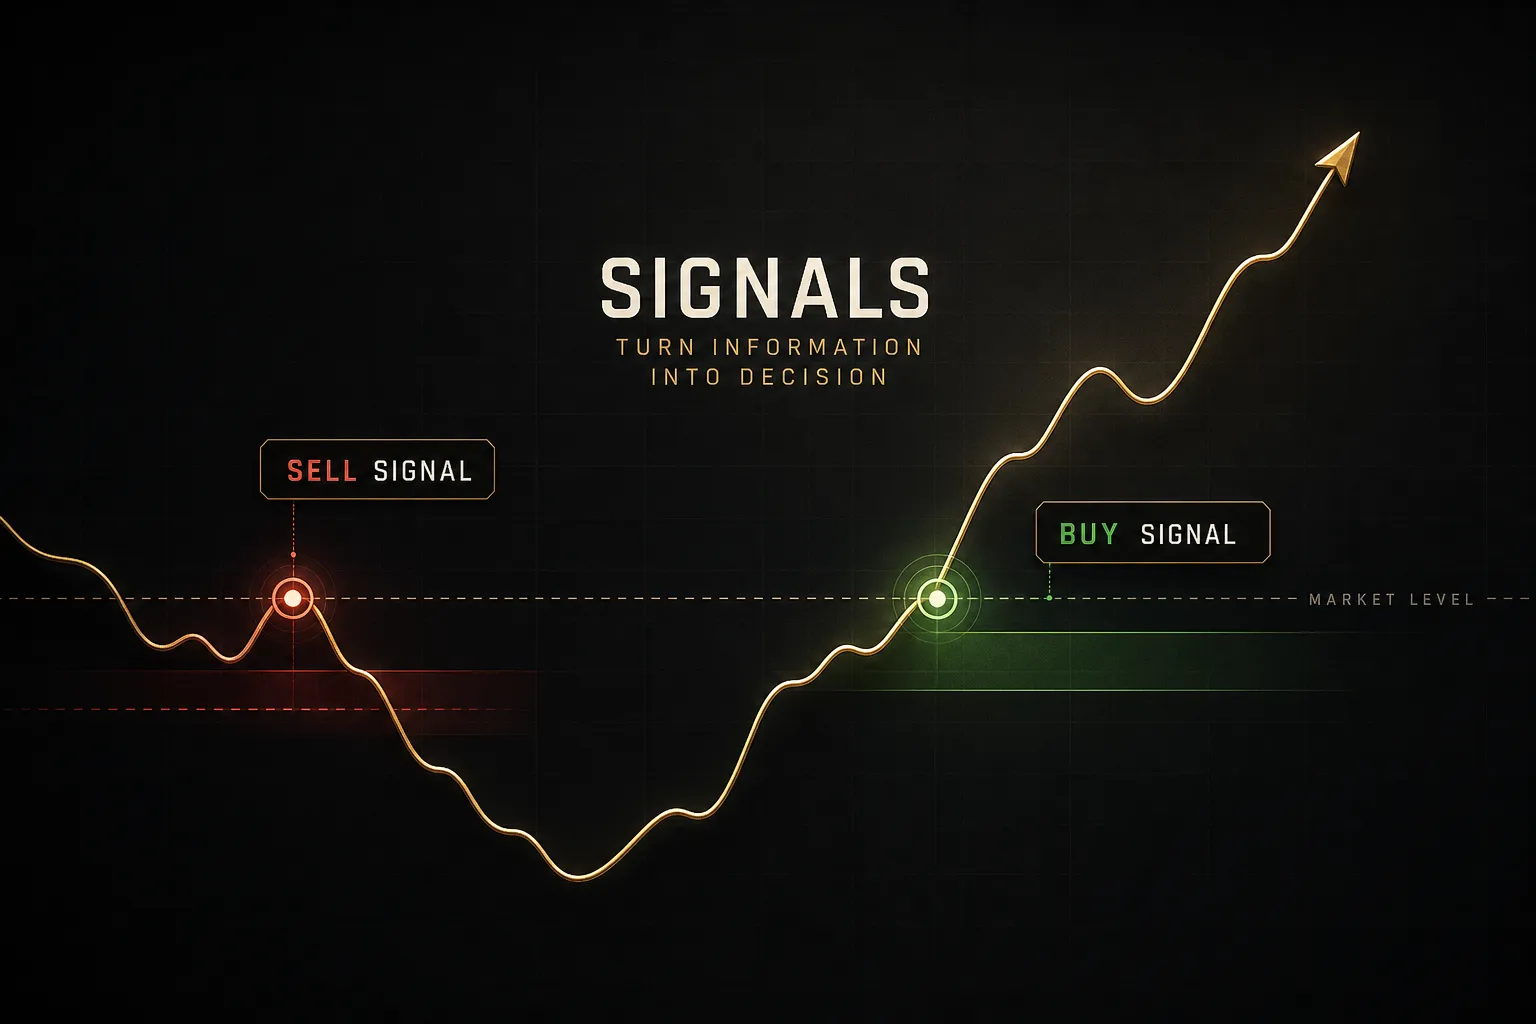
An arrow appears on the chart.
Green, pointing up.
Most traders click buy within four seconds.
That reflex is the single most expensive habit in retail trading.
A flashing arrow, a moving average crossover, or an oversold reading on the relative strength index is not an instruction. It is one data point, stripped of the context that determines whether it means anything at all.
The confusion runs deeper than impatience.
Signal services, indicator vendors, and chart-pattern accounts all use the word “signal” to mean wildly different things.
Sometimes it means a full trade plan with entry, stop, and target. Sometimes it means a colored candle.
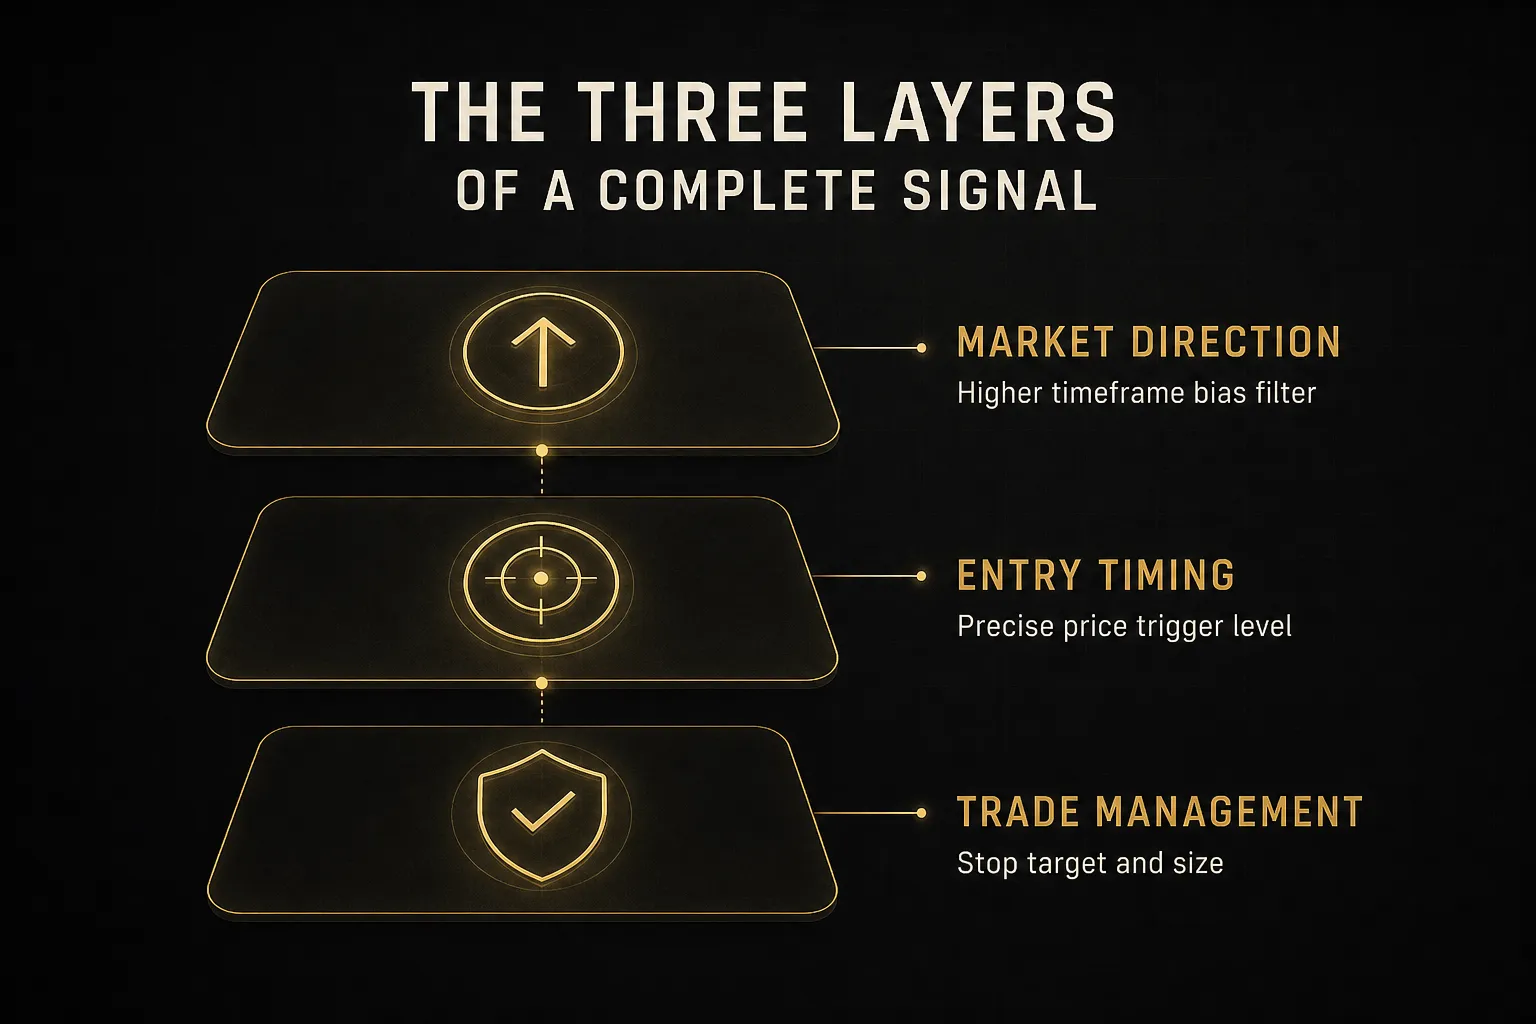
This guide uses the framework professional desks actually use, and it has three parts: market direction (what the higher timeframe says), entry timing (the precise trigger or price level), and trade management (stop-loss, target, position size, exit rule).
Miss any one of the three and you do not have a signal.
You have a hunch with a graphic attached.
Set your expectations now.
No signal guarantees profit.
Not the paid ones, not the AI-labeled ones, not the ones with a screenshot of a 94% win rate. Validation and risk control carry at least as much weight as the signal itself, and usually more.
Everything here applies across forex, equities, crypto, and futures. The mechanics of technical analysis and price action do not change when the ticker changes.
Liquidity, spread behavior, and session timing do, and those differences get covered where they matter.
Indicator, Signal, or Strategy?
Four words get used interchangeably in trading forums, and the confusion costs money.
An indicator is not a signal.
A signal is not a setup.
A setup is not a strategy.
Each term sits one level higher than the last, adding context and rules. Here is what each one actually means:
- A raw indicator reading is a single data point with zero context. RSI crosses above 70. The MACD histogram flips positive. Price touches the upper Bollinger Band. That is all it is: a mathematical output from a formula applied to recent price data. An RSI above 70 in a strong uptrend often means continuation, while the same reading in a range means exhaustion. The number alone tells you nothing about which situation you are in.
- A trading signal is an indicator reading plus a specific confirmation rule that makes it actionable. Not “RSI crosses 70” but “RSI crosses 70 AND price closes above the prior session high.” The confirmation rule is what converts a passive observation into something you can act on and, more importantly, something you can test. Without the rule, you cannot backtest it, because there is nothing precise enough to code.
- A trade setup is a signal placed in context. The signal fires, and then you ask three questions. What is the trend direction on the higher timeframe? Is price near a meaningful level of support and resistance, or floating in the middle of nowhere? Does the distance to the logical stop versus the logical target produce an acceptable risk-reward ratio? A valid signal in a bad location is not a setup. It is a coin flip with commissions.
- A strategy is the complete, repeatable rule set that governs many trades. Entry conditions, exit conditions, position sizing, maximum risk per trade, maximum daily loss, which sessions you trade, which conditions you sit out. A strategy has an expectancy you can measure over 100 trades. A signal has an outcome you can measure over one.
Why does conflating these four cause damage?
Because traders act on level-one information while believing they are operating at level four.
Someone sees a MACD cross, treats it as a complete strategy, enters with no stop and no size discipline, and then blames the indicator when the trade fails.
The indicator did its job.
It reported a change in market momentum. It never claimed to know where the trade should be exited, how much of the account to risk, or whether the daily chart was in a downtrend.
An indicator answers “what happened to price.” A strategy answers “what should I do about it, how much, and when do I admit I was wrong.” Those are not the same question.
The practical test: if you cannot write your signal down in a form another trader could follow identically, you have an indicator reading, not a signal.
Anatomy of a Complete Signal
A complete signal is not a longer alert.
It is a structured object with required fields, and if any field is missing, the trade should not be taken.
Direction, Entry, and Management
The three components serve genuinely different functions, and each one answers a question the others cannot.
Market direction comes from the higher timeframe and answers which side you are allowed to trade.
If the Daily and 4-hour are both bullish, you are hunting long entries only.
Direction is a filter, not a trigger.
It never tells you where to enter.
Entry timing answers where and when.
A specific price level, a candle-close condition, a break of a prior high with volume. This is where VWAP, session levels, supply and demand zones, and breakout confirmation do their work.
Trade management answers how much you lose if wrong and how much you make if right. Stop-loss placement, take-profit target, position size derived from account risk, and the rule for exiting early if conditions change.
Separating direction from entry is the single most underrated discipline in this whole process.
When traders merge them, they see “bullish” and buy immediately at whatever price is on screen. That is how you buy the top of an extended candle after the move has already run 80% of its range.
The direction call has a shelf life measured in hours or days. The entry level has a shelf life measured in ticks.
Treat them as one thing and you will chase every candle.
Reading a Sample Signal in Practice
Here is a full signal template with every field populated. This is EURUSD on a 15-minute execution chart with Daily bias bullish.
| Field | Value | Why It Matters |
|---|---|---|
| Asset | EUR/USD | Defines spread, session hours, and typical market volatility profile |
| Direction | Long (bullish) | Set by Daily and 4H trend alignment, not by the 15-minute chart |
| Timeframe | 15-minute execution / Daily bias | Prevents applying a scalp signal to a swing position or vice versa |
| Entry trigger | 15M close above 1.0842 (prior session high) | Requires breakout confirmation on close, filtering intrabar spikes |
| Invalidation level | 1.0805 (below demand zone low) | The price at which the trade thesis is objectively wrong |
| Stop-loss | 1.0801 (invalidation minus 0.4 x ATR buffer) | Uses average true range so the stop respects normal noise |
| Take-profit target | 1.0925 (prior swing high / supply zone) | Anchored to structure, not an arbitrary pip count |
| Risk-reward ratio | 1:2.02 (41 pips risk / 83 pips reward) | Below 1:1.5, the setup gets skipped regardless of how clean it looks |
| Position size | 0.73 lots on a $25000 account at 1.2% risk | Size is an output of stop distance, never a fixed habit |
Notice what the entry trigger is not.
It is not “buy now.”
It is a conditional order that only activates if price does something specific.
Now the worked example, using a layered system as the illustration. A color-coded trend engine flips bullish on the higher timeframe, establishing direction.
That alone triggers nothing.
The trader then waits for price to interact with a defined level: session VWAP, or the upper boundary of a demand zone. That interaction is the entry trigger candidate.
Before execution, a multi-timeframe alignment table (systems like PipTrend display 12 timeframes at once, from 1-minute up to Monthly) is checked for confluence.
If the 1H, 4H, and Daily all read bullish while the 5M and 15M read bearish, that is a pullback inside an uptrend, which is exactly what you want. If the Daily reads bearish while everything below reads bullish, that is a counter-trend bounce, and the signal gets downgraded or skipped.
The final gate: the signal locks only after candle close. An indicator that changes its mind mid-candle is a repainting indicator, and its historical chart will look far better than its live performance ever did.
Confirming Signals Before You Trade
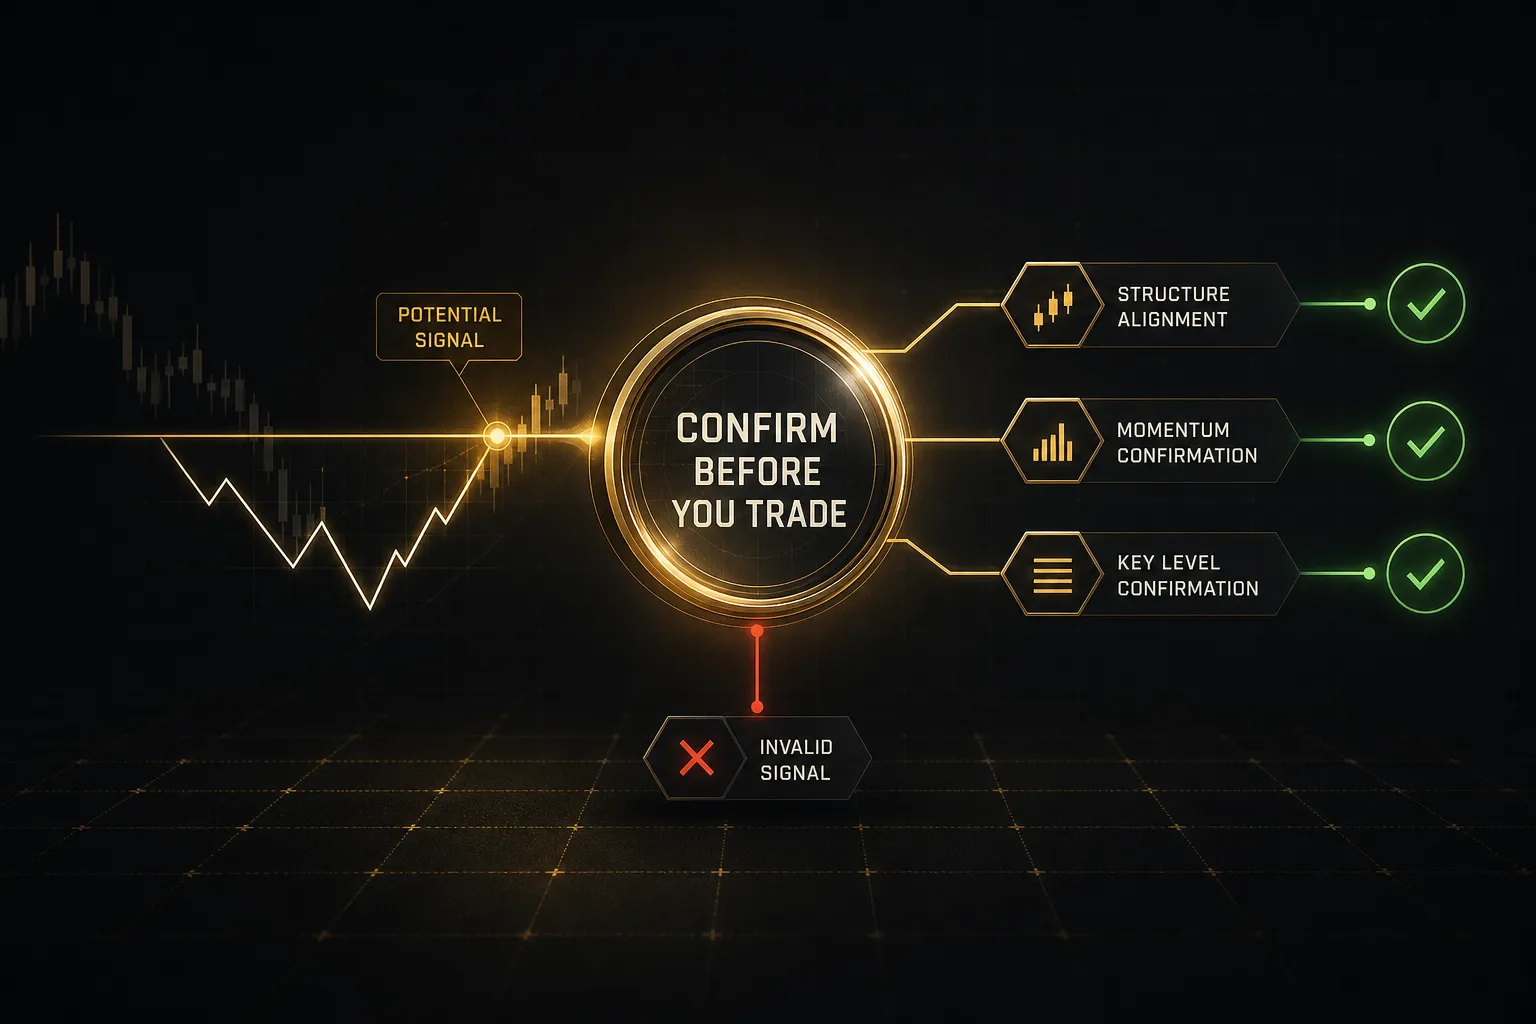
The gap between a signal and a trade is where most of the edge lives.
Confirmation is not about finding more reasons to say yes. It is about building a system that says no efficiently.
Multi-Timeframe Confirmation
Multi-timeframe analysis works because it forces you to trade with the dominant flow rather than against it. A 15-minute buy signal during a Daily downtrend is not wrong exactly, but it is fighting the current, and the win rate on those trades typically drops sharply compared to aligned entries.
Practical implementation follows a hierarchy:
- Bias timeframe (Daily or 4H): establishes which direction you are permitted to trade. Check it once per session and do not renegotiate it because a 5-minute candle looked exciting.
- Structure timeframe (1H): identifies where the meaningful levels sit. Prior swing highs and lows, unfilled gaps, VWAP anchors, and the boundaries of the current range.
- Execution timeframe (5M or 15M): provides the precise trigger. This is the only place you look for candle patterns, momentum shifts, or level breaks to time the entry.
- Conflict rule: when the bias and structure timeframes disagree, no trade. Full stop. Disagreement between the two upper layers usually means the market is transitioning, and transitions produce whipsaw.
Candle Close and Repainting
A repainting indicator changes its historical output after the fact. The arrow that appears mid-candle disappears if price reverses before the close, leaving a chart history that shows only the arrows that worked.
This is why backtests of repainting tools look phenomenal and live results look nothing alike.
The tool was never predicting.
It was reporting, retroactively.
- Non-repainting means the signal is fixed at candle close and never revised. If the 15-minute candle closes and the arrow is there, it stays there permanently, whether the next candle is up or down.
- Test it yourself in three minutes. Watch a live chart during an active session. If arrows appear and vanish before the candle completes, the indicator repaints.
- Intrabar flicker creates false urgency. A signal that flashes at 40 seconds into a 15-minute candle has 14 minutes to be wrong, and traders who act on it are effectively entering on noise.
- The cost of waiting is real but small. Yes, you enter a few pips worse on a genuine breakout. You also skip the majority of false breakout traps, which is a trade you would rather not have.
When a Signal Should Be Ignored
Some of the best trading decisions produce no trade. These conditions override any signal, no matter how textbook the pattern looks:
- Abnormal spread widening. If the spread on a pair that normally costs 0.8 pips is sitting at 4.5 pips, your risk-reward math is already broken before entry. Check the spread every single time before clicking.
- Scheduled high-impact news. Non-farm payrolls, CPI releases, and central bank rate decisions produce slippage that can turn a 20-pip stop into a 60-pip loss. Stand aside for a window of roughly 15 minutes before and 30 minutes after.
- Thin holiday liquidity. Late December, national holidays, and the Friday close all produce low-volume tape where levels break easily and reverse just as easily. Technical levels need participants to defend them.
- Unclear or choppy structure. If you cannot draw the trend with a single line, the market is ranging. Trend signals in ranges generate whipsaw after whipsaw, and range signals in trends get run over.
- Poor risk-reward ratio. A perfect setup where the logical stop is 40 pips away and the logical target is 45 pips away is not a perfect setup. It is a low-quality trade wearing a nice pattern.
- Correlated position overlap. Long EURUSD, long GBPUSD, and short USDCHF are largely the same trade expressed three ways. You are running triple risk while believing you diversified.
One more warning worth its own paragraph.
Stacking three momentum oscillators (RSI, Stochastic, and CCI, say) does not give you three confirmations.
They are computed from nearly identical inputs and will agree with each other almost always.
That is not confluence, that is one opinion repeated in three colors.
Genuine confirmation comes from independent categories: trend, momentum, volume, and structural levels.
Judging Accuracy Without Guessing
Ask a signal provider for their win rate and you will get a number. Ask for their trade expectancy and average loss size and watch the conversation change.
Win Rate Isn’t the Whole Story
Expectancy is the only accuracy metric that predicts whether a signal set makes money. The formula is straightforward:
Expectancy = (win rate x average win) minus (loss rate x average loss)
Run the numbers on a 70% win rate system.
Seventy wins at $100 each is $7,000. Thirty losses at $280 each is $8,400.
Net result: negative $1,400 across 100 trades, before commissions.
Now run a 40% win rate system.
Forty wins at $450 is $18,000. Sixty losses at $150 is $9,000.
Net: positive $9,000.
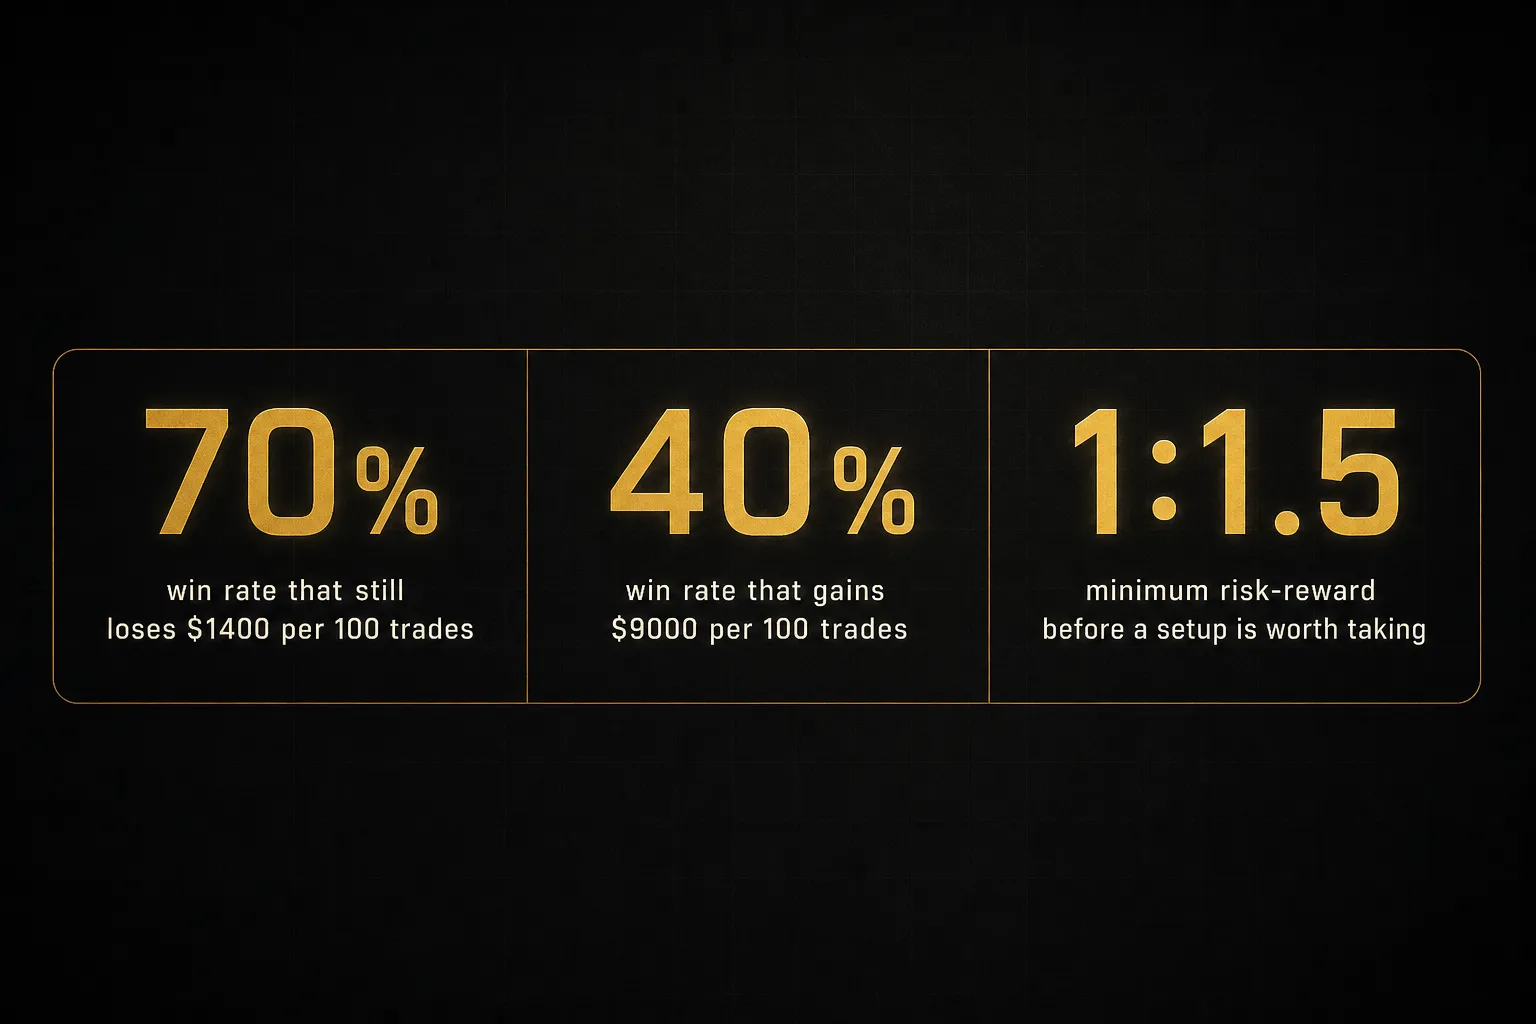
The 40% system is dramatically better and the marketing screenshot would never show it.
This is why profit factor (gross profit divided by gross loss) and maximum drawdown belong on every performance report alongside win rate.
A system with a 2.1 profit factor and 12% peak drawdown is tradeable. A system with a 1.05 profit factor and 45% drawdown will destroy the account before the edge materializes.
Backtesting the Right Way
Most published backtests are marketing artifacts.
A proper one has requirements:
- Sample size of at least 100 trades, preferably 200 or more. Thirty trades tells you almost nothing. Random sequences of 30 coin flips produce apparent edges routinely.
- Multiple market regimes. The test must cover trending periods, ranging periods, and at least one volatility shock. A strategy tested only on 2021 crypto or only on 2023 equities learned one environment, not a market.
- Out-of-sample testing. Build the rules on 70% of the data, then test on the untouched 30%. If performance collapses on the held-out portion, the rules were fitted to noise.
- Transaction costs and slippage included. Spread, commission, and realistic fill assumptions. A scalping system showing 3-pip average profit dies instantly when you add a 1.2-pip spread and 0.5-pip slippage.
- Drawdown measured, not glossed over. Peak-to-trough decline and the longest losing streak. If the worst streak was 11 consecutive losses, ask yourself honestly whether you would still be following the rules at loss number nine.
- Forward testing before real capital. Run the rules live on a demo or micro account for 30 to 60 trades. Forward testing catches execution problems that backtests never reveal.
Two failure modes deserve names.
Data-snooping bias happens when you test 200 parameter combinations and publish the best one; with enough attempts, something will look brilliant purely by chance.
Overfitting happens when rules get so specific to historical data (a 47-period moving average, a 63.5 RSI threshold) that they describe the past perfectly and predict nothing.
If a strategy’s performance collapses when you change a parameter by 10%, the edge was never in the strategy. It was in the parameter.
Vetting a Signal Provider
Due diligence on a provider takes about 20 minutes and saves considerably more than that. Work through this checklist:
- Timestamped, verifiable track record. Signals published before the outcome, on a platform that cannot be edited retroactively. Screenshots are not evidence.
- Losing trades and break-evens disclosed. A feed showing only winners has been curated. Real signal histories are roughly 40-60% losers and say so plainly.
- Transparent methodology. You do not need proprietary code, but you should be told the logic category: trend-following, mean-reversion, breakout, or order-flow based. “Proprietary AI” is not a methodology.
- Clear fee structure. Flat subscription is cleanest. Profit-share arrangements can incentivize oversized risk, and rebate-driven models can incentivize overtrading.
- Regulatory disclaimers and conflicts of interest. Is the provider paid by a broker for referred volume? That is a legitimate business model, but it needs disclosing, because it changes whose interests the signals serve.
- Stated stop-loss on every signal. Any provider issuing directional calls without invalidation levels is transferring all the risk work to you while keeping credit for the wins.
On AI-labeled signals: as of 2026 the label covers everything from genuine machine-learning classifiers trained on labeled price data to simple rule engines with a rebrand.
Ask what the model was trained on, what features it uses, and how often it is retrained.
And distinguish manual signals (a human reviews and confirms before publishing, slower but filtered) from fully automated signals (rule-triggered with no discretion, faster and more consistent but blind to context the rules never encoded).
Signal Questions, Answered
What are the best trading signals for beginners?
The best beginner signals separate direction from entry and display visible stop-loss and take-profit levels.
A signal that says “EURUSD long, enter on 15M close above 1.0842, stop 1.0801, target 1.0925” teaches structure.
A signal that says “BUY EURUSD NOW” teaches dependency.
Prioritize non-repainting tools with higher-timeframe context over anything promising rapid scalp alerts. Slower signals give you time to check the conditions before committing capital.
Do trading signals actually work?
Signals can meaningfully improve consistency when paired with confirmation rules and disciplined risk management, but no signal or provider has a guaranteed win rate. Their real value is procedural: they impose a repeatable structure on decisions that traders otherwise make emotionally.
The signal supplies a hypothesis.
Position sizing, stop placement, and the willingness to skip marginal setups supply the profitability.
Traders who follow good signals with poor risk control still lose.
How do I read a trading signal?
Read a signal by checking six fields before you act: direction, entry trigger, invalidation level, stop-loss, take-profit target, and the timeframe it applies to. If any field is missing, treat the signal as incomplete and either fill the gap yourself or skip it.
Then verify the timeframe matches your intent.
A signal built for a 5-minute chart has no business being held for three days.
What is the most accurate buy and sell signal indicator?
No single indicator is universally most accurate, and any source claiming otherwise is selling something. Reliability depends on market conditions, the confirmation rules attached, and out-of-sample validation, not the indicator’s name.
Moving average crossovers perform well in sustained trends and poorly in ranges. RSI and Bollinger Bands excel at mean-reversion in ranges and get destroyed in trends.
Match the tool to the regime.
Are free trading signals reliable?
Free signals can be genuinely useful, but they far more often lack the transparency needed to evaluate them. Free frequently means the provider monetizes elsewhere, usually through broker referral rebates tied to your trading volume.
Apply the identical checklist you would to a paid service: verifiable timestamped history, disclosed losses, stated methodology, and stop levels on every call.
Price is not the variable that determines quality.
How do I verify a trading signal before taking a trade?
Verify a signal in four checks: multi-timeframe alignment, candle-close confirmation, current spread and liquidity conditions, and whether the reward justifies the risk. The whole sequence takes under 60 seconds once it becomes habit.
Add a fifth for the economic calendar.
A technically perfect setup 10 minutes before a rate decision is a gamble with a chart attached.
Make Every Signal Earn Its Trade
Here is the decision rule, and it is short enough to write on a sticky note.
If a signal lacks multi-timeframe alignment, a clear invalidation level, or an acceptable risk-reward ratio, skip the trade.
It does not matter how clean the pattern looks or how confident the provider sounds.
Missing components are missing components, and conviction does not fill the gap.
If the signal has all four elements (direction, entry, stop-loss, target) and confirms across your bias and structure timeframes, then size the position by risk percentage and execute.
Follow the plan.
No moving the stop wider because price came close, no taking profit early because the trade felt uncomfortable, no adding to a loser to improve the average.
Mid-trade discretion is where documented edges quietly die.
A signal is one input into a decision process. It is never the decision itself.
The final piece is review.
Log every trade, including the ones you skipped and the reason you skipped them.
Once a month, sort by outcome and look for patterns: which conditions produced your losses, whether your winners came from aligned setups or lucky counter-trend entries, whether your actual risk per trade matched your stated risk.
That review loop is the difference between a repeatable process and expensive guesswork.
Losses reviewed honestly are tuition.
Losses ignored are just losses.
Sources
Risk Disclaimer: Trading involves risk. Past performance doesn't guarantee future results. Only trade with money you can afford to lose. PipTrend is a tool to assist your trading decisions, not financial advice.