ATR Indicator Explained: Volatility, Stops, and Sizing
On this page
Why Every Trader Eventually Needs ATR
Most traders discover the ATR indicator after getting stopped out three times in a row on trades that eventually went their way. The setups were fine.
The stops were too tight.
Average True Range was developed by J. Welles Wilder Jr. and published in his 1978 book New Concepts in Technical Trading Systems, originally for commodity futures markets. It measures one thing only: how much an instrument moves in a typical period.
Not where it’s going. How far it travels getting there.
That single number quietly informs four decisions you make on every trade. How far away your stop belongs. How big your position can be. Whether a breakout has real force behind it. And when to tighten or trail a stop as a move matures.
It works the same way on EUR/USD, Bitcoin, Apple shares, the Nasdaq 100, and crude oil.
Here’s the mistake that costs people money: reading rising ATR as bullish.
It isn’t.
ATR climbs during panic selloffs just as readily as during melt-ups, and it climbs hardest during violent, directionless chop that shreds both longs and shorts.
ATR is a volatility indicator, and volatility has no opinion about direction.
What ATR Actually Measures
ATR is the smoothed average of True Range over a lookback period, defaulting to 14. That’s the whole definition.
The interesting part is what “True Range” means and why Wilder bothered inventing it instead of just using high minus low.
True Range vs a Normal Trading Range
A normal trading range is simple: the day’s high minus the day’s low.
It works fine until the market gaps.
Imagine a stock closes at $100, then an earnings release hits overnight and it opens at $92, trading between $91 and $93 all day. The high-low range says the stock moved $2.
Anyone holding it knows the real move was closer to $9.
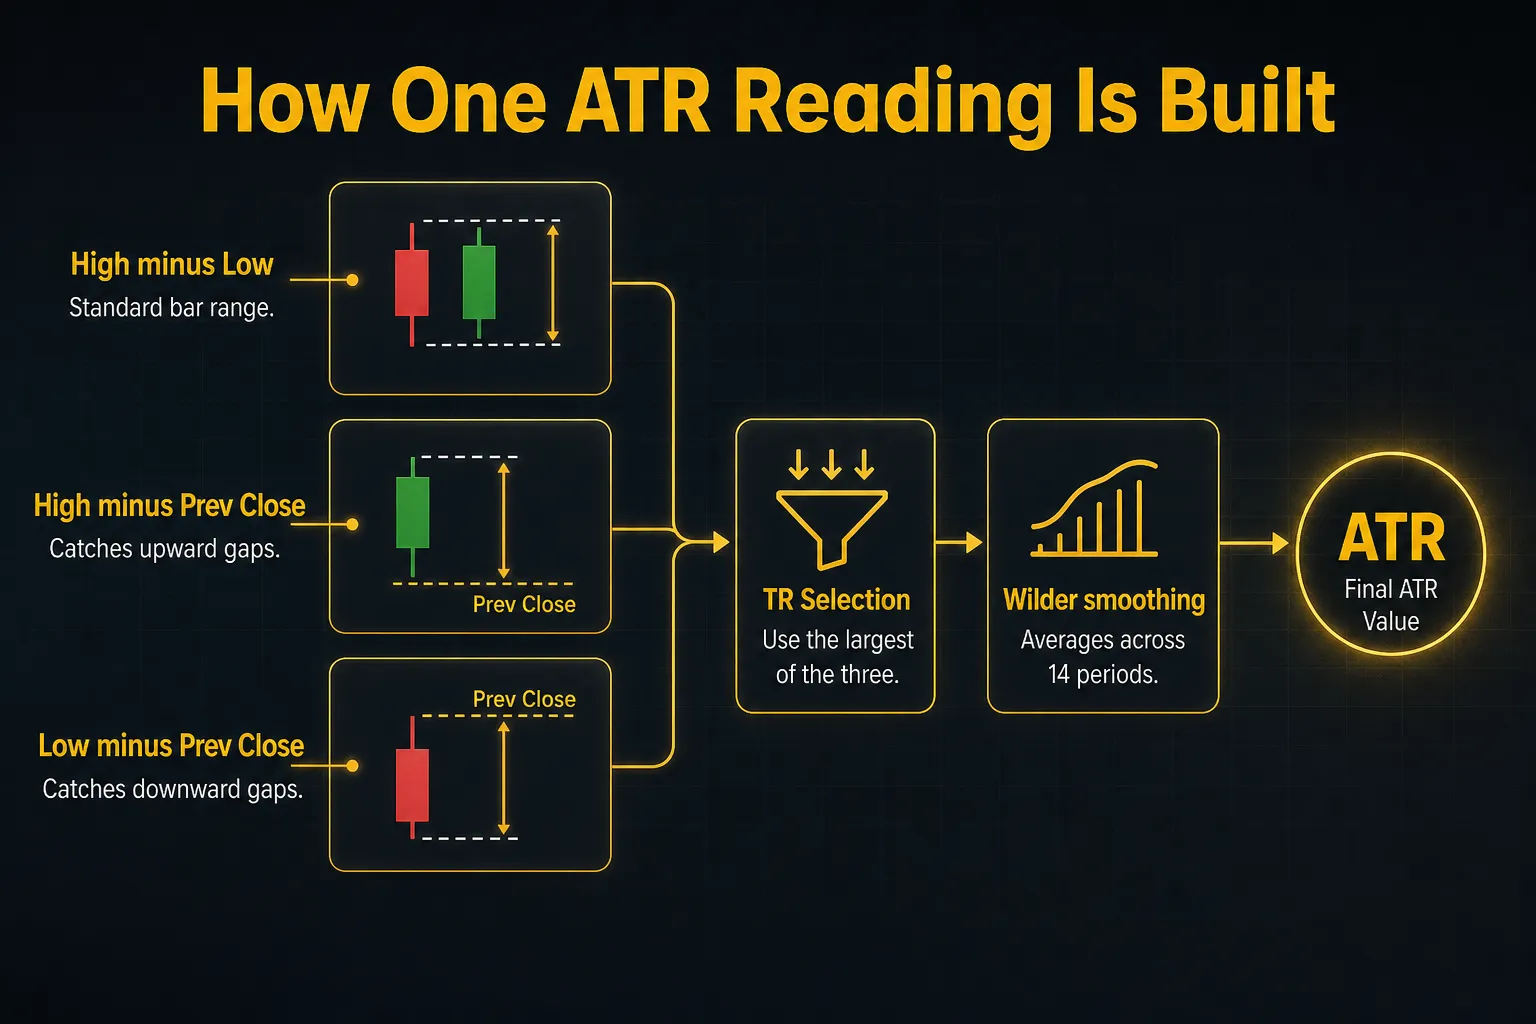
True Range fixes this by taking the greatest of three values:
- Current high minus current low, the standard intraperiod range.
- Absolute value of current high minus previous close, captures upward gaps.
- Absolute value of current low minus previous close, captures downward gaps.
In the earnings example, the third calculation gives $100 minus $91, or $9.
True Range reports $9.
That’s the honest number, and it’s the one that matters when you’re deciding where a stop can survive.
This design also handles limit moves in futures, thin overnight sessions in crypto, and Monday-morning weekend gaps in forex. Any time price relocates without trading through the intervening levels, plain high-low understates the damage. True Range doesn’t.
A Full Calculation Walkthrough
Numbers make this concrete.
Say we have five daily bars on a stock, with the prior close at $50.00.
| Day | High | Low | Prev Close | True Range |
|---|---|---|---|---|
| 1 | $51.20 | $50.10 | $50.00 | $1.20 (H − prev C) |
| 2 | $52.00 | $50.80 | $51.00 | $1.20 (H − L) |
| 3 | $51.50 | $49.40 | $51.80 | $2.40 (prev C − L) |
| 4 | $50.20 | $49.00 | $49.60 | $1.20 (H − L) |
| 5 | $53.00 | $50.50 | $49.90 | $3.10 (H − prev C) |
Note days 1, 3, and 5.
In each case the gap-aware calculation produced the largest value, so plain high-low would have understated volatility by 30-60%.
The first ATR reading is a simple average of the first N True Range values. Using our five bars as a 5-period example: (1.20 + 1.20 + 2.40 + 1.20 + 3.10) ÷ 5 = $1.82.
Every subsequent reading uses Wilder smoothing, also called RMA (running moving average or Wilder’s moving average):
Current ATR = [(Previous ATR × (N − 1)) + Current True Range] ÷ N
If day 6 produces a True Range of $2.50, the new ATR is [(1.82 × 4) + 2.50] ÷ 5 = $1.96.
The reading moved up, but gently.
That’s the point of Wilder smoothing: it dampens single-bar shocks so ATR describes a volatility regime rather than reacting to every spike.
Mathematically, RMA is equivalent to an exponential moving average with a smoothing factor of 1/N, which for 14 periods means each new bar gets roughly 7% weight.
Slow by design.
That slowness is both ATR’s strength and, as we’ll see, its main weakness.
Why 14 Became the Default
Wilder standardised on 14 periods across most of his indicators, including RSI and DMI, because he was working with daily commodity charts and 14 days approximated half a lunar month of trading activity. It was a practical choice, not a mathematically optimal one, and it stuck for nearly five decades.
Shorter settings react faster.
A 7-10 period ATR picks up volatility shifts within a session or two, which suits day traders working 5-minute and 15-minute charts where a stale reading is worse than a jumpy one.
Longer settings smooth harder.
A 20-21 period ATR gives swing and position traders a stable picture of historical volatility that won’t whipsaw their stop placement after one wild bar.
Neither is “better.”
Shorter ATR means tighter stops that adapt quickly but get hit more often. Longer ATR means wider, steadier stops and smaller positions.
Pick based on how long you hold, then leave it alone.
Constantly re-optimising the ATR period is curve-fitting with extra steps.
Reading ATR Values Correctly
ATR is one of the easiest indicators to calculate and one of the easiest to misread. Almost every misreading traces back to treating the number as an absolute rather than a relative measure.
Rising vs Falling ATR
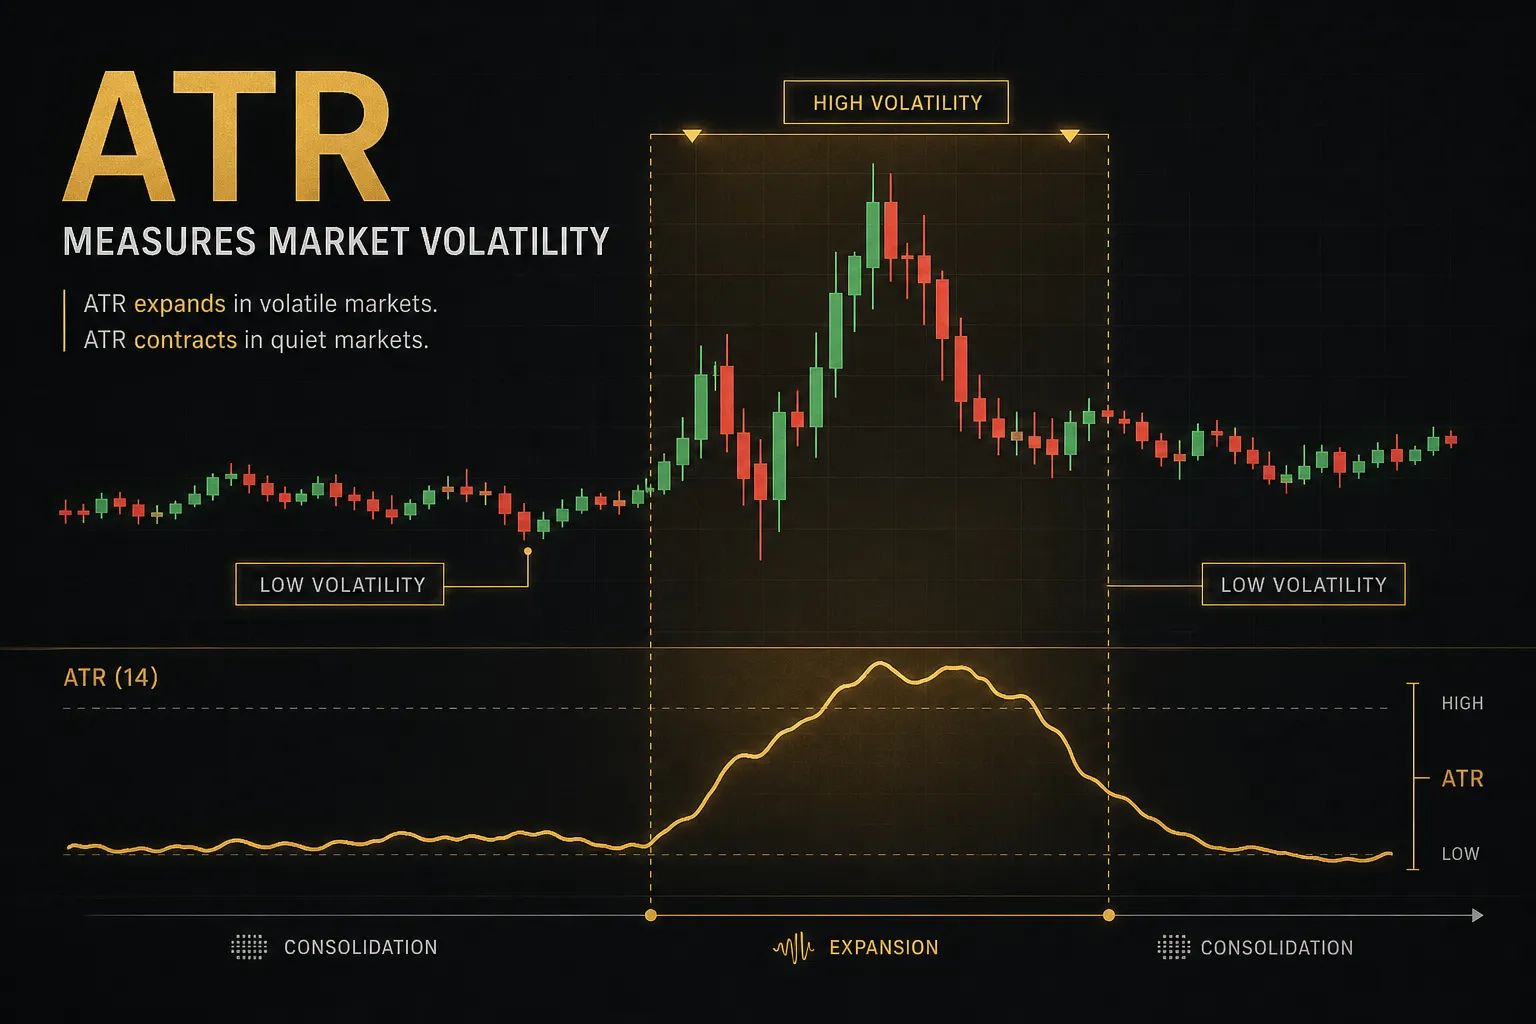
Rising ATR means volatility expansion.
Bars are getting bigger, gaps are appearing, and the distance price covers per period is growing. This happens during strong trends in either direction, during news shocks, and during the ugly two-sided churn that follows a failed breakout.
Falling ATR means volatility contraction.
Ranges are compressing, participation is thinning, and price is coiling. Extended contraction frequently precedes expansion, which is why traders watch multi-week ATR lows as a setup condition rather than a signal.
The practical read is straightforward.
Expanding volatility means wider stops, smaller size, and faster targets. Contracting volatility means tighter stops, larger size for the same dollar risk, and patience while the range builds.
What ATR never tells you is which side of the range will break. Pair it with structure, trend, or momentum for that.
Raw ATR vs ATR Percentage
An ATR of 2.50 is high, low, or normal depending entirely on what you’re looking at.
On a $12 stock it’s enormous. On a $900 stock it’s nothing. On gold futures it’s a quiet afternoon.
The fix is ATR percentage: ATR divided by current price, expressed as a percent. This normalises volatility so wildly different instruments become comparable.
| Instrument | Price | Daily ATR(14) | ATR % | Read |
|---|---|---|---|---|
| Small-cap stock | $5.00 | $0.35 | 7.0% | Very volatile |
| Large-cap stock | $500.00 | $8.00 | 1.6% | Normal equity |
| EUR/USD | 1.0850 | 0.0060 | 0.55% | Typical major pair |
| Bitcoin | $68000 | $2400 | 3.5% | Elevated |
| Gold spot | $2400 | $28.00 | 1.2% | Subdued |
Now the small-cap is clearly four times more volatile than the large-cap, and EUR/USD is revealed as the calmest instrument on the list despite its ATR looking like a rounding error.
The second comparison that matters is against the instrument’s own history. Is today’s ATR above or below its own 100-day average?
That tells you whether you’re in an expansion or contraction regime, and it’s more actionable than any cross-asset comparison.
Why Platforms Show Different Numbers
Open the same chart in TradingView and MT4 and the ATR readings often disagree. That’s expected, and there are four reasons.
Smoothing method. Wilder’s original spec uses RMA. Many platforms let you swap in SMA, EMA, or WMA, and each produces a different value from identical price data.
TradingView’s built-in ATR defaults to RMA; some broker implementations quietly default to SMA.
Data history length. Because RMA is recursive, the very first ATR seed value propagates forward forever with decaying influence. A chart loaded with 300 bars of history and one loaded with 5000 will converge closely but not exactly.
Session and feed definitions. Forex has no central exchange, so your broker’s 5pm New York close is another broker’s 5pm London close. Different daily boundaries mean different highs, lows, and closes, which means different True Range values.
Missing or extra bars. Extended-hours data, holiday half-sessions, weekend crypto bars, and thin-liquidity gaps all shift the calculation. Two feeds that disagree on whether a bar exists will disagree on ATR.
Small discrepancies are harmless.
Just don’t build a system on one platform’s exact ATR value and expect identical results elsewhere.
Turning ATR Into Trade Decisions
Reading ATR is easy.
Using it is where traders actually gain an edge, because ATR converts a vague feeling that “this market is choppy” into a specific number you can build stops and position sizes around.
Setting Stops with ATR Multiples
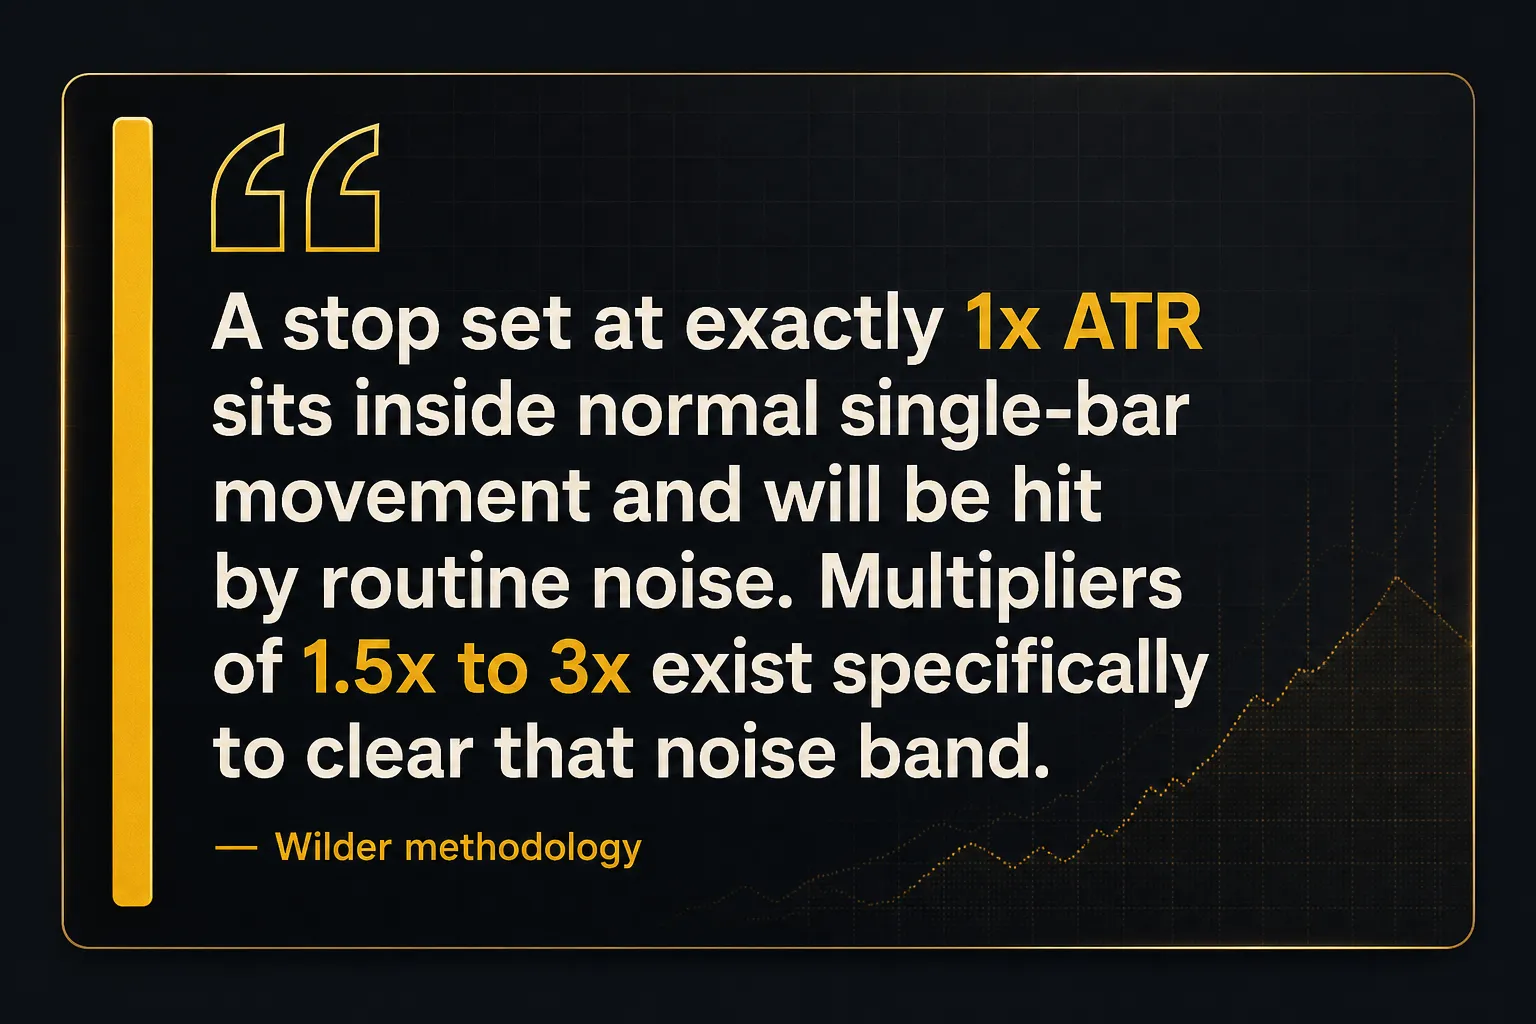
The core technique: place your stop at entry price minus (ATR × multiplier) for longs, or plus that distance for shorts. Common multipliers run from 1.5x to 3x ATR.
Why a multiple instead of the raw ATR? Because a stop exactly one ATR away sits inside normal noise.
If a typical bar travels one ATR, a one-ATR stop will get tagged by ordinary movement roughly half the time.
The multiplier buys you room outside routine fluctuation.
But a fixed multiplier is lazy. Four things should push it up or down:
- Timeframe. Intraday trades on 5-minute charts often work with 1.5-2x ATR. Daily swing positions typically need 2-3x to survive an overnight gap.
- Market regime. In a clean trend, 2x usually holds. In post-news chop, the same 2x gets swept repeatedly, so either widen it or stand aside.
- Spread and slippage. On instruments where the spread is a meaningful fraction of ATR, exotic forex pairs, small caps, thin altcoins, add cushion or your stop is effectively tighter than the chart suggests.
- Setup type. Mean-reversion entries near an extreme can use tighter stops because you’re buying at the edge of the range. Breakout entries need wider stops because the retest is part of the pattern.
ATR also drives dynamic stop loss and trailing stop logic. Recalculate ATR × multiplier from each new swing high, ratchet the stop up, never down.
This is the mechanism behind the Chandelier Exit and most ATR trailing stop scripts.
Sizing Positions From Volatility
Here’s the connection most traders miss.
If your stop distance is set by volatility and your risk per trade is fixed, then position sizing must be the variable that adjusts.
The formula:
Position size = (Account × Risk %) ÷ (ATR × Multiplier)
Work an example.
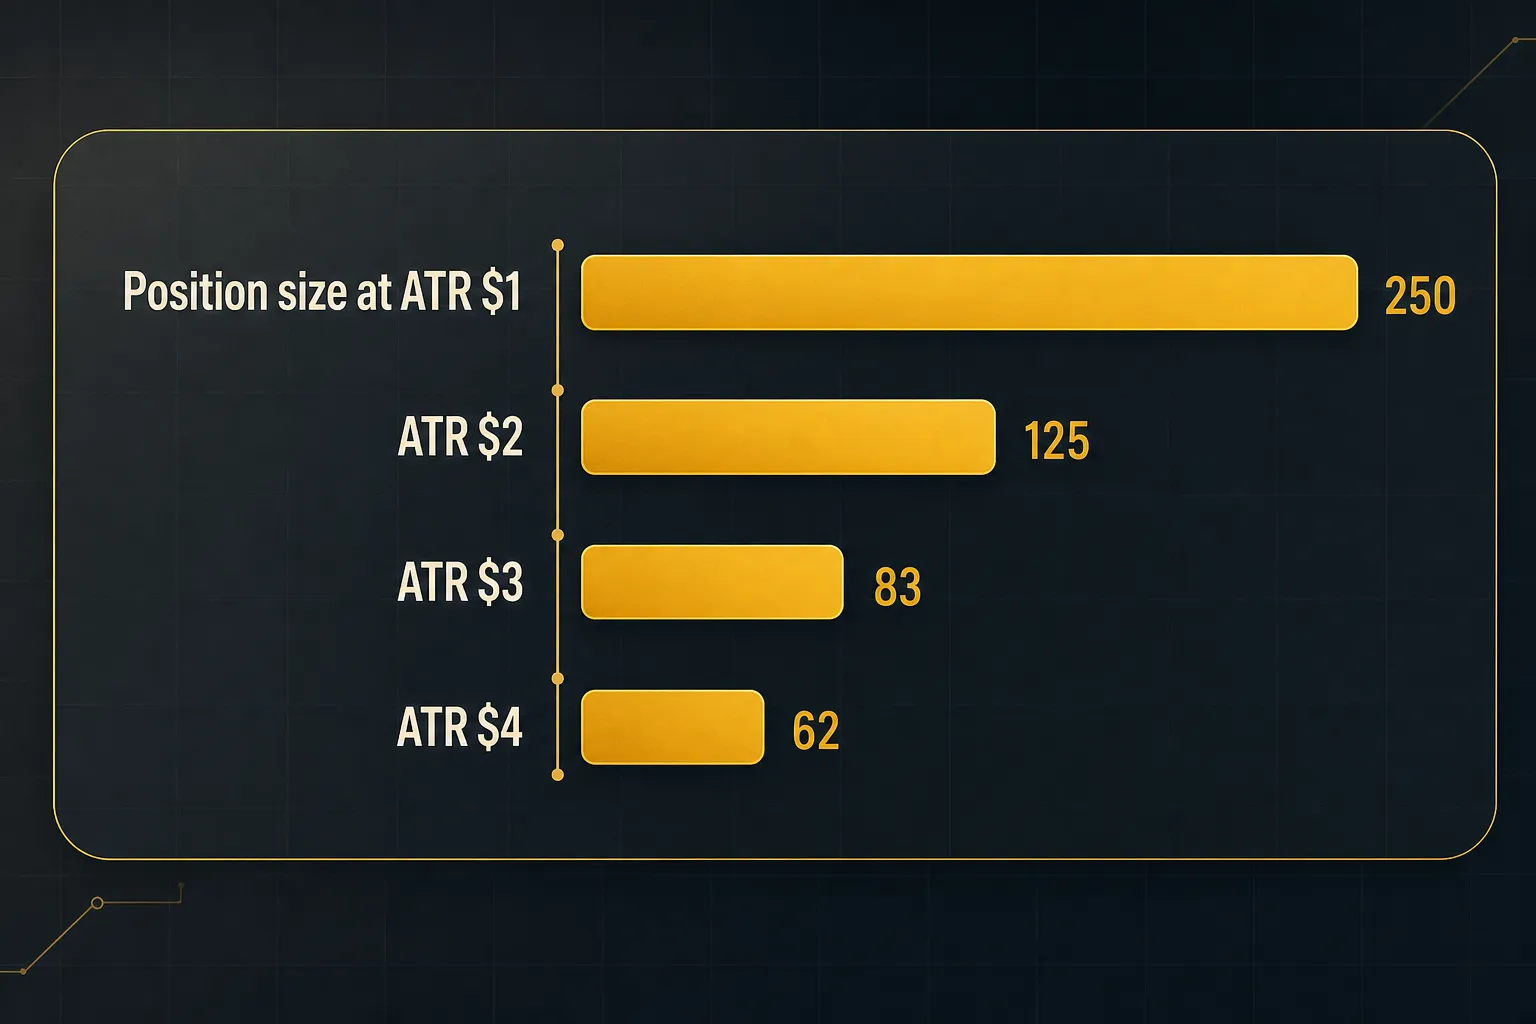
A $50,000 account risking 1% per trade means $500 at risk. The stock trades at $80 with a daily ATR of $2.00, and you’re using a 2x multiplier, so your stop is $4.00 away.
$500 ÷ $4.00 = 125 shares, a $10,000 position.
Now volatility doubles.
ATR rises to $4.00, the 2x stop becomes $8.00, and the same $500 risk allows only 62 shares, a $4,960 position.
Your dollar risk didn’t change.
Your exposure halved automatically.
This is why volatility-based sizing beats fixed share or fixed lot sizing. Traders who buy 100 shares regardless of conditions are unknowingly taking four times more risk in a volatile market than a calm one.
ATR removes that blind spot.
Breakouts, Timeframes, and Pairing With Direction
ATR earns its keep on breakout confirmation. The pattern worth learning: a range that compressed on falling ATR, followed by a breakout bar where ATR expands sharply.
Compression stored energy.
Expansion released it.
The failure mode is a breakout with flat or declining ATR. Price pokes above resistance without any increase in range or participation, and it usually returns inside the range within a few bars.
Now the honest caveat.
ATR lags.
It’s a 14-period average, so after a genuine volatility shock it stays elevated for many bars even as the market calms down.
Apply ATR stops mechanically in that window and you’ll take positions that are too small with stops that are absurdly wide.
Check whether the shock is still active or already history.
The fix for most of this is multi-timeframe use. Read ATR on a higher timeframe for regime context: is the daily ATR above or below its own average, and is it rising or falling? Then execute entries and calculate stops on your trading timeframe.
Regime from above, precision from below.
And ATR still tells you nothing about direction.
That’s not a flaw, it’s a division of labour.
ATR handles the risk layer; something else has to handle the “which way” question.
This is exactly the pairing that platforms like PipTrend are built around. Its multi-timeframe confirmation table shows whether higher and lower timeframes agree on direction, while its non-repainting entry signals mark specific entry points that don’t shift after the fact.
Layer ATR-based stop distance and position sizing on top of confirmed direction and you get a complete decision: where, which way, how far, and how much.
Where ATR Falls Short
Every indicator has a domain where it’s useless. Knowing ATR’s boundaries is what separates traders who use it well from those who overextend it into decisions it was never built for.
- Zero directional information. ATR cannot distinguish a 3% rally from a 3% collapse. Both produce the same reading. Any strategy that treats a rising ATR line as bullish is misreading the tool at a basic level.
- It lags volatility shocks. Wilder smoothing gives each new bar roughly 7% weight at the default 14-period setting. That means ATR reacts slowly on the way up and stays inflated on the way down, often for 10-20 bars after conditions have normalised.
- Raw values are not comparable across instruments. An ATR of 45 on the Nasdaq and 45 on a single stock describe completely different realities. Convert to ATR percentage before making any comparison.
- Real-world costs are invisible on the chart. A 1.5x ATR stop that looks comfortable in the chart window may be functionally tight once you add the bid-ask spread, commission, expected slippage on a market-order exit, and the spread widening that happens around scheduled news.
- Weekend and holiday gaps distort True Range. A Monday forex gap or a Sunday crypto move can inject an outsized True Range value that keeps ATR elevated for weeks, quietly shrinking every position size you calculate afterward.
- ATR is not the same as the tools built on it. ATR bands, Keltner Channels (which use ATR for band width around an EMA), and the Chandelier Exit are derived tools with their own parameters and behaviours. Testing a Keltner strategy tells you nothing about raw ATR.
The misuse checklist, short enough to remember:
- Never use ATR alone as an entry trigger. It has no directional content, so there is nothing to trigger on.
- Never compare raw ATR across assets. Use ATR percentage or compare against the instrument’s own history.
- Never assume a fixed value is universally high or low. Context is the whole game.
- Never ignore gaps. Check whether a single outlier bar is inflating your current reading before you size a trade off it.
Common ATR Questions Answered
What is the ATR indicator and how does it work?
The ATR indicator is a volatility measure that averages True Range over a set number of periods, typically 14. True Range takes the largest of three values for each bar: high minus low, high minus previous close, or low minus previous close, which lets it account for gaps that a plain high-low range would miss.
The first reading is a simple average of those True Range values. Every reading after that uses Wilder smoothing (RMA), so the line describes a sustained volatility regime rather than reacting to individual bars.
Is a high ATR good or bad?
Neither.
High ATR simply means larger price movement per period, which increases both profit potential and loss potential on the same position size.
What makes it good or bad is how you respond. Traders who widen stops and reduce position size in high-volatility conditions keep their dollar risk constant.
Traders who keep the same size and stop through a volatility expansion are taking substantially more risk than they realise.
What is the best ATR setting for trading?
ATR(14) remains the standard and works well for most swing trading on daily charts. Day traders on intraday charts often prefer 7-10 periods for faster response, while position traders sometimes use 20-21 for extra smoothing.
Match the setting to your holding period and then stop adjusting it. Repeatedly optimising the lookback on historical data produces settings that look excellent in backtests and fail forward.
How do you use ATR to set stop loss and take profit?
Set the stop at entry price plus or minus (ATR × multiplier), commonly 1.5x to 3x depending on timeframe and market conditions. For a long entry at $100 with an ATR of $2 and a 2x multiplier, the stop goes at $96.
For targets, apply a larger multiple to maintain a favourable reward-to-risk ratio, for instance a 4x ATR target against a 2x ATR stop for 2:1. Many traders instead trail the stop by ATR from each new swing extreme and let the market decide the exit.
Does ATR show trend direction?
No.
ATR measures the size of price movement, not its direction, and it rises equally during sharp advances and sharp declines.
You need a separate directional method: moving averages, market structure, momentum oscillators, or multi-timeframe trend confirmation.
ATR answers “how far,” never “which way.”
What does ATR 14 mean?
ATR 14 means the Average True Range is calculated over a 14-period lookback, so on a daily chart it reflects the smoothed average True Range of the last 14 trading days.
An ATR(14) of 1.80 on a daily stock chart tells you the stock has been covering roughly $1.80 of range per day recently, gaps included.
That’s your baseline for stop distance and position size.
The One Habit Worth Building
One habit, applied consistently, changes more about trading results than any indicator setting: check ATR before you decide direction.
The sequence is deliberately backwards from how most people trade.
Pull up the current ATR. Compare it to its own average over the last 50-100 bars.
Calculate your stop distance from that number, then calculate the position size that keeps your risk per trade at your fixed percentage.
Only then look at whether you want to be long or short.
Doing it in that order makes the volatility regime a constraint rather than an afterthought. You stop taking oversized positions into expanding volatility, and you stop setting noise-tight stops because a chart pattern looked clean.
ATR is a risk and management layer.
It sizes trades, places stops, and validates whether a breakout has force behind it.
It will never tell you where price is going, and it was never meant to.
Give it a directional method to work alongside, and it becomes one of the most reliable tools on the chart.
Risk Disclaimer: Trading involves risk. Past performance doesn't guarantee future results. Only trade with money you can afford to lose. PipTrend is a tool to assist your trading decisions, not financial advice.