
You enter a gold long at 2,048 on the H1 because the Daily shows bullish momentum. Price drops 40 pips in fifteen minutes. You exit at 2,044, frustrated. Twenty minutes later, gold climbs to 2,062, hitting your original target without you. This happens because direction and entry are separate decisions, and most traders blur them together when they trade for gold. Knowing gold is bullish doesn't tell you where to enter. That's the gap that kills accounts.
Why Gold Requires Different Trade Execution Than Currency Pairs
Gold moves differently than EURUSD or GBPJPY. The average true range on XAUUSD runs 800 to 1,200 pips daily in 2026, while major pairs rarely exceed 100 pips. This volatility demands tighter entry precision and wider stops, but most traders apply Forex rules directly to gold and wonder why their 20-pip stops get hunted. When you trade for gold, your risk-reward ratios need recalibration. A 1:2 RR that works on EURUSD translates poorly to gold's intraday swings. You need 1:3 minimum, often 1:5, to account for the noise between your entry and the actual move.
Gold respects institutional levels harder than currency pairs. VWAP, previous day high and low, and weekly opening prices act as magnets. If you enter a long at 2,050 and VWAP sits at 2,047, price will likely wick down to test it before your bullish scenario plays out. Free indicators show you the trend, but they won't highlight these liquidity zones. You enter based on direction alone, and the market sweeps your stop before confirming your bias. According to gold trading strategies research, trend-following approaches work best when combined with precise entries at key levels rather than random pullback entries.

Speed is another differentiator. Gold can move 30 pips in sixty seconds during news events or session opens. If you're trading the 5-minute chart without higher timeframe confirmation, you'll catch reversals that never materialize. The 5m shows a bullish engulfing candle, you enter long, and the H1 is still in a downtrend. Price bounces 15 pips, then collapses 60. Your entry wasn't wrong in isolation. Your timeframe alignment was absent. When you trade for gold systematically, you check at minimum three timeframes: your entry chart, the trend chart one level higher, and the macro chart two levels higher. If you enter on 5m, you need H1 for trend and H4 or Daily for macro bias.
Building a Systematic Approach to Trade for Gold on Multiple Timeframes
Direction starts on the higher timeframe. Open your Daily chart. Identify the trend using price structure-higher highs and higher lows for bullish, lower highs and lower lows for bearish. Don't rely on lagging moving averages. Price action tells you everything. If Daily is bullish, drop to H4. If H4 confirms the same direction, you have alignment. If H4 is bearish or choppy, you wait. No trade. Conflicting timeframes produce conflicting results, and understanding gold market dynamics shows that institutional flows often respect multi-timeframe alignment during major moves.
Your entry timeframe should be two to three levels below your trend timeframe. If you're using Daily for trend, H1 or H4 becomes your entry chart. If you're using H4 for trend, 15m or 5m becomes your entry chart. The smaller timeframe gives you precision, but the higher timeframe gives you confidence. You're not guessing. You're waiting for price to return to a level that makes sense given the larger context. This is how prop firm traders survive drawdown limits. They don't enter because the 1m looks good. They enter because the 1m aligns with the H4 trend and price is sitting at a Daily support level.
Entry signals need confirmation after the candle close. Most free indicators repaint, meaning the signal you see during the candle disappears after it closes. You enter based on a BUY signal at 2,051, but after the close, the signal vanishes and price reverses. Non-repainting signals only appear after the candle fully forms. You lose the speed advantage, but you gain reliability. On gold, reliability beats speed. A 5-pip worse entry with a confirmed signal outperforms a 5-pip better entry that reverses thirty seconds later.
Liquidity levels define your exact entry price. Identify previous day high (PDH), previous day low (PDL), VWAP, and weekly open. These levels attract institutional orders. If your H4 trend is bullish and price pulls back to PDL at 2,042, that's your entry zone. You don't enter at 2,050 just because the 15m shows a bullish candle. You wait for price to reach the level where big money is likely to defend the trend. As noted in gold trading techniques, range-bound strategies around key levels often outperform momentum entries during consolidation phases.
How to Use Multi-Timeframe Confirmation Tables
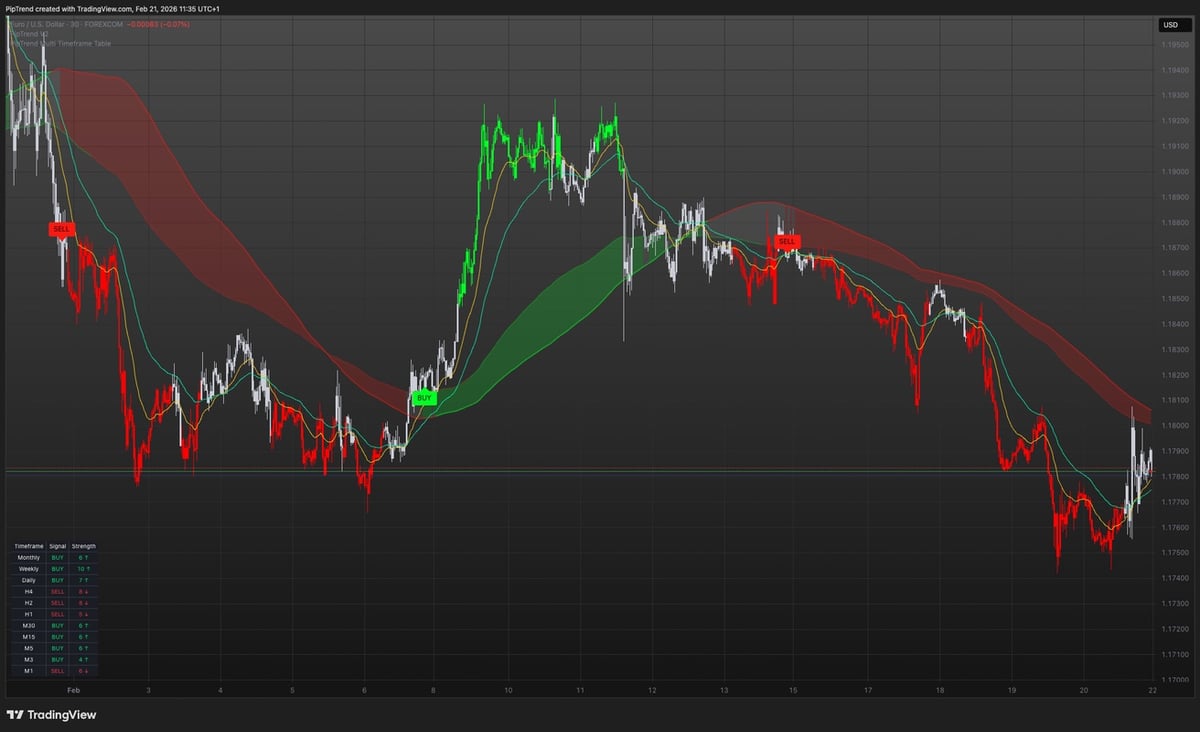
A confirmation table shows you twelve timeframes at once: 1m, 5m, 15m, 30m, H1, H2, H4, H8, H12, Daily, Weekly, Monthly. Each timeframe displays a directional bias-bullish, bearish, or neutral. You scan the table before entering any trade. If ten out of twelve timeframes show bullish and you're planning a long, your probability increases. If the table is split six bullish, six bearish, you're in no-man's land. No trade.
The table removes the need to flip between charts manually. You see 1m through Monthly in one glance. This saves time and prevents the common mistake of tunnel vision. You're focused on the 5m chart, see a setup, and enter without realizing the Daily just printed a strong bearish engulfing. The table forces you to acknowledge all timeframes before committing capital. For prop firm traders working under strict drawdown rules, this cross-timeframe verification prevents emotional trades that seem right in the moment but conflict with the larger structure.
Update frequency matters. The table should refresh in real-time as candles close. If you're watching a 15m setup and the H1 flips from bullish to bearish mid-trade, you know your thesis is weakening. You tighten your stop or exit at breakeven instead of holding through a reversal. The table becomes your trade management tool, not just your entry filter. You entered long on a bullish H1, but now H1 turns neutral and H4 flips bearish. You don't wait for your stop loss. You exit manually because the system told you the trade is no longer valid.
Separating Trend Direction from Entry Execution
Most traders fail to trade for gold because they treat direction as entry. The Daily chart is bullish, so they buy. That's not a strategy. That's a guess. Bullish Daily tells you the macro bias. It doesn't tell you whether 2,050 or 2,030 is the right price to enter. Entry requires a specific trigger at a specific level. Without that trigger, you're entering randomly within a bullish environment, and random entries produce random results.
Direction comes from structure. Entry comes from levels. You identify trend structure on the H4: higher highs, higher lows, bullish. Now you wait for price to pull back to a key level-previous structure, VWAP, or a supply zone turned demand. When price reaches that level and your entry timeframe (15m or 5m) prints a reversal pattern (bullish engulfing, hammer, or a confirmed BUY signal), you enter. Your stop sits below the level. Your target sits at the next structure high. This is systematic. This is repeatable.
Compare this to the typical approach: check the Daily, see it's bullish, enter a long at current price on the 5m, hope it works. No level. No confirmation. No plan for invalidation. If price drops 20 pips, is the trade wrong, or is it normal pullback? You don't know because you didn't define the level that invalidates your thesis. When you separate direction from entry, you define both. Direction is bullish above 2,040 Daily support. Entry is at 2,042 if price pulls back and prints confirmation. Stop loss is 2,038. Target is 2,060. Now you have a trade, not a gamble.

Institutional Levels and Liquidity Zones
VWAP resets daily. It represents the average price weighted by volume. Institutions use VWAP as a benchmark. If price trades above VWAP, the session is bullish. Below VWAP, bearish. When price pulls back to VWAP during a bullish session, institutions often add to positions. You use this as your entry level. Price is at 2,055, VWAP is at 2,048, Daily trend is bullish. You wait for price to retrace to 2,048, then enter long with confirmation. Your edge is entering where institutions are likely to defend the level, not where retail traders are chasing momentum at 2,055.
Previous day high and low act as magnets during the next session. If PDH is 2,062 and price opens at 2,050, there's a high probability price tests 2,062 during the session. If PDL is 2,038 and price opens at 2,050, there's a high probability price tests 2,038. These aren't random support and resistance lines. They're liquidity pools. Orders cluster at these levels. When price approaches PDH, stop losses from shorts and breakout buy orders create momentum. You enter before the breakout, at the retest level, not after price already moved 30 pips.
Weekly open serves as a bias filter. If price is above weekly open, the week is bullish. Below, bearish. When price returns to weekly open after moving away, it often bounces. You combine weekly open with your intraday levels. Daily trend is bullish, price pulls back to weekly open at 2,045, and your 15m prints a reversal signal. That's a high-probability entry because you're stacking confluence: Daily trend, weekly pivot level, and intraday confirmation.
Supply and demand zones mark areas where institutions accumulated or distributed positions. Unlike basic support and resistance, these zones show where price moved sharply away, indicating strong hands entering. If price rallies 80 pips from 2,040 in one H1 candle, 2,040 becomes a demand zone. When price returns to 2,040 on a pullback, you enter long. Institutions who bought at 2,040 the first time will likely defend it again. As highlighted in core gold trading strategies, combining supply/demand zones with trend direction significantly improves entry timing.
Managing Trades Across Assets: Forex, Crypto, Indices, Stocks
Gold trades 24 hours through Forex sessions, but liquidity peaks during London and New York hours. If you trade for gold during Asian session on low volume, spreads widen and whipsaws increase. Your entry at 2,050 might fill at 2,051 due to slippage, and your 15-pip stop becomes 16 pips. Enter during high-volume sessions. London open (3:00 AM ET) and New York open (9:30 AM ET) provide the cleanest price action and tightest spreads.
Crypto gold (tokenized gold) follows similar price action but trades around the clock with no session breaks. Volatility spikes at random hours based on crypto market sentiment, not traditional Forex sessions. If you trade tokenized gold, you can't rely on session liquidity timing. Instead, focus on volume profiles within the crypto environment. High volume periods on crypto gold occur when Bitcoin and Ethereum show strong directional moves, as correlated capital flows between assets.
Indices and stocks don't trade 24 hours. If you apply gold strategies to S&P 500 or individual equities, you'll face overnight gaps. Your stop loss at 4,500 on SPX means nothing if the market opens at 4,480 due to after-hours news. Gold offers continuous pricing, so your stop executes at your defined level (barring extreme volatility). Indices require gap risk management. You either avoid holding through the close or widen stops to account for potential gaps. The same directional and entry separation principles apply, but execution risk differs.
For traders managing multiple assets, the systematic approach stays consistent: define direction on higher timeframe, wait for entry on lower timeframe at institutional level, confirm with non-repainting signal, manage with multi-timeframe table. The asset changes, but the process doesn't. This repeatability is what prop firms evaluate. They don't care if you trade gold, EURUSD, or NASDAQ. They care whether you follow a defined process and manage risk consistently across all instruments.
When you trade for gold alongside other assets, avoid over-diversification. Three to five instruments is manageable. Fifteen isn't. You can't monitor twelve timeframes across fifteen assets and maintain quality execution. Pick two to three Forex pairs, one to two indices, and gold. Apply the same system. Same rules. Same timeframe alignment. Same entry criteria. Different assets, identical process. This builds muscle memory and removes decision fatigue.
Practical Setup: Timeframes, Risk Ratios, and Exit Planning
Your trade checklist should include specific parameters before entry. Define your trend timeframe (Daily or H4), your entry timeframe (H1, 15m, or 5m), your institutional level (VWAP, PDH/PDL, weekly open, supply/demand zone), and your confirmation signal (non-repainting BUY/SELL after candle close). If any parameter is missing, you don't enter. This removes emotional trading. The setup is either complete or it isn't.
Risk-reward ratios on gold should start at 1:3. If your stop loss is 15 pips, your target is 45 pips minimum. Gold's volatility supports wider targets. A 60-pip move happens multiple times per day. Don't settle for 1:1 or 1:2 because you're nervous about giving back profits. Tight targets force you to trade more frequently, increasing transaction costs and emotional fatigue. Wider targets let trades breathe and reduce trade frequency. Five trades per week at 1:5 RR beats twenty trades at 1:1.5, even with lower win rate.
Stop loss placement ties to your invalidation level, not arbitrary pip counts. If you enter long at 2,042 because price pulled back to demand at 2,040, your stop sits at 2,038, below the demand zone. If price trades below 2,038, the demand zone failed and your thesis is invalid. Your stop isn't "20 pips" because that sounds reasonable. It's 4 pips below the level that defines the trade. Sometimes that's 10 pips. Sometimes it's 25 pips. The market determines stop distance through structure, not your comfort level.
Partial exits improve risk management on volatile instruments like gold. Enter with two lots. When price moves 1:2 (30 pips profit on a 15-pip risk), close one lot and move stop to breakeven on the second. Now you're risking nothing and running the second lot to 1:5 or further. If price reverses, you banked profit from the first lot. If it continues, you maximize the second lot. This approach works better on gold than currency pairs because gold's momentum often extends beyond initial targets.
Trail stops using structure, not fixed pip distances. If you entered long at 2,042 and price rallies to 2,058, don't trail your stop 10 pips behind current price. Trail it to the most recent swing low on your entry timeframe. If 15m printed a swing low at 2,052, your trailing stop sits at 2,050 (below the swing low). This gives the trade room to pull back naturally without stopping you out on noise, while still protecting profit if the trend reverses.

How a Unified System Solves Direction and Entry Problems
Conflicting signals from multiple indicators create analysis paralysis. One indicator says buy, another says sell, and you freeze. Or worse, you enter based on whichever indicator aligns with your bias. A unified system eliminates this by giving you three defined roles: one component for trend direction, one for entry precision, and one for trade management. Each component has a single job. No overlap. No contradiction.
Direction signals need to be non-repainting and appear only after candle close. If you see a BUY signal at 2,050 while the candle is forming, but the signal disappears after the close, you just got baited. Non-repainting signals sacrifice real-time speed for accuracy. The signal confirms at 2,050 after the H1 candle closes. You enter knowing the signal won't vanish. This reliability matters more than entering 3 pips earlier with an uncertain signal.
Entry precision comes from institutional levels overlaid on your chart: VWAP, session highs and lows, weekly pivots, supply and demand zones. These levels aren't predictive. They're reactive. Price reaches the level, and you react based on your directional bias. If Daily is bullish and price drops to VWAP at 2,045, you're looking for long entries, not shorts. The level gives you the price. The direction gives you the bias. The entry signal gives you the timing.
Trade management through a multi-timeframe table lets you monitor all twelve timeframes without chart switching. You see when lower timeframes start conflicting with higher timeframes mid-trade. This signals potential reversal or weakening momentum. You adjust your trade-tighten stop, take partial profit, or exit-based on real-time timeframe shifts. The system tells you when conditions change, so you're not holding a trade based on outdated information.
For traders struggling with consistency, particularly those in prop firm challenges where drawdown limits are strict, this separation of roles creates a repeatable process. You're not interpreting. You're executing. Direction says bullish. Entry level is 2,042. Signal confirms. You enter. Stop at 2,038. Target at 2,060. Manage with timeframe table. Same steps, every trade, every asset. That's how you pass evaluations and build live track records. PipTrend was built specifically to provide this unified approach-trend direction from Core signals, entry precision at Session Liquidity levels, and management through the Multi-Timeframe Table-so you're not patching together five different tools that give conflicting information.
Common Mistakes When Traders Trade for Gold Without a System
Entering on direction alone is the most frequent error. You see Daily is bullish, so you buy at current price. No level. No confirmation. No plan. Price is at 2,055, and you enter because the bias is up. VWAP is at 2,048. Price drops to VWAP, triggers your stop at 2,050, then rallies to 2,070. You had the right direction, wrong entry. The 7-pip difference between random entry and level-based entry determined whether you won or lost. According to recent gold market analysis, timing entries around key levels during volatile periods significantly outperforms arbitrary momentum entries.
Ignoring multi-timeframe alignment creates losing trades even with good entries. Your 5m chart shows a perfect setup at 2,042 with a bullish engulfing candle at VWAP. You enter long. But H1 is in a strong downtrend, printing lower highs and lower lows. Your 5m setup is a minor pullback within a larger bearish move. Price bounces 10 pips, then collapses 50. The setup wasn't wrong. The context was. You traded a counter-trend entry without realizing it because you didn't check timeframes above your entry chart.
Using repainting indicators leads to phantom signals. You're watching the 15m chart, and a BUY indicator appears at 2,050 mid-candle. You enter. The candle closes, and the BUY signal disappears, replaced by a SELL signal. Price drops 20 pips. You just traded a signal that never actually existed in confirmed form. Repainting tools show potential, not confirmation. When you trade for gold with real capital, potential doesn't cut it. You need confirmed, non-repainting signals that remain after the candle closes.
Overleveraging on gold due to small account size destroys traders. You have a $1,000 account, risk 2% ($20), and trade 0.10 lots on XAUUSD. A 20-pip stop equals $20 risk. That's fine. But you're frustrated by slow progress, so you increase to 0.30 lots to grow faster. Now a 20-pip stop equals $60 risk, or 6% of your account. One losing trade, and you're in drawdown mode. Gold's volatility will stop you out eventually. Overleveraging turns a good system into a losing account through poor risk management.
Chasing trades after missing the entry is another killer. You identified 2,042 as your entry level, but you were away from the screen. Price touched 2,042, bounced, and now it's at 2,051. You enter at 2,051 because you don't want to miss the move. Your planned stop was 2,038 (below the entry level). But entering at 2,051 means your stop is now 13 pips away instead of 4 pips. Your risk just tripled for the same trade. Or you keep the 4-pip stop at 2,047, which is nowhere near structure, and get stopped on normal volatility. Either way, chasing breaks your plan. If you miss the entry, you wait for the next one.
Adapting Gold Strategies to Changing Market Conditions in 2026
Gold's behavior shifts based on macroeconomic factors: interest rates, inflation data, geopolitical tension, and dollar strength. In 2026, central bank policies continue to influence gold volatility. When the Federal Reserve signals rate cuts, gold typically rallies as the dollar weakens and opportunity cost of holding non-yielding gold decreases. When rates rise or hold steady, gold faces pressure. Your trading system doesn't predict these macro moves. It reacts to price action shaped by them.
During high-impact news events (FOMC announcements, CPI releases, geopolitical escalations), gold can move 100+ pips in seconds. If you're holding a position through these events, your stop loss might not protect you. Slippage occurs when volatility spikes, and your 15-pip stop fills at 25 pips. Avoid holding trades through scheduled high-impact news unless you're specifically trading the event with wider stops. Most systematic traders exit before news and re-enter after price settles into a new range.
Correlation with the dollar index (DXY) matters. Gold and DXY typically move inversely. If DXY is rallying hard, gold faces headwinds. Check DXY direction on the Daily chart before entering gold trades. If your gold analysis says bullish but DXY is breaking to new highs, your gold long is fighting a strong macro current. That doesn't mean the trade is invalid, but it reduces probability. Wait for DXY to pause or reverse, then take your gold long. As discussed in gold price analysis, dollar strength and profit-taking can suppress gold even during geopolitically tense periods.
Range-bound versus trending environments require different tactics. When gold is stuck between 2,040 and 2,060 for three days, you trade the range: sell near 2,060, buy near 2,040. Your directional bias is neutral. When gold breaks above 2,060 with volume and momentum, the environment shifts to trending. Now you're looking for pullback entries in the direction of the breakout, not range fades. The system doesn't change, but your execution does. Range trading requires smaller targets and quicker exits. Trend trading allows wider targets and trailing stops.
Seasonal patterns exist in gold, though they're not predictive. Historically, gold shows strength in January and August, weakness in March and October. These aren't rules, but they're patterns driven by jewelry demand (India, China), central bank purchases, and institutional rebalancing. If it's August 2026 and your system shows bullish alignment on gold, the seasonal tailwind adds marginal confidence. If it's October and your system is neutral, the seasonal headwind suggests waiting for stronger confirmation before entering.
Trading gold systematically means separating trend direction from entry precision and managing both across multiple timeframes with clear rules. When you trade for gold with defined levels, non-repainting signals, and multi-timeframe confirmation, you remove guesswork and build repeatable results. PipTrend unifies these three elements-directional signals, institutional entry levels, and timeframe management-into one system so you're not juggling conflicting tools or interpreting mixed signals. Test the system with the 3-day trial, apply it to your gold trades, and see how structure replaces emotion in your execution.