
You're watching EUR/USD on the 1-hour chart when RSI hits 26. Oversold, right? You buy immediately. Price drops another 80 pips before reversing. You're stopped out, confused, and frustrated because the signal seemed perfect. The RSI gave you direction, but direction isn't entry. That distinction separates traders who struggle from those who extract consistent profits from rsi indicator buy and sell signals. Most traders treat RSI as a standalone trigger when it's actually a component of a decision-making system that requires confirmation, context, and proper timing across multiple elements.
What RSI Actually Tells You About Market Conditions
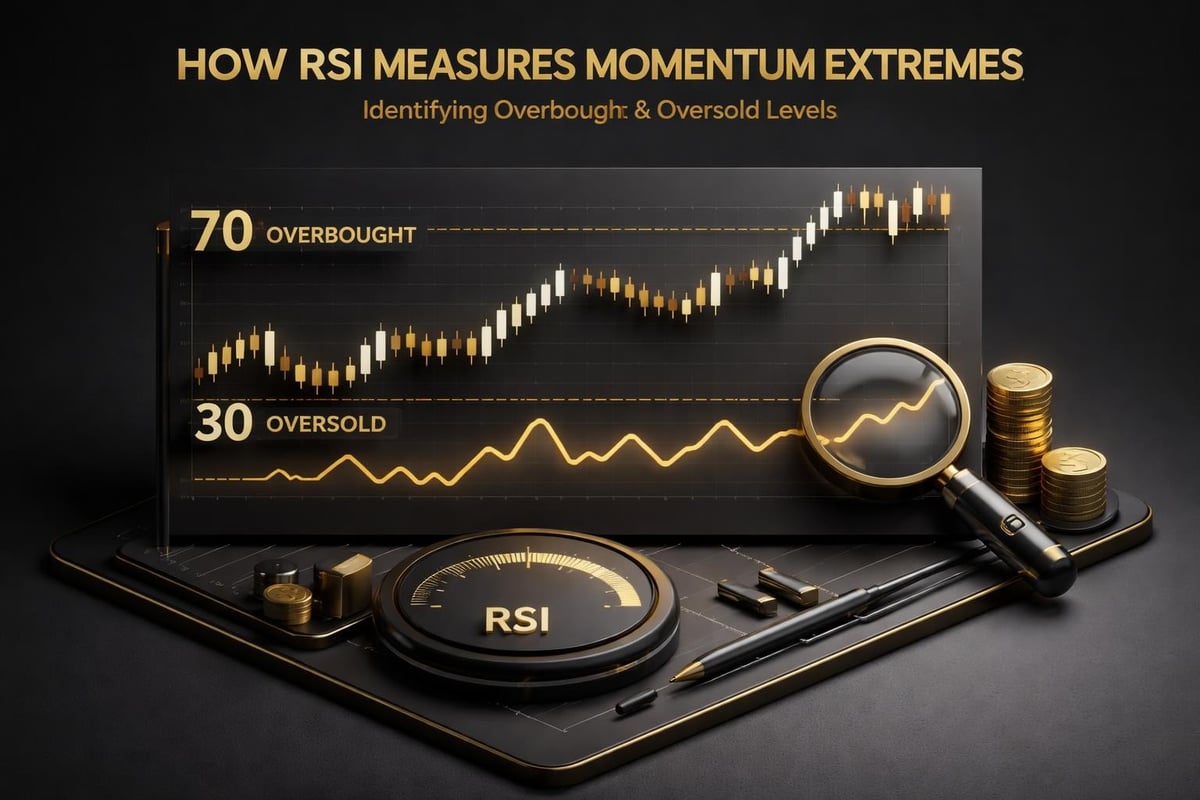
The Relative Strength Index measures momentum on a 0-100 scale. When RSI crosses above 70, the asset is considered overbought. When it drops below 30, it's oversold. Those numbers sound simple until you trade them live and discover that Bitcoin can stay overbought at 85 RSI for three consecutive Daily candles during a bull run, or EUR/JPY can remain oversold at 22 RSI while falling another 200 pips in a trending market.
RSI doesn't tell you when to buy or sell. It tells you when momentum has reached an extreme relative to recent price action. You're reading the speed of movement, not the destination. Fidelity’s guide on RSI explains how the indicator provides context for short-term movements, but context alone doesn't create entries.
The standard 14-period setting works across most timeframes, from 5-minute scalps to Weekly swing positions. Shorter periods like 7 or 9 make RSI more sensitive, generating more signals but also more false triggers. Longer periods like 21 or 25 smooth out noise but lag price action. You need to match your RSI settings to your trading timeframe and style, not just copy default configurations.
Traditional RSI Buy and Sell Signals That Traders Misuse
Standard textbooks tell you to sell when RSI crosses below 70 from above and buy when RSI crosses above 30 from below. You'll find this advice repeated across trading forums, YouTube videos, and indicator descriptions. It's technically accurate and practically incomplete.
Here's what happens when you trade those signals mechanically. You short GBP/USD at RSI 68 on the H1 chart, and price rallies another 120 pips before finally reversing. Or you buy Gold at RSI 32 on the Daily chart, and it consolidates sideways for eight sessions while RSI drifts between 28 and 45, eating into your risk-reward ratio through time decay and opportunity cost.
The signal itself isn't wrong. Your execution is premature because you're treating a momentum warning as an entry trigger. RSI crossing 70 means momentum is extended. It doesn't mean momentum has reversed. Price needs to confirm the reversal through structure breaks, candle patterns, or support/resistance reactions before you risk capital.
Overbought Doesn't Mean Sell Immediately
When RSI pushes above 70, you're witnessing strong buying pressure. That pressure can continue for hours, days, or weeks depending on your timeframe. The 70 level is a zone of caution, not a reversal guarantee. You wait for price to show weakness through lower highs, rejection wicks, or breaks of short-term support levels before considering short positions.
Watch how RSI behaves at these extremes. Does it push to 82 and immediately reverse, or does it hover between 72 and 78 for multiple candles? Sustained extreme readings suggest trend continuation, not reversal. You're looking for RSI to turn back toward 50, confirming that momentum is actually shifting, not just pausing.
Oversold Doesn't Mean Buy the Dip
RSI below 30 signals selling exhaustion in the recent period. Exhaustion and reversal are different states. USD/CAD can hit RSI 24 on the H4 chart and still drop another 150 pips if the underlying trend is strong and no support level holds. Your job is to identify when that selling pressure encounters a genuine obstacle, like a Daily demand zone or previous swing low.
The guide from StockGro on RSI signals covers the basic oversold conditions, but practical application requires you to combine RSI with price structure. You need to see RSI turning upward from oversold levels while price simultaneously holds a key support or forms a bullish hammer candlestick pattern at structure. That confluence turns a momentum extreme into a tradeable setup.
RSI Divergence: The Signal Most Traders Execute Poorly
Divergence occurs when price makes a new high or low but RSI fails to confirm that extreme. Price prints a higher high, RSI prints a lower high, creating bearish divergence. Price makes a lower low, RSI makes a higher low, creating bullish divergence. This pattern suggests weakening momentum and potential reversal.
You spot bearish divergence on EUR/GBP on the Daily chart. Price hit 0.8650, RSI peaked at 73. Price then rallied to 0.8680, but RSI only reached 68. The divergence is clear. You short immediately and watch price continue upward for another 90 pips over three sessions before finally reversing.
Divergence tells you momentum is fading, not that the reversal has started. You still need a trigger, a specific price action event that confirms the turn. That trigger could be a trendline break, a bearish engulfing candle, or a failure to reclaim a key level. TraderFactor’s RSI guide emphasizes divergence as a warning sign, which is exactly how you should use it.
Regular divergence appears at trend exhaustion points and signals potential reversals. Hidden divergence appears during pullbacks in trending markets and signals trend continuation. Regular bearish divergence shows price making higher highs while RSI makes lower highs during an uptrend's final push. Hidden bullish divergence shows price making higher lows while RSI makes lower lows during a pullback in an uptrend, suggesting the uptrend will resume.
 RSI divergence patterns">
Building a Complete System Around RSI Indicator Buy and Sell Signals
RSI works when you embed it in a structured process. You define trend direction first, identify potential reversal or continuation zones second, wait for RSI to reach extreme levels third, and execute only after price confirms through structure or pattern fourth. Each step filters out low-probability setups and keeps you aligned with higher-timeframe context.
Start on the Daily chart to establish trend direction. If the Daily shows an uptrend with higher highs and higher lows, you're looking for RSI oversold conditions on lower timeframes as buying opportunities. If the Daily shows a downtrend, you're hunting RSI overbought conditions on H4 or H1 as shorting opportunities. This top-down approach prevents you from buying into Daily downtrends just because the 5-minute RSI hit 28.
Drop to your execution timeframe after confirming higher-timeframe direction. If you trade H1 charts, that's where you monitor rsi indicator buy and sell signals in real-time. You're waiting for RSI to hit 30 or below in an uptrend, or 70 or above in a downtrend. But you don't trade the cross itself. You wait for price to react at a level that matters, like a Fibonacci retracement, previous support turned resistance, or a round number psychological level.
Combining RSI With Price Action Structure
You're trading GBP/JPY on the H4 chart within a Daily uptrend. Price pulls back to a previous resistance level that now acts as support at 188.20. RSI drops to 32. You have trend alignment, structural support, and an oversold RSI reading. Now you need the trigger. You wait for a bullish engulfing candle, a pin bar rejection, or a break above the previous H4 high. That trigger confirms the setup. You enter long with a stop below structure and a target at the next resistance zone 120 pips higher, giving you a 1:3 risk-reward ratio.
Without that price action trigger, you're guessing. RSI might bounce from 32 to 40 while price chops sideways for six candles before finally reversing. Or price might break through your support level, proving the pullback is actually a trend reversal. The trigger separates valid setups from RSI readings that lack follow-through.
Multi-Timeframe RSI Confirmation Reduces False Signals
Check RSI across three timeframes before committing capital. If you trade the H1, look at the H4 and Daily RSI as well. When all three timeframes show aligned conditions, your probability improves significantly. An H1 buy signal at RSI 28 carries more weight when H4 RSI sits at 42 and Daily RSI reads 51, all suggesting the broader uptrend remains intact and this is just a short-term pullback.
Conflicting timeframes warn you off trades. If H1 RSI hits 72 signaling overbought conditions but Daily RSI only shows 58, you're likely seeing a pullback within a larger uptrend, not a reversal. Shorting that setup puts you against the dominant trend direction, reducing your edge. The best TradingView indicators incorporate this multi-timeframe logic directly into their design, eliminating the need to manually check three charts for every decision.
Practical RSI Settings for Different Trading Styles
Scalpers on 1-minute and 5-minute charts often adjust RSI to 7 or 9 periods for faster reaction to momentum shifts. This creates more signals, which suits high-frequency trading but also generates more noise. You might see ten RSI oversold crosses in a single session, but only two produce tradeable bounces. Your filter becomes tighter, requiring stronger confirmation from volume, bid-ask spread behavior, or Level 2 data.
Day traders on 15-minute to H1 charts typically stick with the standard 14-period RSI. This balances sensitivity and reliability across typical intraday moves. You capture meaningful momentum extremes without drowning in false signals. Your average trade holds for two to eight hours, and RSI at these settings aligns well with that duration.
Swing traders on H4, Daily, and Weekly charts sometimes extend RSI to 21 or 25 periods to filter short-term noise. The goal is identifying major momentum extremes that coincide with multi-day or multi-week price swings. You're less concerned with intraday volatility and more focused on positioning for moves that last five to twenty sessions. RSI at longer periods helps you ignore daily fluctuations that don't impact your thesis.
| Trading Style | Timeframes | RSI Period | Overbought/Oversold | Average Hold Time |
|---|---|---|---|---|
| Scalping | 1m, 5m | 7-9 | 80/20 | Minutes to 1 hour |
| Day Trading | 15m, H1 | 14 | 70/30 | 2-8 hours |
| Swing Trading | H4, Daily | 14-21 | 70/30 | 1-10 days |
| Position Trading | Daily, Weekly | 21-25 | 70/30 | Weeks to months |
RSI in Ranging Markets vs. Trending Markets
RSI performs differently depending on whether price is ranging or trending. In a defined range, RSI overbought and oversold signals work more reliably because price repeatedly bounces between support and resistance. You buy near the range lows when RSI hits 30 and sell near the range highs when RSI reaches 70, playing the bounce mechanics.
You're trading AUD/USD trapped in a 200-pip range between 0.6400 and 0.6600 on the Daily chart. Each time price approaches 0.6420 with RSI below 32, you enter long targeting 0.6580, securing 150-160 pips. Each time price nears 0.6580 with RSI above 68, you short targeting 0.6440, collecting another 140 pips. The range defines your entries and exits, while RSI confirms the timing of those bounces.
Trending markets require a different application. You ignore RSI overbought signals in strong uptrends and oversold signals in strong downtrends. Instead, you use RSI pullbacks to 40-50 in uptrends as buying opportunities and RSI rallies to 50-60 in downtrends as shorting opportunities. The traditional 70/30 levels lose relevance when momentum persistently pushes one direction.
Identifying When RSI Signals Fail
RSI fails when fundamental drivers overwhelm technical momentum. A central bank announces an unexpected rate hike, and currency pairs gap 300 pips. Your RSI reading becomes irrelevant for the next several sessions while price reprices. News events, earnings releases, and geopolitical shocks create conditions where momentum indicators lag reality.
RSI also fails during breakout scenarios. Price consolidates in a tight range, RSI oscillates between 40 and 60, then price breaks sharply higher on volume. RSI immediately shoots to 85 and stays there for days as the breakout extends. If you short that move just because RSI hit overbought levels, you're fighting a structural shift in supply and demand dynamics.
RSI With Support and Resistance Levels for High-Probability Entries
The strongest rsi indicator buy and sell signals occur when RSI extremes coincide with significant support or resistance levels. You're not trading RSI in isolation. You're trading the confluence of momentum exhaustion and structural obstacles where price has previously reacted.
You're watching USD/CHF on the H8 chart. Price approaches a Daily demand zone at 0.8750 where it bounced strongly three weeks prior. As price enters that zone, H8 RSI drops to 27. You have oversold momentum meeting proven support. You wait for a bullish candle close above 0.8760, confirming the zone is holding, then enter long with a stop at 0.8720 and a target at 0.8850, offering a 1:3 risk-reward setup.
Compare that to an RSI oversold reading at 29 in open space with no nearby support. Price has no obvious reason to reverse at that location. You might get a small bounce driven purely by short-term profit-taking, but there's no structural foundation supporting a sustained move. Those setups fail more often, produce smaller winners, and trap you in consolidations.
Resistance works the same way for short setups. RSI hits 73 on the H4 chart as EUR/USD approaches a Weekly supply zone at 1.1200 where sellers previously overwhelmed buyers. That's your confluence. You watch for a bearish rejection candle, then short with a stop above the zone and a target at the next support 140 pips lower.
Managing Trades Using RSI Beyond the Entry Signal
Once you're in a trade, RSI helps you manage the position through monitoring momentum shifts. If you entered long at RSI 32 during a pullback, you watch for RSI to climb back above 50, confirming that bullish momentum is resuming. As price approaches your target, you monitor whether RSI reaches overbought levels, suggesting exhaustion and validating your exit plan.
Partial profit-taking works well with RSI guidance. You're long EUR/CAD from 1.4620 with RSI at entry showing 29. Price rallies to 1.4720, and RSI hits 68. You close half your position, locking in 100 pips on that portion. You move your stop to breakeven on the remainder and let it run toward your full target at 1.4780. If RSI pushes above 72 and starts turning down before hitting your target, that's your signal to exit the rest of the trade.
Trailing stops become more effective when tied to RSI momentum. Instead of using a fixed pip trail, you tighten your stop when RSI begins diverging from price or when RSI crosses back below 50 after reaching extreme levels. This approach captures extended moves while protecting profits when momentum genuinely shifts.
The Direction vs. Entry Problem That Costs Traders Money
Here's the core issue: RSI tells you momentum direction and extremes. It doesn't tell you the precise entry point where risk-reward is optimal. You know EUR/USD is oversold at RSI 26, but where exactly do you buy? At current price? After a 20-pip bounce? At a specific support level still 30 pips lower?
Free tools and basic indicators show you direction but leave entry timing to your discretion. That discretion introduces inconsistency. You enter early sometimes, late other times, and occasionally not at all because you second-guess the setup. Your results vary not because your strategy is wrong but because you're executing it differently each time.
Systematic traders solve this by separating direction decisions from entry decisions. Direction comes from higher timeframe trend analysis and momentum readings like RSI. Entry comes from specific price action triggers at predetermined levels. Exit comes from multi-timeframe confirmation that momentum is shifting or targets are reached. Three separate decisions, three separate tools or criteria, one repeatable process. This is particularly important for prop firm traders facing strict drawdown limits where consistency matters more than hitting occasional home runs.
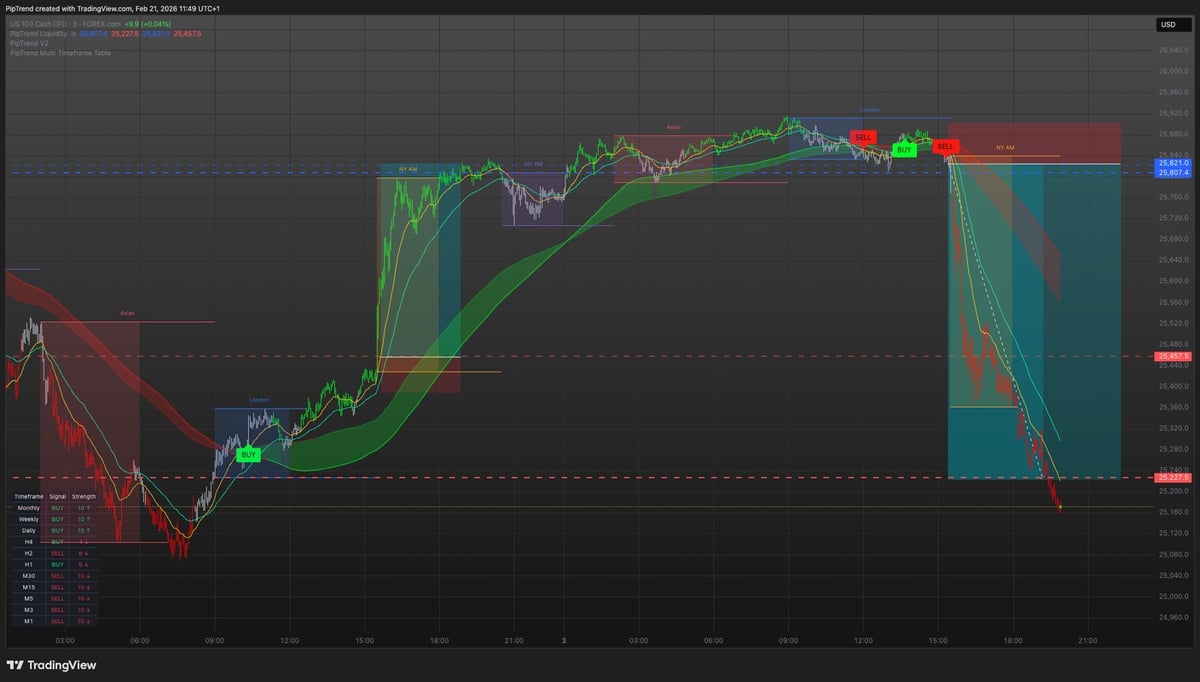
When you struggle with this separation, you need a system that handles all three components with clear, non-repainting signals. PipTrend Trading Indicator System addresses exactly this challenge by showing trend direction through Core BUY/SELL signals, pinpointing entries at institutional liquidity levels like VWAP and supply/demand zones, and managing trades through a 12-timeframe confirmation table that removes guesswork from each decision.
RSI Across Different Asset Classes and Pairs
The mechanics of rsi indicator buy and sell signals remain consistent across Forex, Crypto, Indices, and Stocks, but execution context changes with each asset's characteristics. Forex pairs like EUR/USD and GBP/JPY typically show cleaner RSI patterns during liquid sessions (London and New York overlap) and messier signals during Asian hours when volume thins. You adjust your confirmation requirements based on session liquidity.
Cryptocurrency markets trade 24/7 with volatile momentum swings. Bitcoin can move from RSI 30 to RSI 75 in four H1 candles, creating whipsaw risks if you trade RSI mechanically. You need wider confirmation zones and stronger structure breaks before committing to crypto setups. An RSI reading of 32 in BTC/USD demands more supporting evidence than the same reading in USD/JPY.
Indices like S&P 500 and NASDAQ tend to trend strongly during bull markets, making traditional RSI overbought signals less reliable. You adapt by focusing on RSI pullbacks to 40-50 zones during uptrends rather than waiting for oversold extremes that rarely appear. Individual stocks show more variation depending on sector, volatility, and market cap, requiring you to backtest RSI effectiveness on specific tickers before live trading.
Common RSI Mistakes That Keep Your Account Flat
Trading every oversold and overbought cross without confirmation drains your account through death by a thousand cuts. Each trade risks 1-2% of capital. You take ten RSI signals, six fail immediately, two break even, and two winners barely offset the losers. Your account stays flat or bleeds slowly while you execute constantly, accumulating spread costs and emotional fatigue.
Ignoring higher timeframe context leads to counter-trend trades with low probability. You buy the H1 oversold bounce in a Daily downtrend, capturing 40 pips before price resumes falling and stops you out. You repeat this pattern because the H1 setup looked perfect in isolation, never checking whether you're swimming against the current.
Using RSI as a standalone indicator without price structure, volume confirmation, or risk management turns it into a coin flip. You're reacting to numbers on a screen without understanding what those numbers mean in the context of real supply and demand dynamics. Understanding signals in trading requires you to build a complete framework where each component supports the others.
Real Numbers: RSI Trade Examples With Risk-Reward Metrics
You're trading USD/JPY on the H4 chart within a Daily uptrend. Price pulls back to 148.50, a previous resistance level now acting as support. H4 RSI hits 31, Daily RSI sits at 53, confirming the broader uptrend remains intact. You wait for a bullish pin bar on the H4, then enter long at 148.65. Stop loss goes at 148.20, 45 pips below. Target sits at 149.80, 115 pips above. Risk-reward ratio: 1:2.55. Price reaches your target in 18 hours, delivering 115 pips on a setup with clear structure, RSI confirmation, and defined risk.
Next example: EUR/GBP on the Daily chart shows bearish divergence. Price hit 0.8680, RSI peaked at 69. Price then rallied to 0.8710, but RSI only reached 64. Daily also shows a supply zone between 0.8700-0.8720. You wait for a Daily bearish engulfing candle at 0.8708, then short at 0.8700 with a stop at 0.8745 (45 pips) and a target at 0.8550 (150 pips). Risk-reward: 1:3.33. Over the next eight sessions, price drops to 0.8565, securing 135 pips before you trail your stop and get taken out, still banking a strong winner built on RSI divergence, structure, and confirmed price action.
These setups work because they combine multiple elements. RSI provides momentum context, structure provides logical entry and stop placement, price action provides the trigger, and risk management ensures survivability when the setup fails.
Adapting RSI for Prop Firm Challenge Requirements
Prop firm challenges demand consistency, tight drawdown management, and repeatable processes. You can't rely on home run trades or aggressive position sizing. You need steady, systematic execution where each trade follows identical rules. RSI fits this requirement when you treat it as a confirmation tool within a broader system, not as a magic signal generator.
Your Daily drawdown limit might be 5% with a maximum loss of 10% overall. That forces position sizing down to 0.5-1% risk per trade. You can't afford to take ten RSI signals hoping three work out. You need to filter aggressively, taking only setups where RSI, trend, structure, and price action align perfectly. That might mean five trades per week instead of five per day, but those five carry higher probability.
Time pressure compounds the challenge. You need to hit profit targets within a specific period, creating temptation to force trades. RSI helps by showing you when momentum is genuinely extreme versus when you're manufacturing setups because you feel pressure to trade. If RSI on your execution timeframe sits at 52 with no divergence and no structural confluence, there's no trade. You wait. Discipline becomes your edge, and RSI provides objective data to support that discipline against emotional impulses.
RSI indicator buy and sell signals give you a systematic way to measure momentum extremes, but only when you separate direction from entry and combine RSI readings with price structure, multi-timeframe analysis, and confirmed triggers. If you're tired of cluttered charts, conflicting signals, and inconsistent execution across different timeframes and asset classes, PipTrend provides a unified system that handles direction, entry, and management decisions through non-repainting signals, institutional liquidity levels, and 12-timeframe confirmation-turning RSI concepts into a repeatable trading process with transparent rules you can apply to every trade.