
Navigating the fast-changing world of trading in 2026 means understanding how volatility shapes every decision. The average true range indicator stands out as an essential tool for traders aiming to measure market movement with precision.
This guide unpacks the average true range indicator, offering clear strategies for risk management, entry and exit timing, and building adaptable trading plans. You will discover the fundamentals, calculation methods, advanced approaches, and practical tips to help you thrive in the year’s dynamic markets.
Understanding the Average True Range Indicator
Volatility is a constant force in modern trading, and understanding its rhythm is crucial. The average true range indicator stands at the heart of volatility analysis, helping traders across markets to navigate risk and opportunity with precision.
This section will break down what the average true range indicator is, how it works, and why it matters for anyone seeking clarity in unpredictable market conditions.
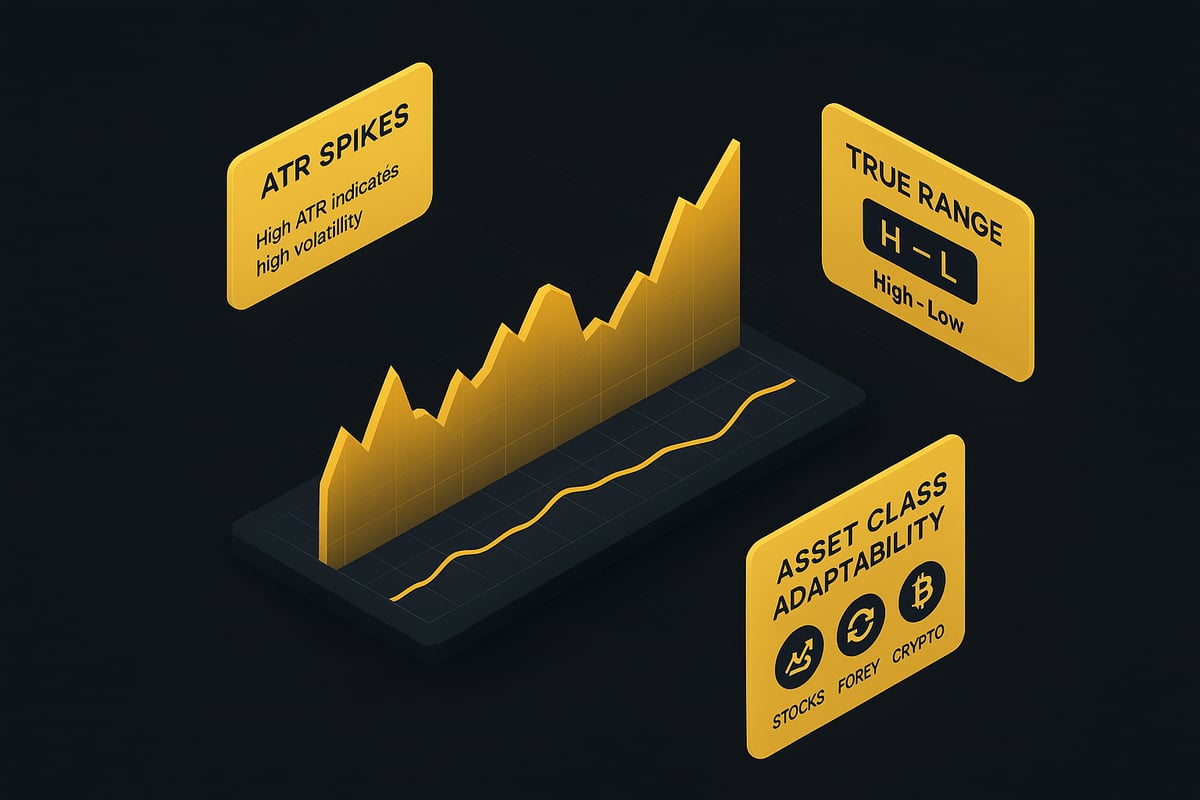
What is the Average True Range?
The average true range indicator was introduced by J. Welles Wilder Jr. in 1978 as part of his groundbreaking work, “New Concepts in Technical Trading Systems.” Designed to measure market volatility rather than price direction, the average true range indicator provides a single, adaptable value that reflects the degree of price movement—regardless of whether the market is trending up or down.
Unlike standard deviation, which assumes price distribution around a mean, the average true range indicator focuses on actual price ranges, making it more responsive to sudden market shifts and gaps. This adaptability is a key reason why professional traders favor ATR for managing risk, especially in turbulent environments.
ATR’s versatility extends across asset classes. Whether you trade forex, stocks, crypto, or indices, the average true range indicator adjusts to the unique volatility profile of each market. For example, a trending market might show a rising ATR as price swings widen, while a ranging market typically produces lower ATR values.
Industry surveys consistently show that ATR ranks among the top volatility tools for active traders. According to recent data, over 60% of professional traders incorporate ATR into their risk management or trade timing processes.
Common misconceptions about ATR include:
- Believing it predicts price direction (it does not)
- Assuming it is only useful for stop-loss placement
- Thinking ATR values are interchangeable across timeframes or assets
For a comprehensive overview of the average true range indicator’s history, purpose, and practical use, see the Average True Range Indicator Guide.
How is ATR Calculated?
Calculating the average true range indicator starts with understanding True Range (TR). True Range is the greatest of:
- The current high minus the current low
- The absolute value of the current high minus the previous close
- The absolute value of the current low minus the previous close
To find ATR, you average the True Range values over a set number of periods (commonly 14). For example, on a daily chart, you would sum the last 14 True Range values and divide by 14. Shorter periods (like 7) make ATR more sensitive, while longer periods (like 21) smooth out short-term spikes.
Here’s a sample calculation in pseudo-code:
TR = max(
 High - Low,
 abs(High - Previous Close),
 abs(Low - Previous Close)
)
ATR = sum(last N TR values) / N
The average true range indicator changes based on the timeframe you select. On a 1-hour chart, ATR reflects volatility within each hour, while a daily chart gives a broader view. This flexibility lets traders fine-tune their approach to suit their strategy.
Most trading platforms, including TradingView and MetaTrader, offer ATR as a standard indicator. Simply add it to your chart, set your preferred period, and observe how the ATR line rises during volatile swings and contracts during calm periods.
By mastering the calculation and application of the average true range indicator, traders can better assess risk and make more confident decisions in any market environment.
Why ATR Matters in 2026’s Trading Landscape
Navigating 2026’s markets requires traders to adapt quickly to volatility. The average true range indicator has become essential for making sense of market swings and safeguarding trades in an unpredictable environment. Why is ATR more vital than ever this year?
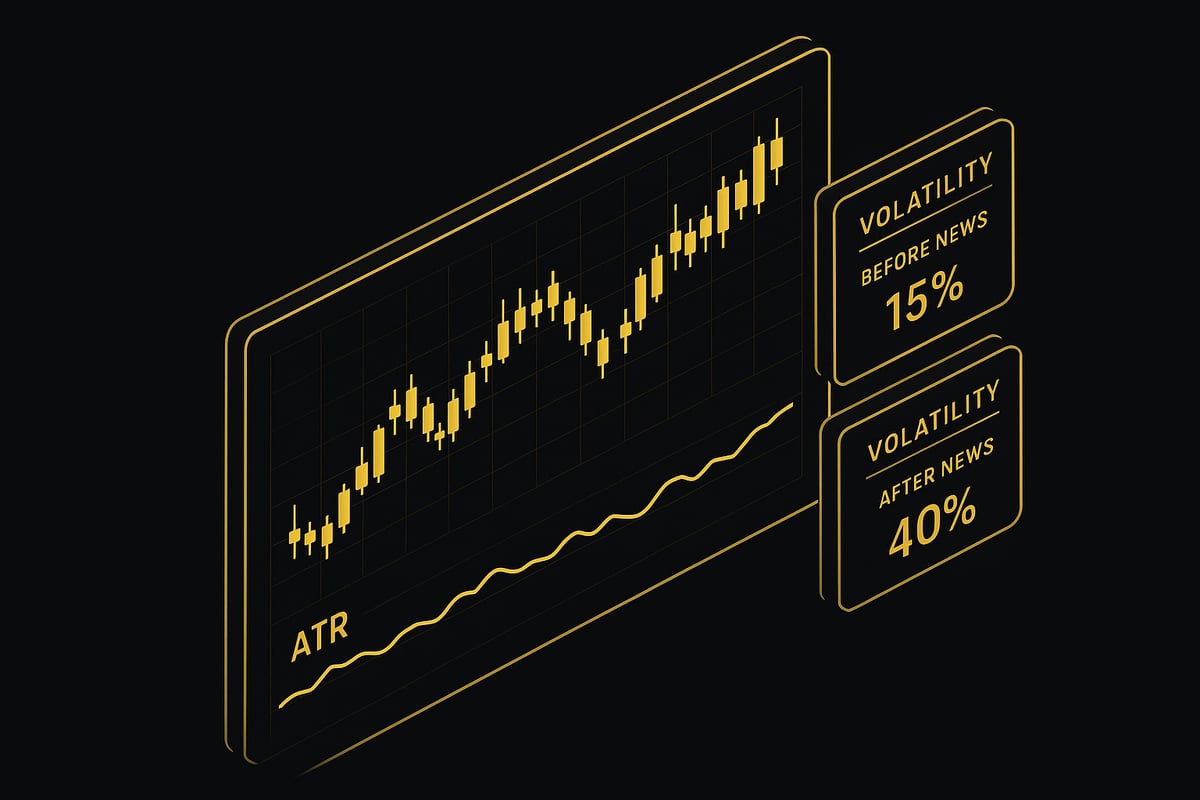
The Evolving Volatility of Modern Markets
Modern trading in 2026 is shaped by relentless volatility. Several factors are driving these shifts:
- Algorithmic trading systems execute massive volumes of trades in milliseconds, amplifying price swings.
- Global news, from central bank rate changes to geopolitical tensions, instantly ripples through markets.
- Macroeconomic uncertainty and the widespread adoption of digital assets have added layers of unpredictability.
Recent statistics highlight this turbulence. The S&P 500’s 30-day average true range indicator reached multi-year highs during surprise rate hikes, while major forex pairs like EUR/USD experienced ATR readings double their historical averages in response to political headlines. In crypto, Bitcoin’s ATR spiked after regulatory announcements, warning traders of heightened risk.
| 2026 Volatility Drivers | Impact on Markets |
|---|---|
| Algorithmic Trading | Increased frequency of spikes |
| Crypto Adoption | Larger, faster price moves |
| Global News Events | Sudden volatility surges |
| Economic Uncertainty | Sustained higher ATR levels |
The average true range indicator excels at capturing these shifts regardless of asset class. Unlike directional tools, ATR measures pure volatility, making it a reliable barometer when conditions are changing fast. During the 2026 tech earnings season, for example, traders noticed ATR surging days before major price gaps, providing early signals to adjust position sizes and stop losses.
Some traders mistakenly believe ATR predicts price direction, but its true value lies in highlighting the magnitude of potential moves. By focusing on volatility rather than trend, the average true range indicator helps traders prepare for both opportunities and risks.
ATR vs. Other Volatility Indicators
How does the average true range indicator stack up against other popular volatility tools? Let’s compare:
| Indicator | Measures | Complexity | Best Use Case | Limitations |
|---|---|---|---|---|
| ATR | Volatility | Simple | Position sizing, risk | No direction, lagging |
| Bollinger Bands | Volatility + | Moderate | Breakout detection | Can be subjective |
| price levels | ||||
| Standard Deviation | Volatility | Moderate | Statistical analysis | Less visual, less dynamic |
| VIX | Implied | Advanced | Market sentiment | Only for S&P 500 |
The average true range indicator remains favored for its simplicity and adaptability. Unlike Bollinger Bands, which combine volatility and price, ATR offers a straightforward view of volatility alone. This clarity is invaluable in fast-moving markets, where overcomplicated indicators may lag or create confusion.
For a more detailed breakdown, see this Volatility indicators comparison, which highlights the unique advantages and applications of each tool.
Even as AI-driven analytics and new indicators emerge, ATR’s transparent calculation and cross-asset utility ensure its continued relevance. In 2026, traders trust the average true range indicator to respond quickly to volatility spikes, manage risk, and avoid the pitfalls of outdated methods.
Step-by-Step: Using ATR in Your Trading Strategy
Mastering the average true range indicator involves a structured approach. This step-by-step guide will help you set up, interpret, and apply the ATR for effective trading decisions in 2026’s fast-moving markets.
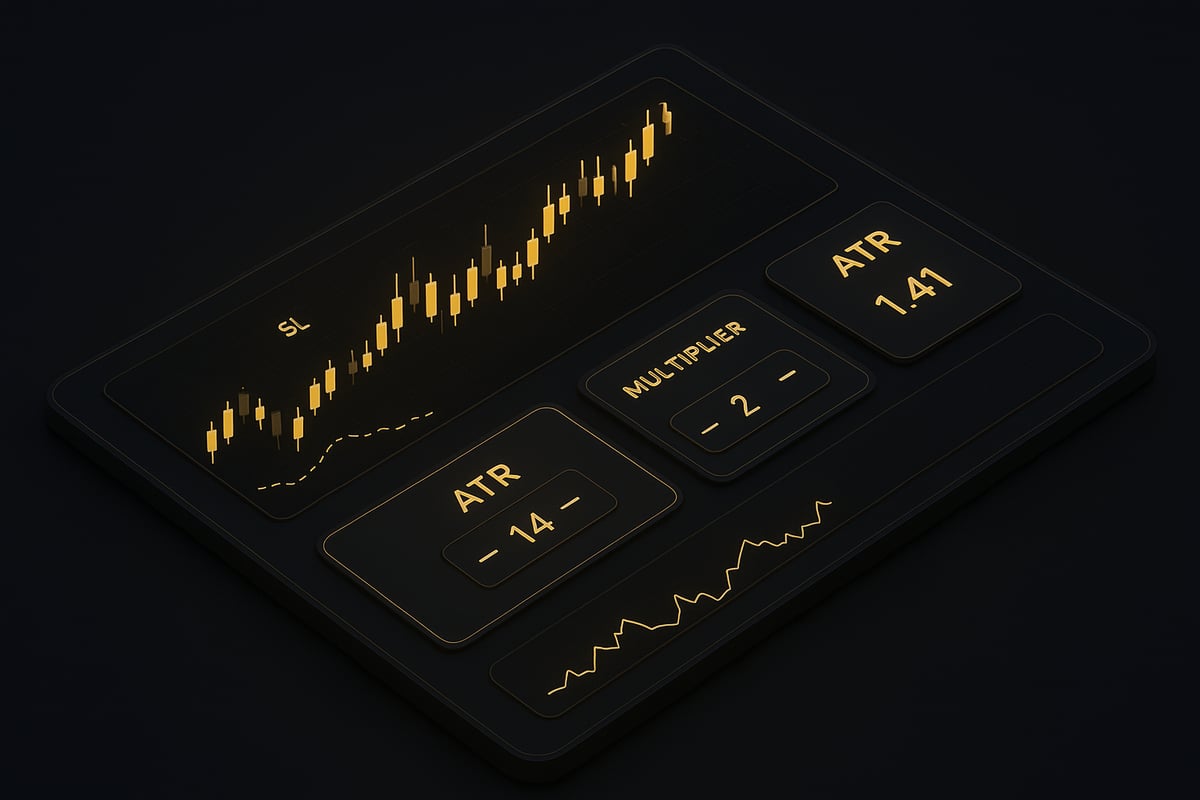
Step 1: Setting Up the ATR Indicator
The first step to harnessing the average true range indicator is adding it to your preferred trading platform. Most platforms, such as TradingView and MetaTrader, include ATR in their default indicator libraries. Simply search for “ATR” in the indicators menu and apply it to your chart.
Choosing the right period is crucial. The classic setting is 14 periods, but day traders may opt for shorter periods like 7, while swing traders might prefer 21 or more. Adjusting the display for color and line thickness can make ATR readings easier to interpret, especially during periods of high market activity.
For a detailed walkthrough of ATR setup and calculation, you can refer to this ATR Calculation and Application guide, which covers practical aspects of the average true range indicator.
Once configured, ensure your chart’s timeframe aligns with your trading style. ATR on a daily chart suits swing trades, while lower timeframes serve scalpers and intraday traders.
Step 2: Interpreting ATR Values
Understanding ATR values is essential for leveraging the average true range indicator. High ATR readings signal increased market volatility, which often precedes significant price moves. Conversely, low ATR values indicate quieter markets, where price action is less explosive.
For example, a sudden spike in ATR on a forex pair could warn of an impending breakout, while a prolonged low reading might suggest consolidation. Monitoring these shifts helps traders anticipate changes in risk and opportunity.
It is important to remember that the average true range indicator measures volatility, not trend direction. Use ATR in conjunction with price action or trend indicators for context. This approach reduces the risk of misinterpreting volatility spikes as buy or sell signals.
Step 3: Position Sizing with ATR
Position sizing is one of the most powerful applications of the average true range indicator. By using ATR to set dynamic stop-loss and take-profit levels, you can adjust your risk exposure according to market conditions.
A popular method is to set your stop-loss distance as a multiple of the current ATR value, for example, Stop-Loss = Entry Price – (1.5 × ATR). This calculation adapts to volatility, helping you avoid premature stop-outs in choppy markets.
Here’s a sample calculation:
# Example: Forex stop-loss using ATR
Entry = 1.2000
ATR (14) = 0.0020
Stop_Loss = Entry - (1.5 * ATR)
Stop_Loss = 1.2000 - (1.5 * 0.0020) = 1.1970
Using the average true range indicator in this way supports consistent risk management across assets and market environments.
Step 4: Entry and Exit Timing
The average true range indicator is valuable for refining trade entries and exits. During periods of low ATR, it is often wise to avoid entering new trades, as breakouts are less likely. When ATR rises sharply, it can signal an opportune moment to enter or exit, especially if price action confirms the move.
For exits, many traders close positions when ATR contracts after a surge, signaling the end of a volatile phase. In a trending stock, for example, a trailing stop set at two times ATR below the high can lock in profits as volatility wanes.
Integrating ATR into your timing rules helps filter out low-probability setups and improves overall trade quality.
Step 5: Backtesting and Optimization
Backtesting is essential to validate the effectiveness of any average true range indicator strategy. Use historical data to test different ATR periods and multipliers for your stop-loss and take-profit rules. Platforms like TradingView offer built-in backtesting tools, while more advanced traders may use Python or R for custom analysis.
Regular optimization is vital as market volatility evolves. Adjust ATR settings based on recent market conditions to maintain effectiveness. Document your results and refine your approach over time for consistent improvement.
By following these steps, traders can fully integrate the average true range indicator into their strategies, adapting to the volatility of 2026’s markets.
Advanced ATR Strategies for 2026 Success
Mastering the average true range indicator unlocks a powerful edge for traders navigating 2026's volatile markets. Advanced ATR strategies help you pinpoint breakouts, optimize stop placement, confirm trends, and even spot mean reversion opportunities. Let’s explore how you can elevate your trading approach using these sophisticated techniques.
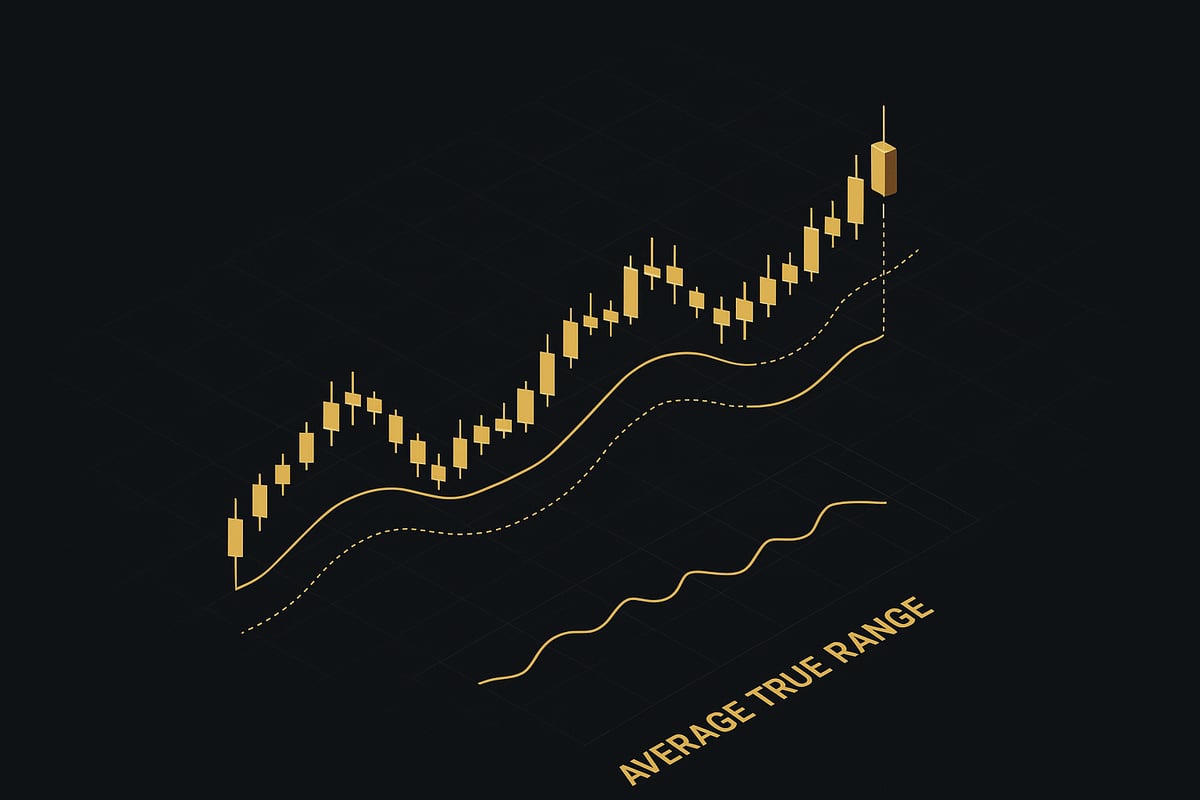
ATR Breakout Strategies
The average true range indicator excels at identifying breakout scenarios in all market environments. When ATR values surge, they signal an expansion in volatility, often preceding strong directional moves.
To implement an ATR breakout strategy:
- Monitor ATR spikes above recent averages.
- Confirm the move with price action, such as a close beyond key support or resistance.
- Set entries after confirmation, using ATR to size stops.
For example, in crypto markets, a sudden ATR increase often foreshadows explosive price action. If Bitcoin trades sideways and the average true range indicator sharply rises, traders prepare for a breakout. By combining ATR readings with candlestick patterns or volume surges, you gain high-probability entry signals.
Be mindful not to misinterpret every ATR jump as a breakout. Filter signals by contextualizing ATR with price structure. Many traders mistakenly chase false moves when ATR is elevated due to news spikes or erratic sessions.
Employing the average true range indicator in breakout strategies helps you act early on volatility shifts, improving your timing and risk management.
ATR Trailing Stop Techniques
Dynamic trailing stops based on the average true range indicator offer superior protection compared to fixed-point or percentage stops. Rather than a static value, your stop-loss adapts to market volatility, giving trades room to breathe while safeguarding gains.
To set an ATR trailing stop:
- Calculate the stop distance as a multiple of the current ATR (commonly 1.5x or 2x).
- Adjust the stop as the trade progresses, maintaining the chosen ATR multiple behind the highest high or lowest low.
This technique reduces the chance of premature exits during normal price swings. Backtests show that ATR-based trailing stops can outperform fixed methods, especially in fast-moving environments. According to Using ATR in Volatile Markets, ATR stops help traders stay in winning trades longer and adapt to sudden volatility changes.
For instance, in forex, a trailing stop set at 2x the average true range indicator value allows you to capture larger moves while minimizing drawdown. This adaptive approach is crucial in 2026, where frequent volatility spikes can otherwise trigger unnecessary stop-outs.
Leverage the average true range indicator to continually optimize your trailing stops as market conditions fluctuate.
ATR in Trend-Following Systems
Trend-following traders rely on the average true range indicator to confirm trend strength and avoid choppy, range-bound markets. ATR filters out low-volatility noise, ensuring you only act when strong momentum is present.
Integrate ATR with moving averages or trendlines for robust setups:
- Enter trades only when the ATR is above its moving average, signaling active markets.
- Use ATR thresholds to filter sideways periods and focus on sustained trends.
For example, in equity indices, when the average true range indicator climbs alongside a moving average crossover, it suggests a powerful trend is underway. This combination helps you avoid false starts and whipsaws.
A practical workflow may involve waiting for both a bullish moving average signal and an uptick in ATR before entering. This dual confirmation increases win rates and reduces exposure to low-probability trades.
By making the average true range indicator a central part of your trend-following system, you enhance both selectivity and timing, crucial for consistent success in 2026.
ATR for Mean Reversion Trades
While the average true range indicator is popular for trend and breakout strategies, it also shines in mean reversion trading. Extreme ATR readings often indicate overextended moves ripe for reversal.
To spot mean reversion opportunities:
- Look for ATR values significantly above historical norms.
- Combine ATR with oscillators like RSI to identify overbought or oversold conditions.
A typical case involves a stock with soaring ATR and RSI above 80. This signals exhaustion, and traders can plan for a countertrend entry as volatility begins to revert.
In high-volatility environments, the average true range indicator helps you quantify market extremes and avoid entering too early. By waiting for both ATR and momentum indicators to flash reversal signals, you improve entry precision.
Mean reversion strategies built on the average true range indicator enable you to capitalize on market corrections and volatility contractions, adding another dimension to your trading toolkit.
Integrating ATR with Other Indicators and Tools
Understanding how to combine the average true range indicator with other technical tools is vital for traders aiming to gain a decisive edge in 2026’s volatile markets. Integrating ATR with complementary indicators enhances analysis, filters false signals, and adapts strategies to evolving conditions. To maximize the potential of the average true range indicator, traders should consider its synergy with trend, momentum, and volume-based tools. For foundational context on ATR’s role among technical tools, explore this essential technical indicators guide.
ATR + Moving Averages
Pairing the average true range indicator with moving averages provides a robust framework for confirming trends and filtering out market noise. Moving averages identify trend direction while the average true range indicator quantifies volatility, allowing traders to assess the strength and sustainability of price movements.
Consider this example strategy:
- Use a 14-period ATR and a 50-period exponential moving average (EMA).
- Enter trades only when price is above the EMA and ATR is rising, signaling strong, volatile trends.
- Filter out trades during flat ATR periods, which often indicate choppy, sideways conditions.
A simple code logic for integration:
if price > EMA50 and ATR14 > ATR14_prev:
 # Consider long entry
This approach reduces whipsaws and helps traders avoid weak trends. The average true range indicator keeps traders alert to volatility shifts that may precede breakouts or reversals.
ATR + RSI/Stochastic
Combining the average true range indicator with momentum oscillators like RSI or Stochastic enhances entry timing and filters false signals. While oscillators pinpoint overbought or oversold zones, the average true range indicator confirms whether these signals occur in sufficiently volatile environments.
Practical workflow for forex and crypto:
- Identify RSI readings below 30 (oversold) or above 70 (overbought).
- Confirm that ATR is elevated compared to recent periods, signaling a likely strong move.
- Only execute trades when both criteria align, reducing the risk of false breakouts.
List of benefits:
- Improved accuracy in trend and reversal entries.
- Fewer premature trades during quiet markets.
- Enhanced confidence in high-volatility setups.
This synergy allows traders to capitalize on strong, actionable signals with the average true range indicator as a volatility filter.
ATR + Volume Analysis
Volume analysis, when paired with the average true range indicator, gives deeper insight into the conviction behind price moves. A breakout accompanied by a spike in both ATR and volume often signals a genuine trend initiation rather than a false move.
How to use this combination:
- Watch for periods where ATR and volume both surge above recent averages.
- Use these events as confirmation for breakout trades in stocks or indices.
- Filter out signals where ATR rises but volume remains flat, which may indicate a lack of participation.
A quick comparison:
| Scenario | ATR Trend | Volume Trend | Reliability |
|---|---|---|---|
| Both rising | Up | Up | High (Breakout) |
| ATR up, volume flat | Up | Flat | Low (Caution) |
| Both flat | Flat | Flat | Low (Range) |
This dual approach with the average true range indicator helps traders spot high-probability setups and avoid traps.
Multi-Timeframe ATR Analysis
Multi-timeframe analysis elevates the average true range indicator’s power by offering a layered perspective on volatility. Checking ATR across several timeframes—such as daily and hourly—enables traders to align short-term trades with broader volatility trends.
Best practices for workflow:
- Assess ATR on a higher timeframe to gauge overall market volatility.
- Use a lower timeframe ATR to fine-tune entries and exits.
- Only take trades when both timeframes show supportive volatility conditions.
For a deeper exploration of multi-timeframe methods, see this guide on multi-timeframe trading analysis.
Integrating the average true range indicator with these tools creates a comprehensive system for adapting to market shifts. This layered approach is essential for navigating the complexity and speed of 2026’s trading environment.
Practical Tips, Common Mistakes, and Pro Insights
Mastering the average true range indicator in 2026 calls for both technical know-how and adaptability. Below, you will find actionable tips, avoidable pitfalls, and real-world insights to elevate your ATR trading performance.
Best Practices for ATR Application
To maximize the effectiveness of the average true range indicator, regular recalibration is essential. Markets evolve quickly, so adjusting ATR settings to reflect current volatility ensures your readings remain accurate. For instance, during periods of macroeconomic uncertainty or high-frequency trading surges, fine-tuning your ATR period can help you better capture true volatility.
Combine the average true range indicator with price action analysis for added context. ATR alone highlights volatility, but pairing it with candlestick patterns or support and resistance levels refines your entries and exits. This approach helps filter out noise and avoid false signals, especially in choppy markets.
Avoid overtrading by using the average true range indicator to identify low-volatility periods. When ATR readings are subdued, it often signals a lack of momentum, making it prudent to wait for better setups. Research supports this approach. For example, studies such as the Exploring Predictability of Range-Based Volatility Estimators highlight the importance of accurate volatility measurement for robust trading performance.
Best practice checklist:
- Recalibrate ATR settings regularly
- Combine ATR with price action and other indicators
- Avoid trading during low-volatility readings
- Use ATR for dynamic risk management
- Monitor ATR across multiple timeframes
Applying these principles will help you harness the average true range indicator’s full potential in any market environment.
Common Pitfalls to Avoid
Despite its strengths, the average true range indicator is often misunderstood. One common mistake is interpreting ATR as a directional tool. Remember, ATR measures volatility, not whether price will rise or fall. Using ATR to predict trend direction can lead to misguided trades.
Another pitfall is relying solely on the average true range indicator without confirmation from other signals. ATR is most effective when it complements other technical indicators or price action analysis. Overreliance can result in whipsaws, especially in volatile or illiquid markets.
Overfitting ATR settings in backtesting is also a frequent error. Traders may tweak ATR periods to fit historical data perfectly, only to find those settings ineffective in real-time trading. This can undermine the average true range indicator’s value for forward-looking strategies.
Common mistakes:
- Treating ATR as a trend or direction indicator
- Ignoring confirmation from other tools
- Overfitting ATR parameters to past data
- Using fixed ATR settings in ever-changing markets
- Failing to adjust stop-loss levels dynamically
Staying aware of these pitfalls ensures your use of the average true range indicator remains disciplined and effective.
Pro Insights and Case Studies
Top traders consistently credit the average true range indicator for its role in robust risk management. By setting stop-loss and take-profit levels based on ATR multiples, they adapt to changing volatility and protect capital during market shocks.
Interviews with professional traders reveal a preference for dynamic ATR-based stops over fixed-point or percentage methods. Data suggests that ATR-based stops improve risk-adjusted returns by reducing the likelihood of premature exits during volatility spikes. In a recent study, accounts using the average true range indicator for stop placement saw a measurable uplift in performance compared to those using static stops.
Artificial intelligence is reshaping how traders deploy the average true range indicator. AI-powered platforms, as discussed in Integrating AI in trading strategies, can automatically adjust ATR parameters, scan for optimal volatility setups, and deliver real-time alerts. This integration helps traders of all levels align their strategies with evolving market conditions.
Actionable tips from the pros:
- Use ATR for dynamic stop-losses to adapt to market shifts
- Backtest ATR strategies regularly and avoid curve fitting
- Leverage AI tools for automated ATR optimization
- Document trade outcomes to refine your approach
By blending these expert insights with disciplined application, you can unlock the full power of the average true range indicator for consistent results in 2026’s markets.
Now that you’ve explored the ins and outs of the Average True Range indicator and how it can transform your trading approach for 2026, why not take your strategy a step further? With PipTrend, you can combine the power of AI-driven signals and real-time ATR analysis to make more informed decisions and capture opportunities as they happen. Whether you’re navigating forex, crypto, or stocks, PipTrend’s instant alerts and multi-timeframe insights can help you trade with greater confidence and consistency. Ready to see meaningful improvements in your results?
See Your Trading Improve With PipTrend