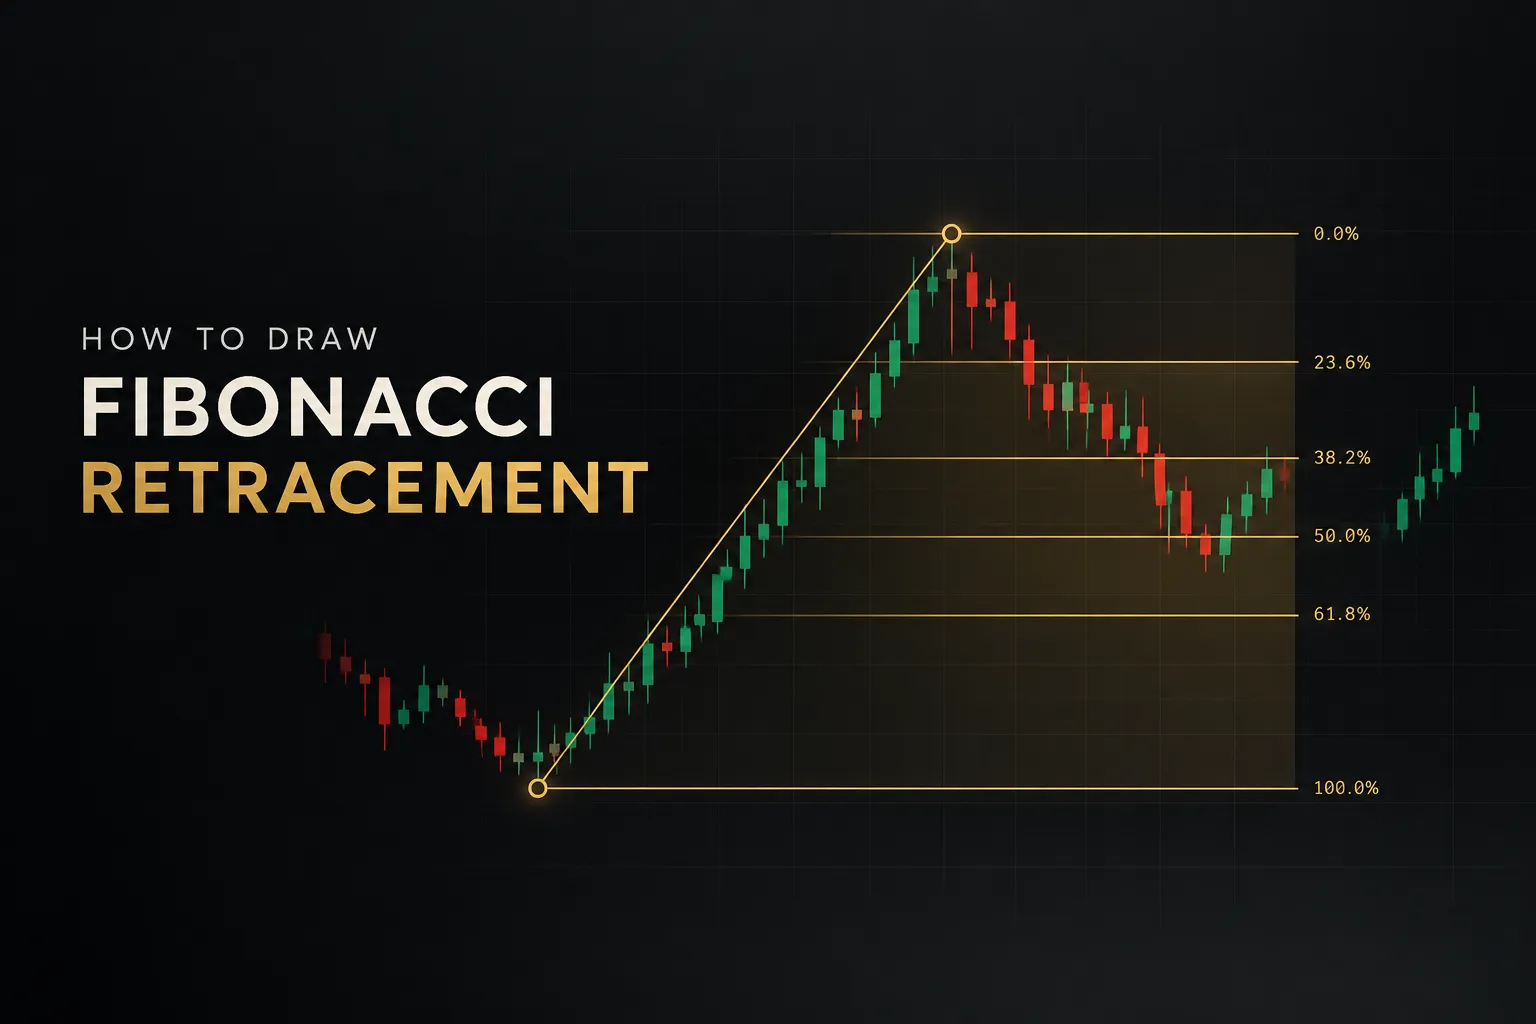
How to Draw Fibonacci Retracement Correctly
Learn the exact anchor points, swing selection, and ratio math behind accurate Fibonacci retracements. Avoid the common drawing mistakes traders make.
Strong setups start with context. Learn to read the higher timeframe first, then narrow down to a precise entry.
Top-down analysis means working from the macro view to the micro: establishing the dominant trend on higher timeframes, then refining toward entries on lower ones. These guides cover multi-timeframe structure, context and confirmation.
See it applied in our guide to the best trading indicators for day trading.
17 articles in Top Down Analysis
Learn the exact anchor points, swing selection, and ratio math behind accurate Fibonacci retracements. Avoid the common drawing mistakes traders make.
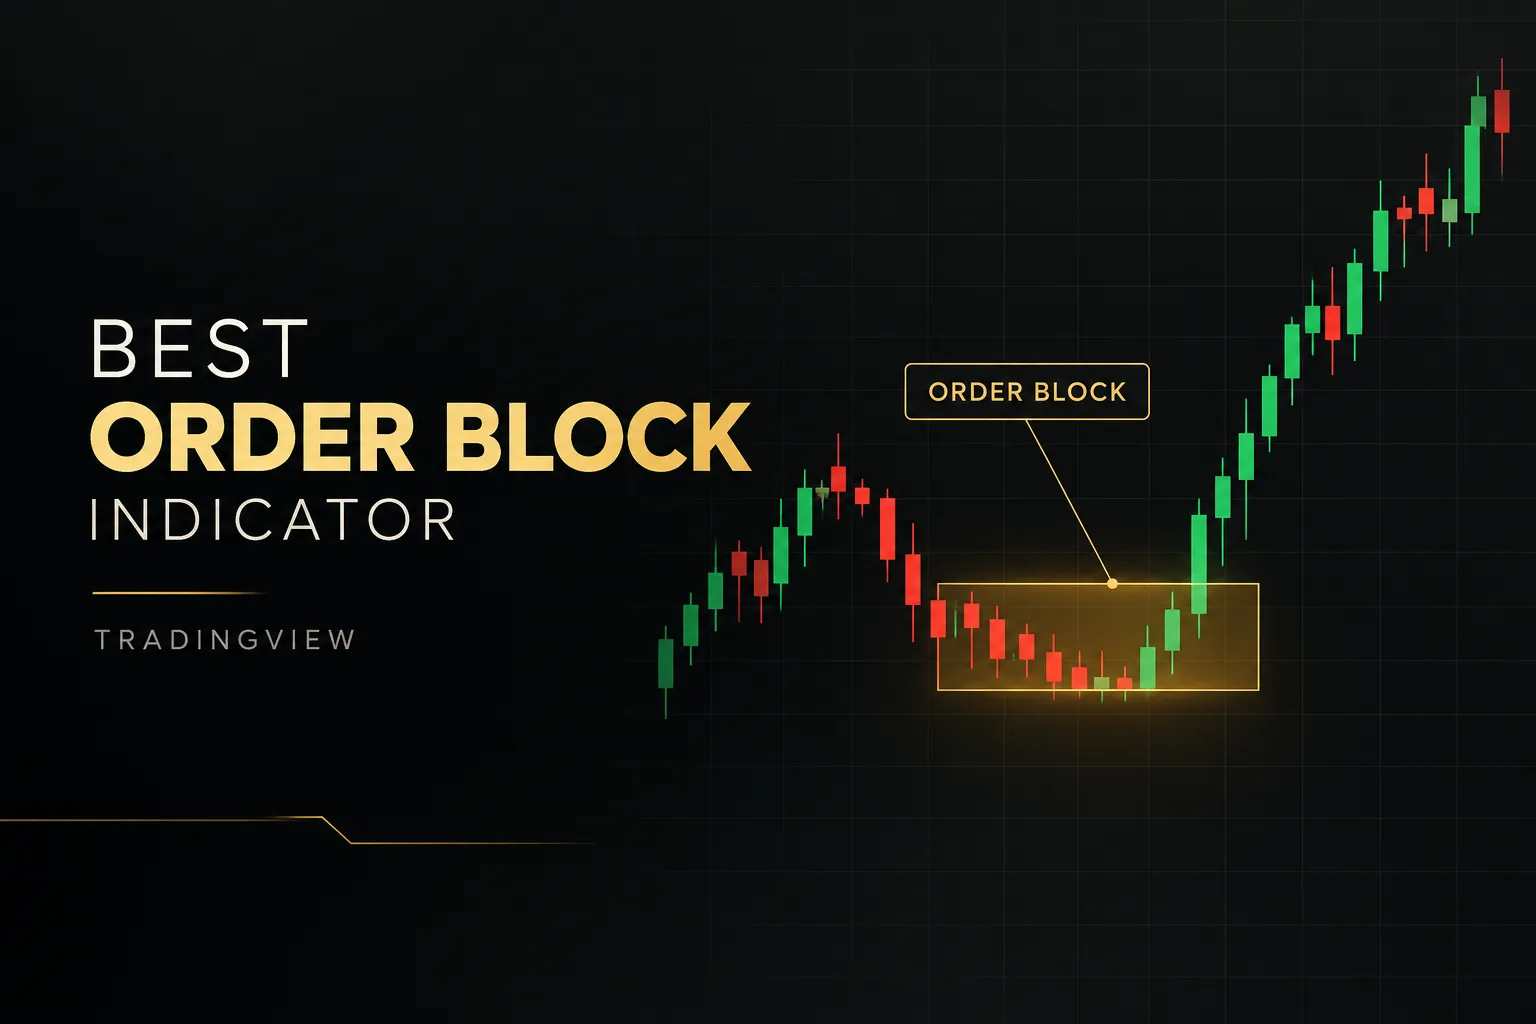
Compare detection logic, repainting risk, and zone lifecycle before picking a tool. A trader's framework, not just a script name.
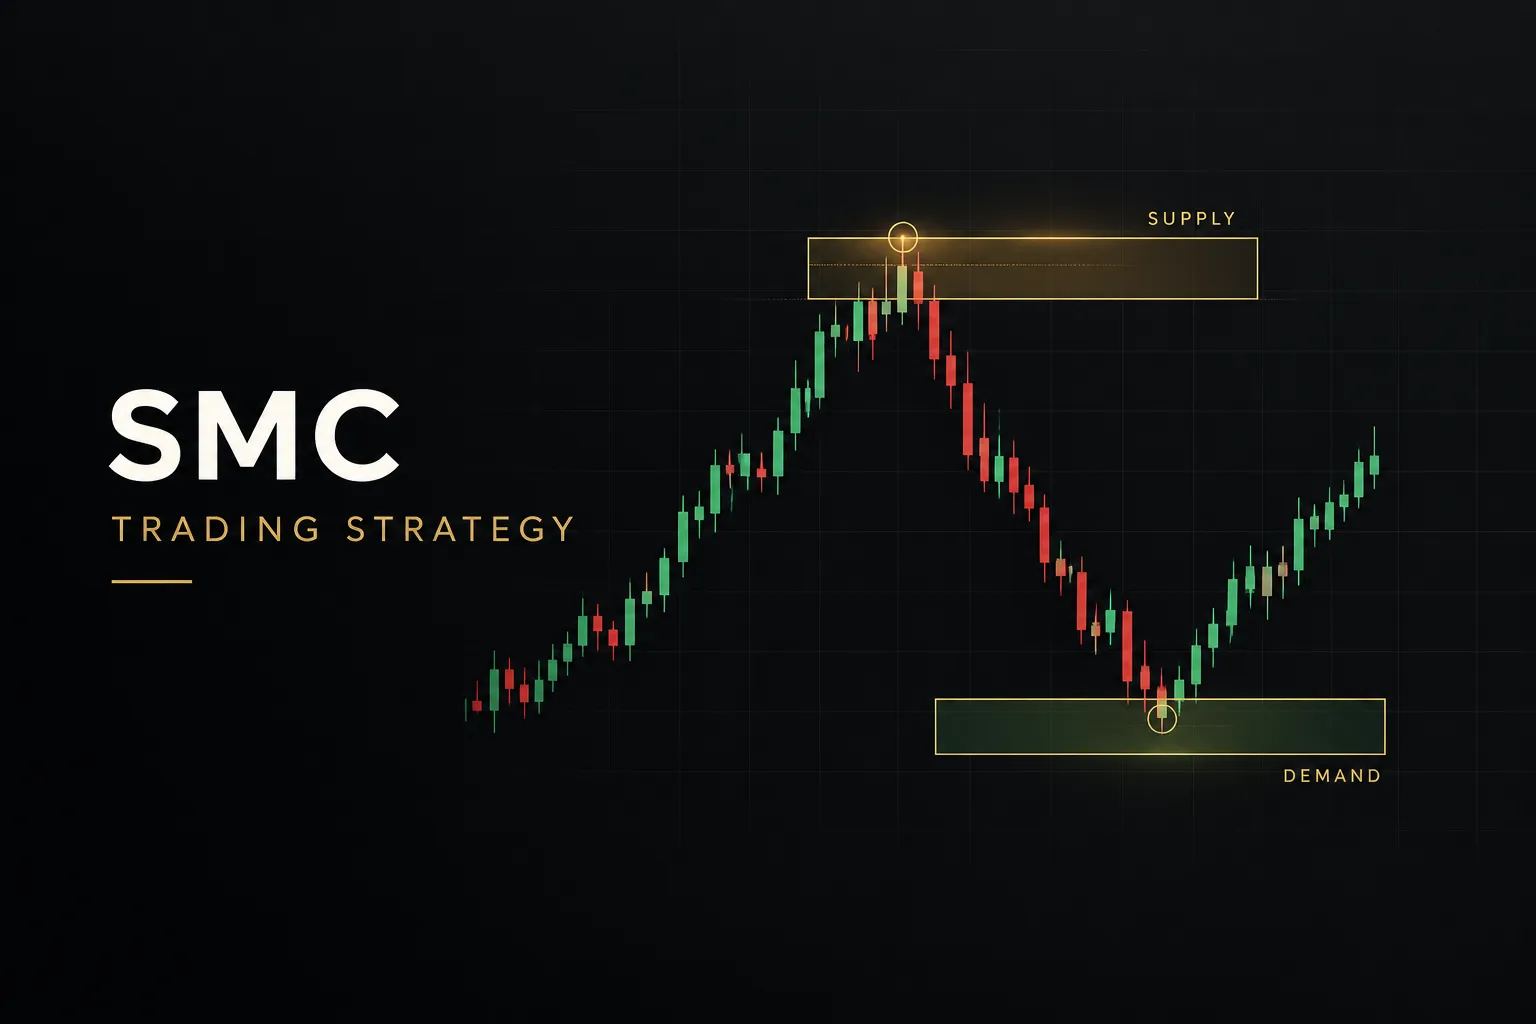
No fluff: how smart money concepts really works, what's testable, and what's just rebranded ICT jargon. See which patterns hold up on real charts.
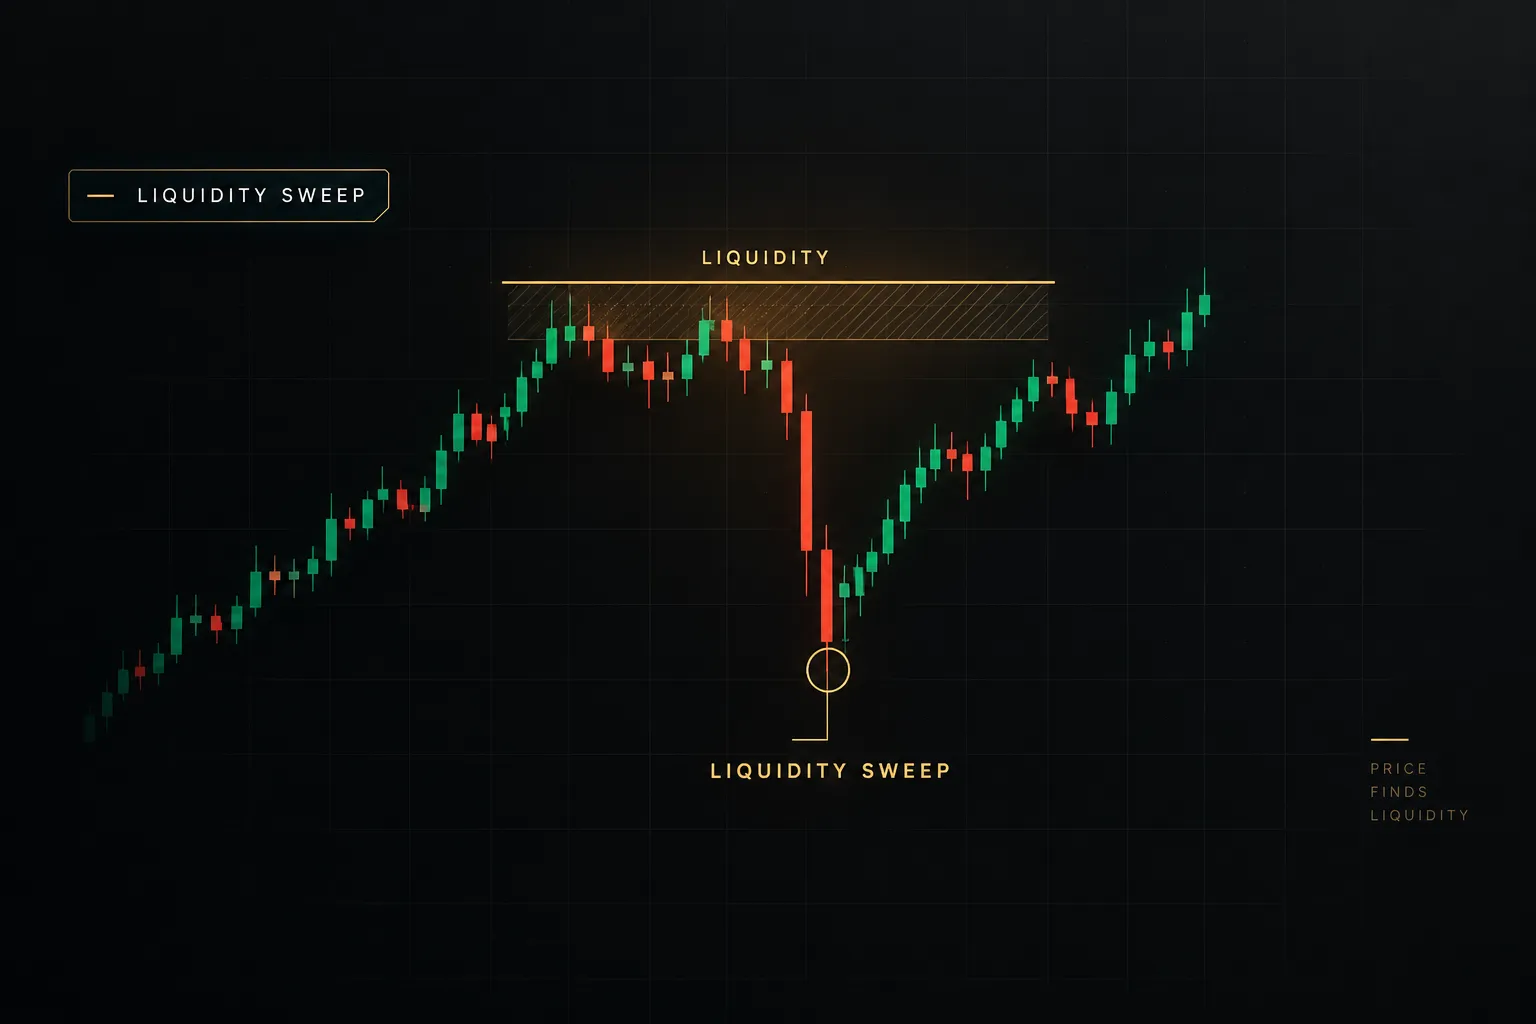
Not every wick is a reversal. See the confirmation rules and risk criteria that separate real sweeps from breakouts in 2026.
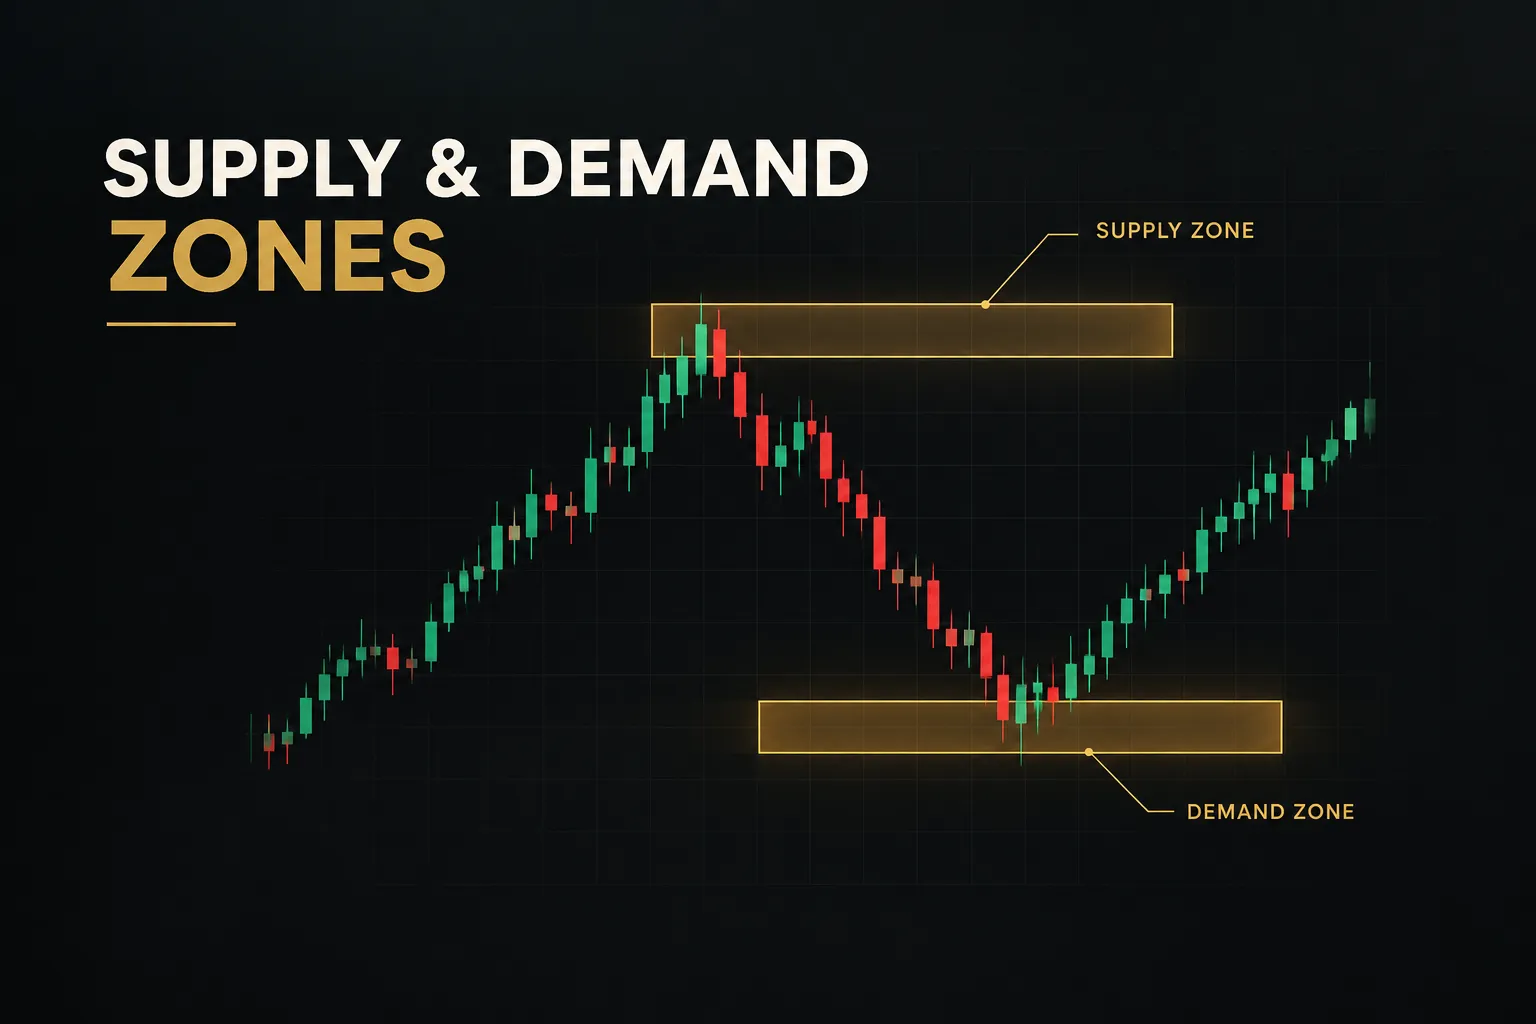
Learn objective rules for drawing supply and demand zones, plus how to validate, enter, and invalidate trades. No guesswork, just a testable framework.
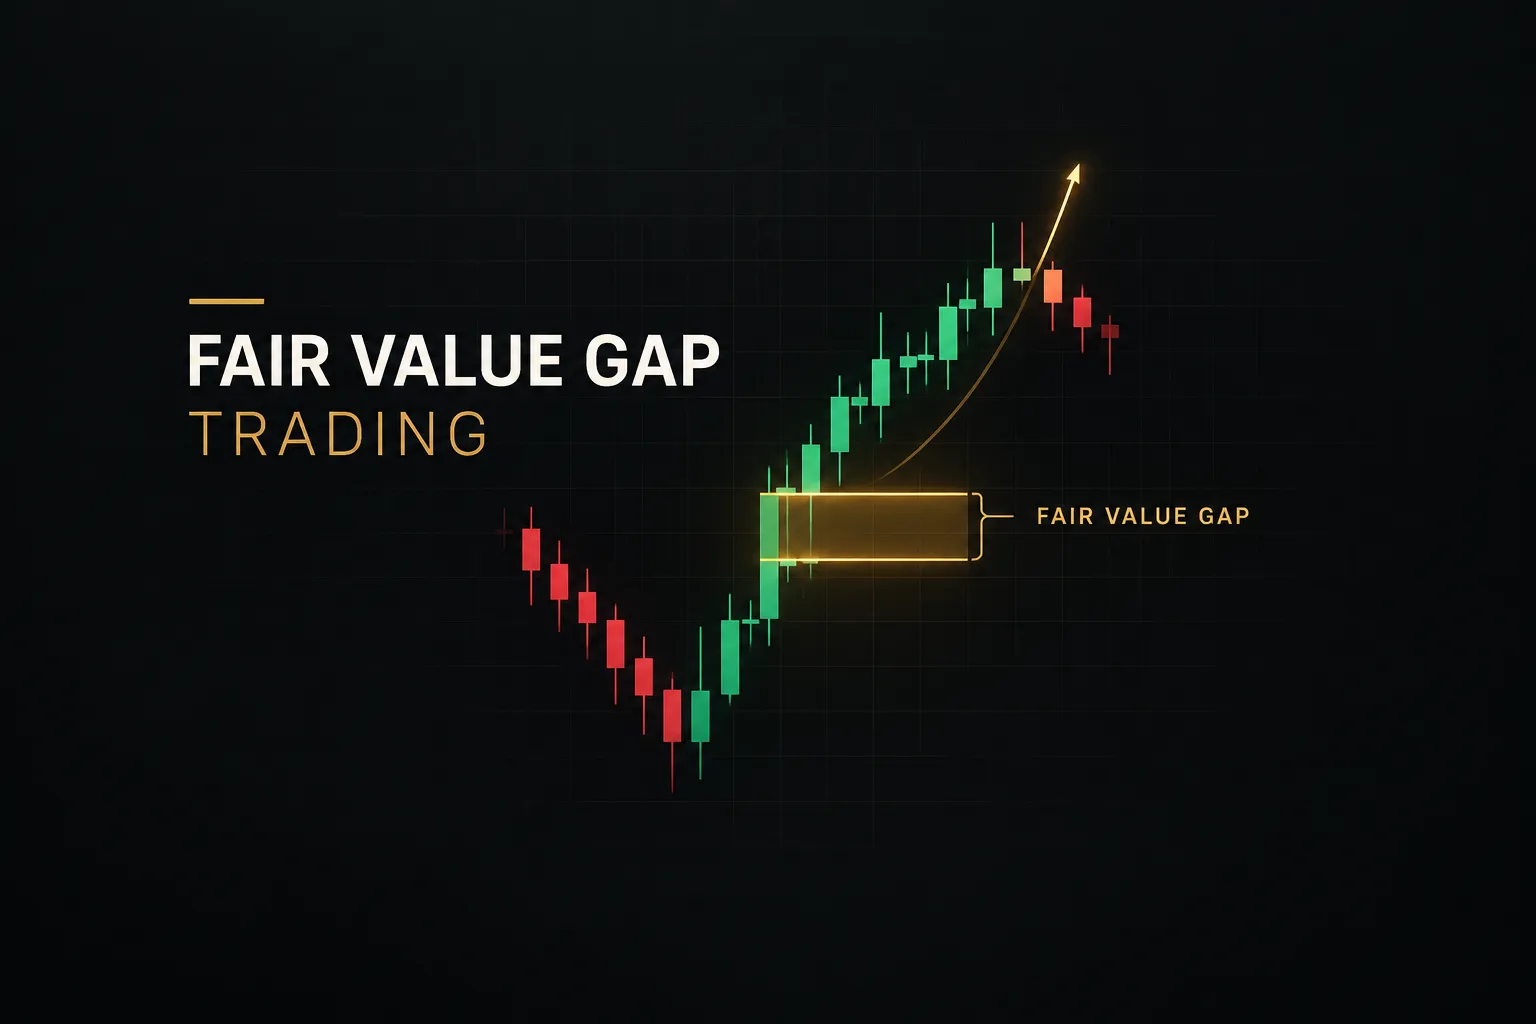
Skip the myths. Get exact FVG rules, real fill-rate data, and a framework you can backtest yourself this weekend.
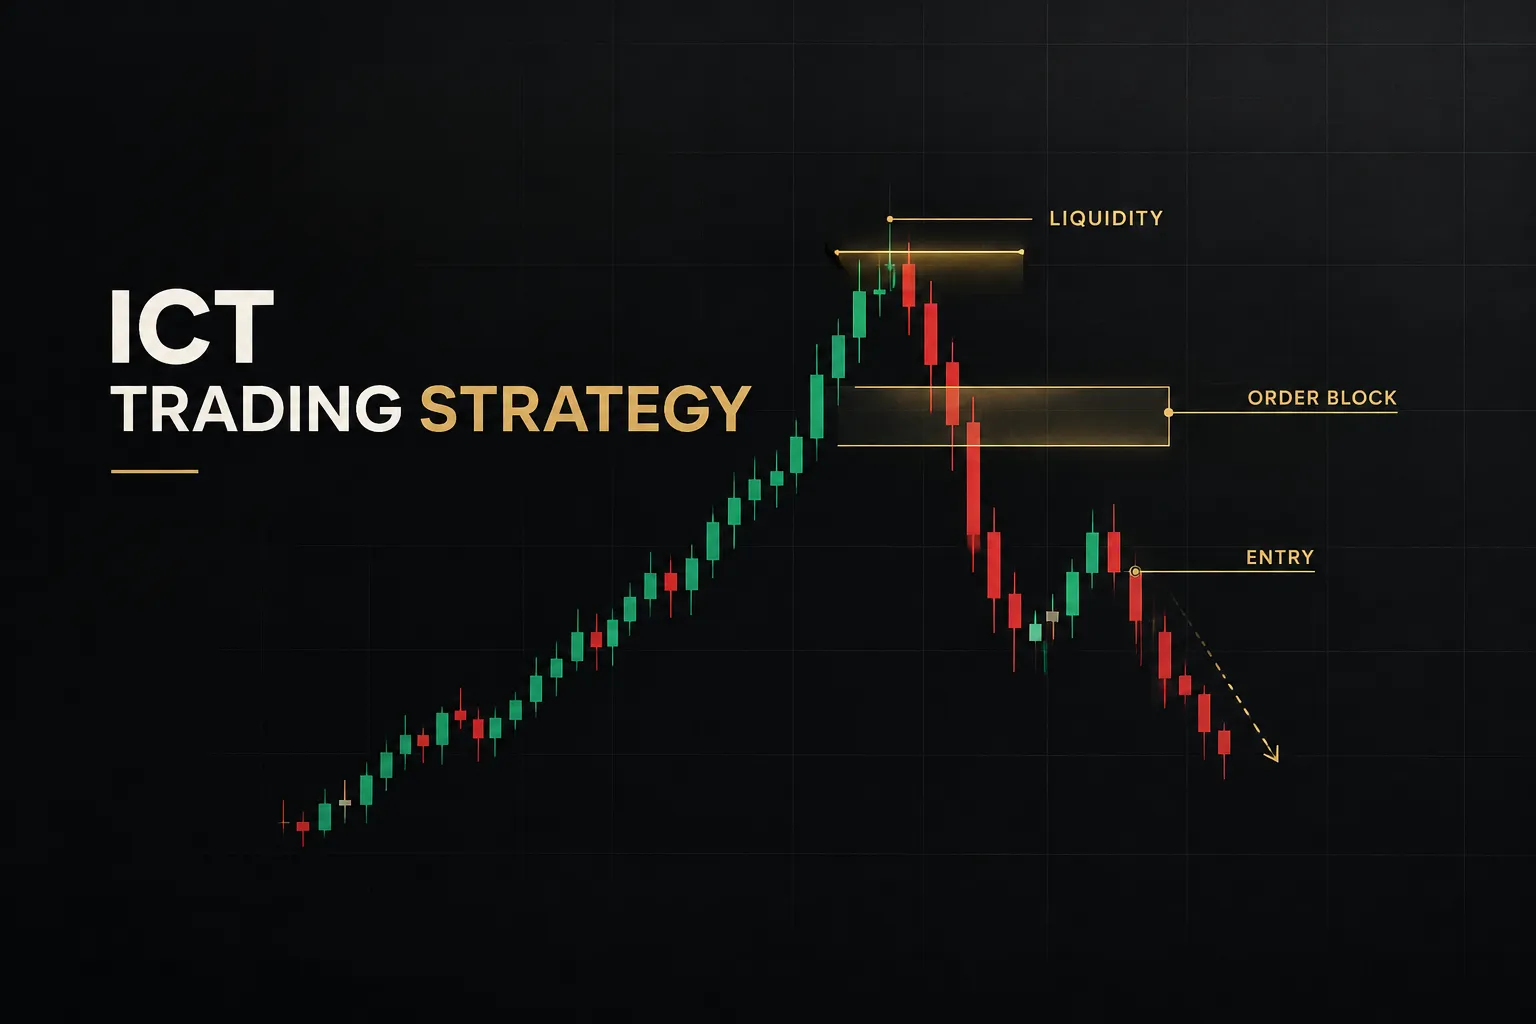
No hindsight charts. We break down ICT concepts into testable rules with clear invalidation points. See where the framework actually holds up.
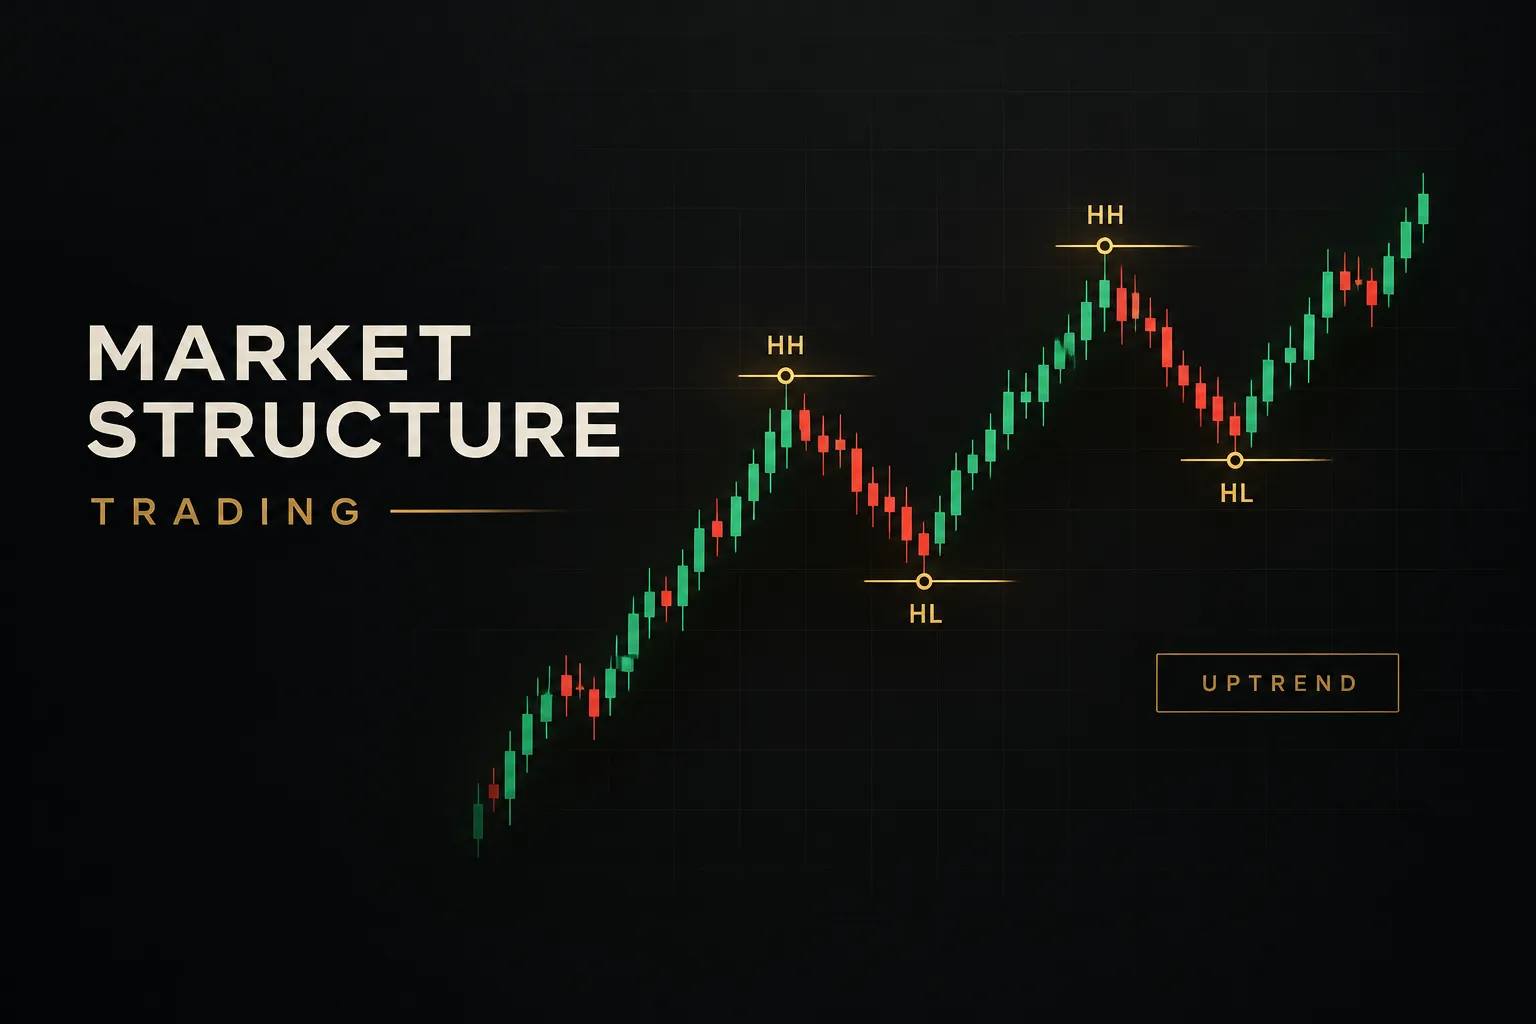
See the exact rules for marking BOS, CHoCH, and swing highs so ten traders read the same chart the same way. No more hindsight guessing.
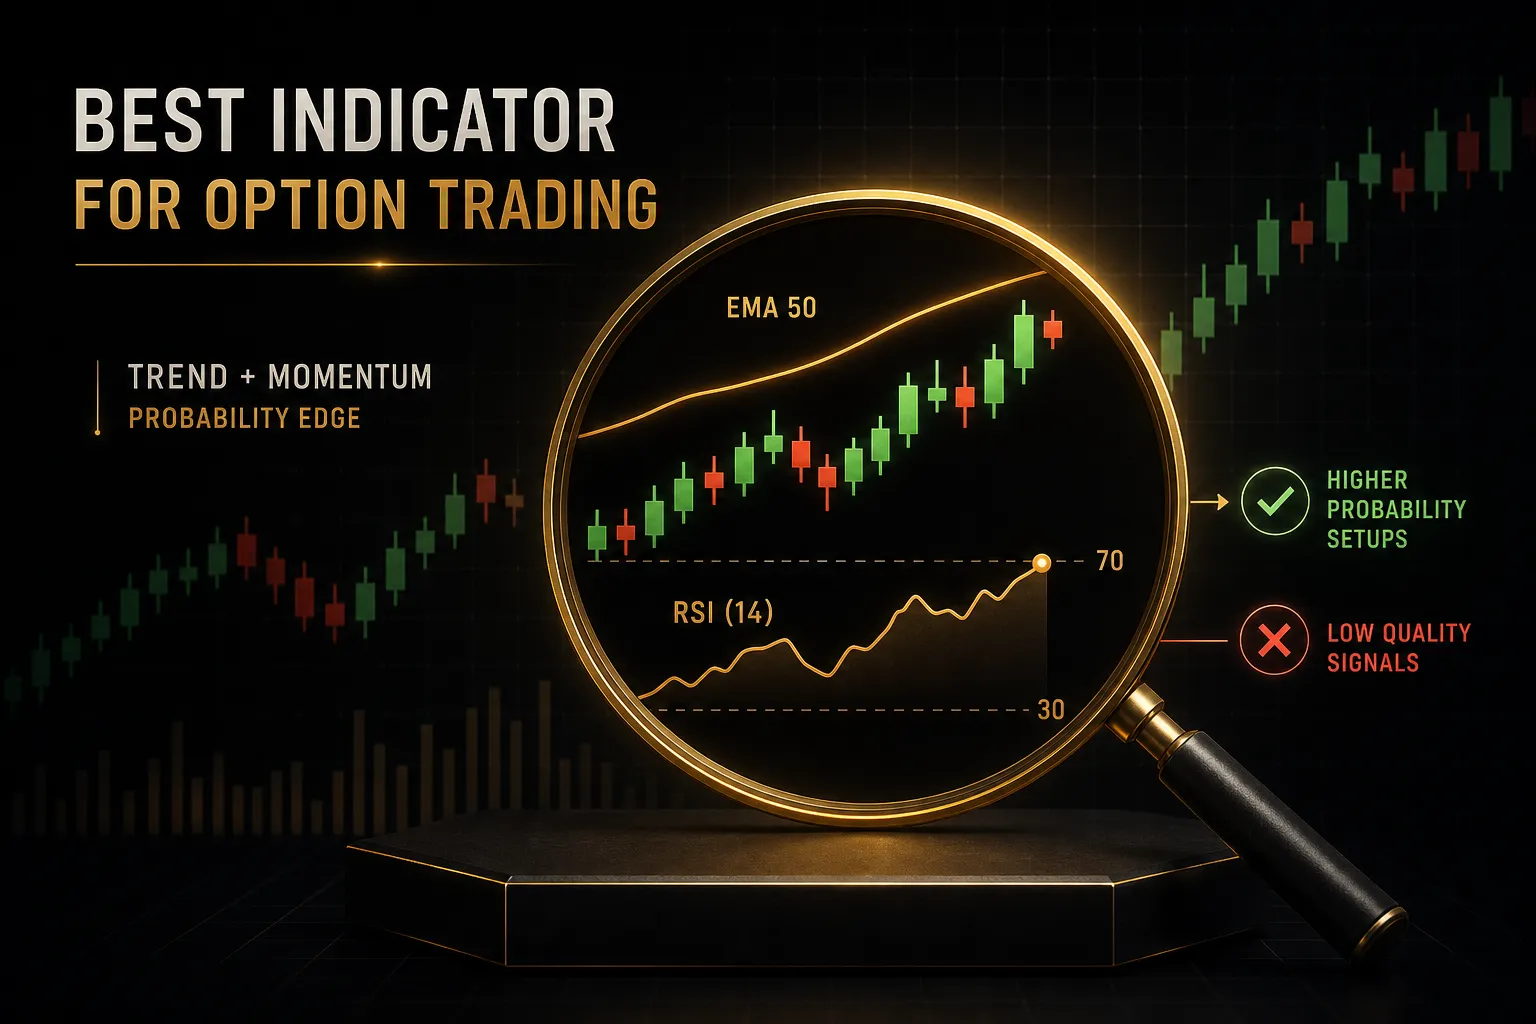
We compared direction, volatility, and entry tools for options in 2026. See which indicator actually beats IV crush and why one stood out.
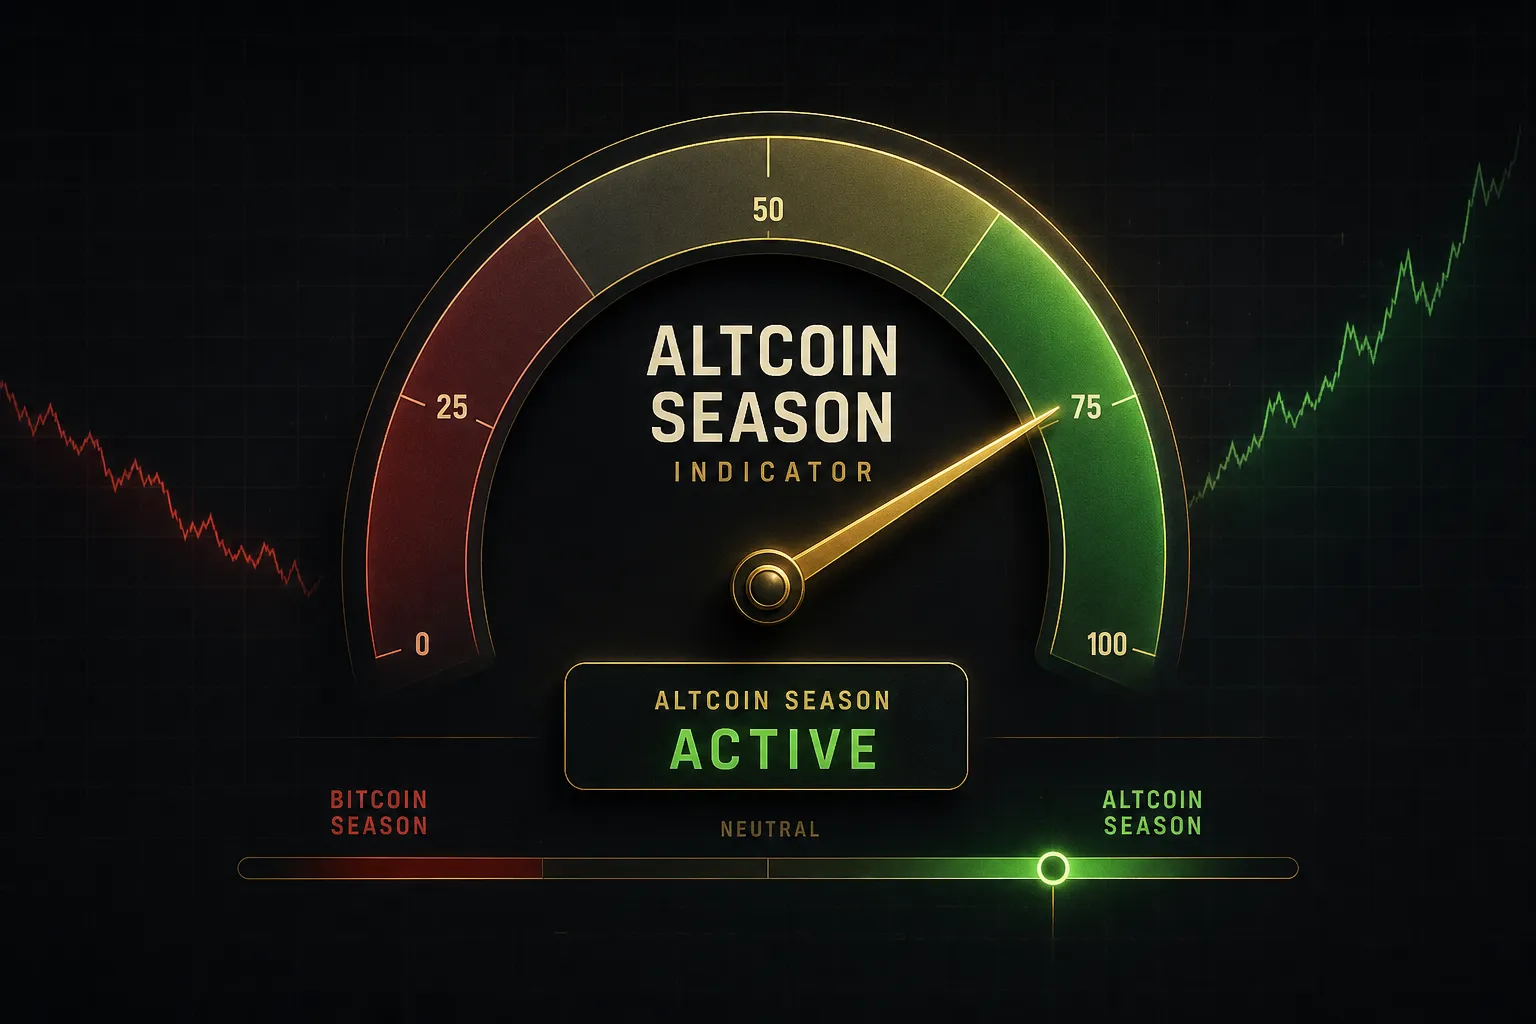
Learn how the altcoin season index really works, why 75 beats 50 as a threshold, and how to confirm signals with BTC.D and TOTAL2 before you trade.
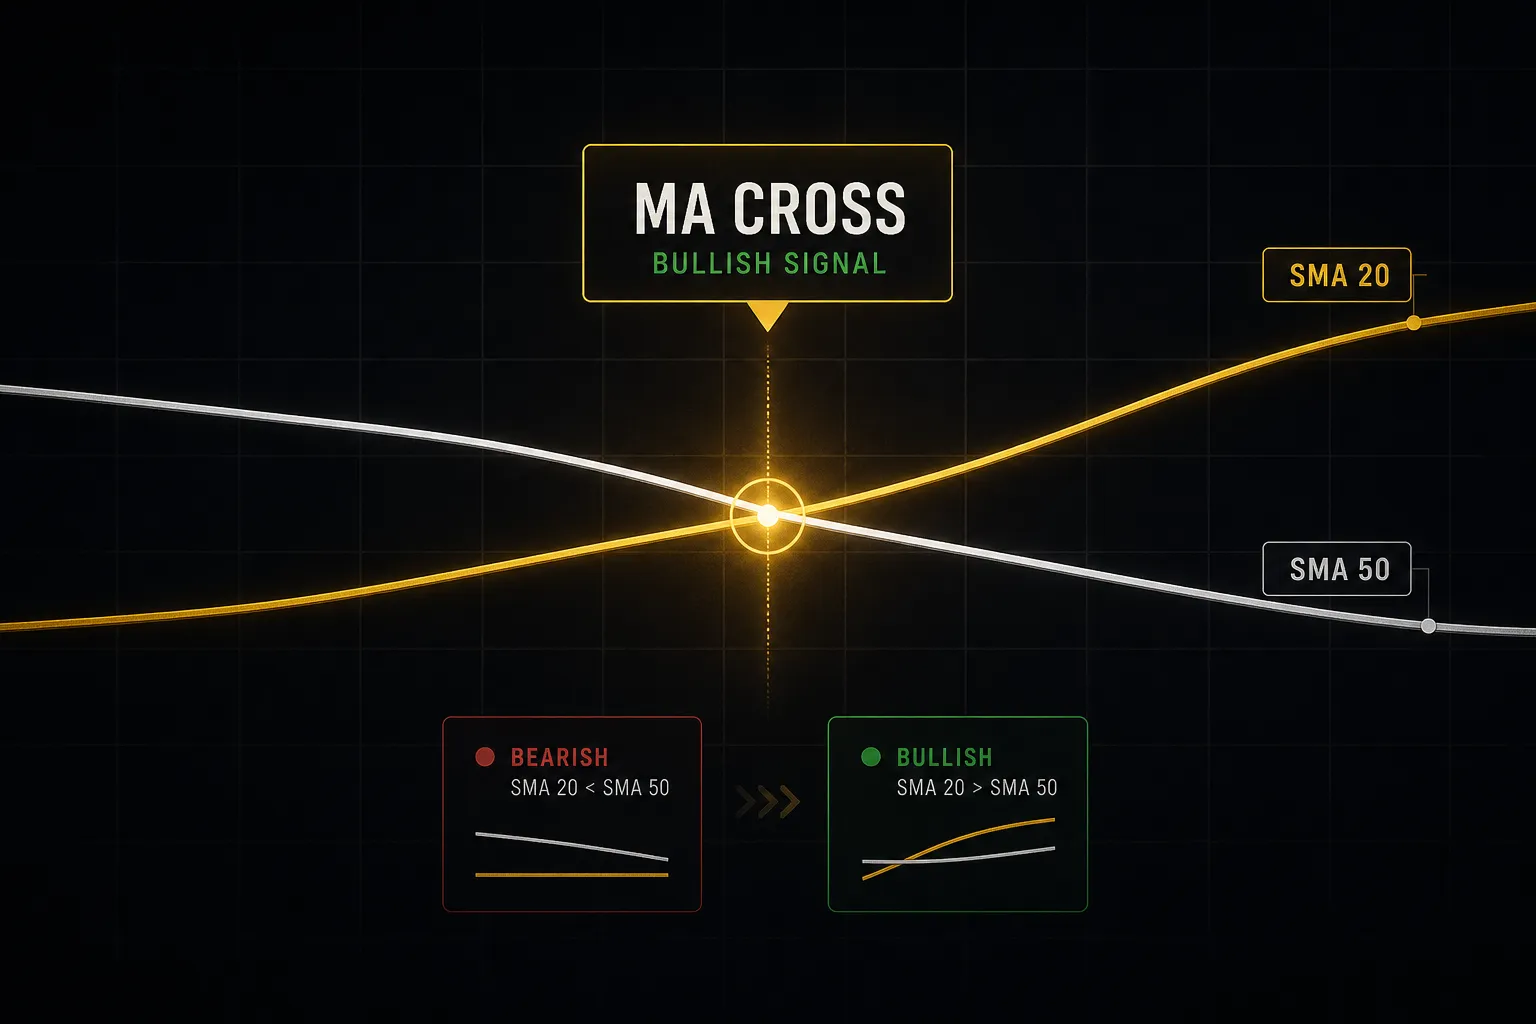
See why crossing moving averages often fire after 15-25% of the move is gone, and how to judge if a cross is worth trading in 2026.
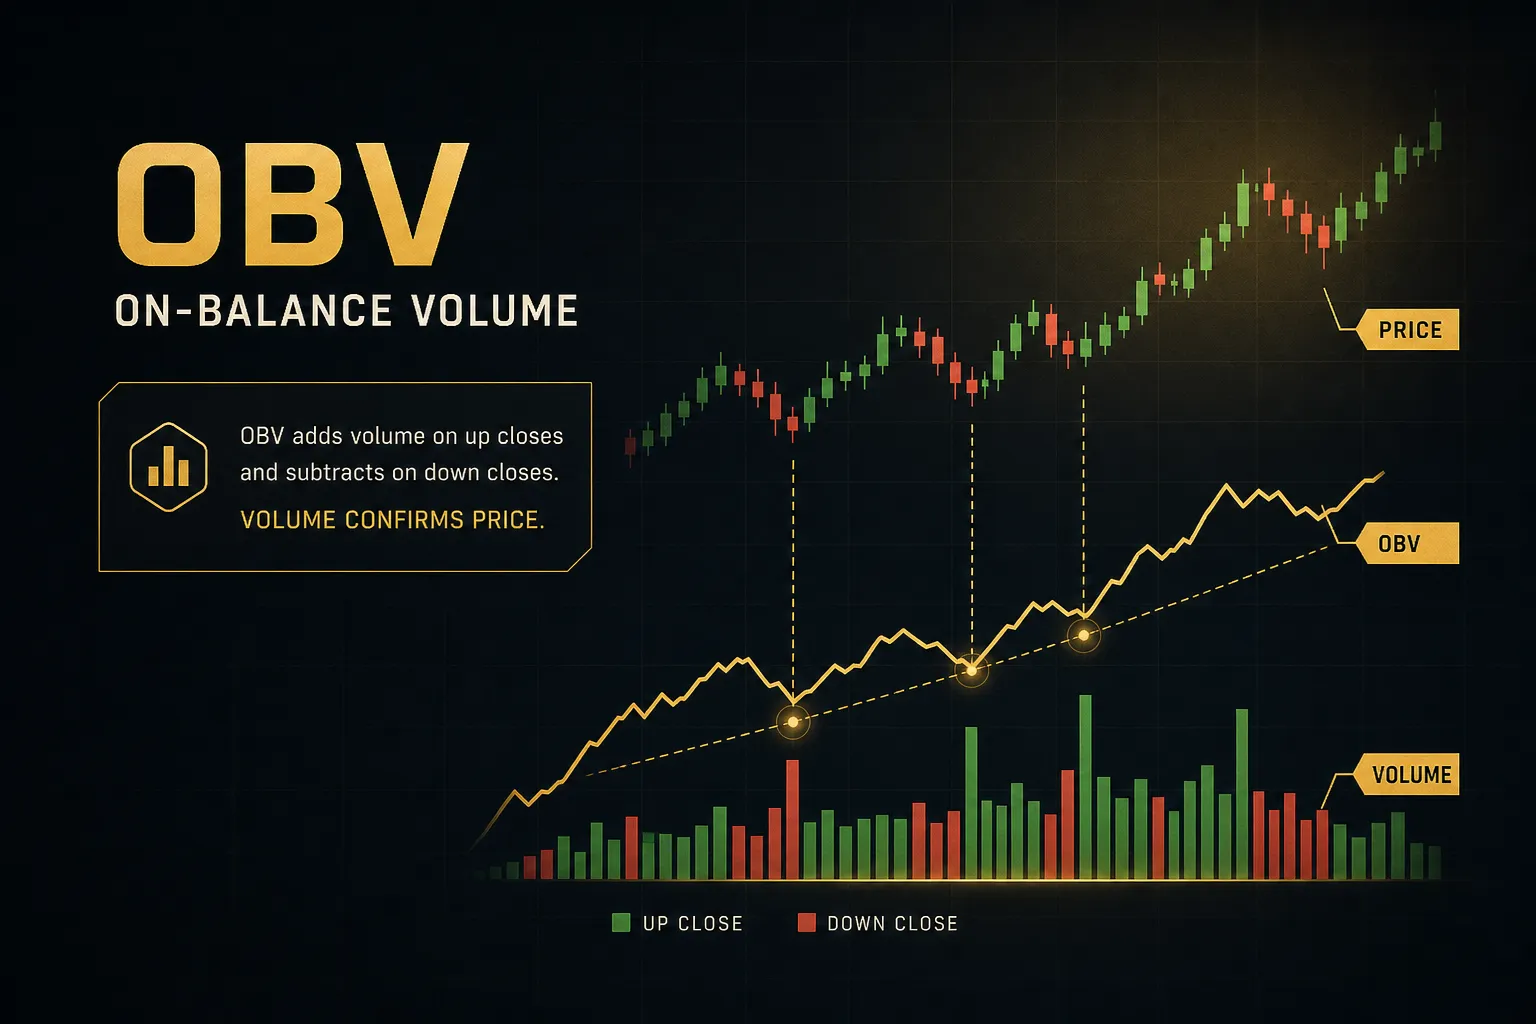
OBV won't give you buy signals, it flags fake breakouts. See how the 1963 formula works and why divergence isn't a shortcut. Full breakdown inside.
