Best Indicator for Option Trading in 2026: Direction, Volatility, and Entry Tools Compared
On this page
Best Indicator for Option Trading in 2026: Direction, Volatility, and Entry Tools Compared
Best Indicator for Option Trading in 2026: Direction, Volatility, and Entry Tools Compared
Introduction
If you trade calls, puts, credit spreads, covered calls, 0DTE contracts, or multi-day swing setups, you already know the problem with most “best indicator” lists.
They hand you an arrow and call it a strategy.
Here’s what almost nobody says out loud: RSI, MACD, VWAP, and moving averages analyze the underlying price, not the option contract.
They tell you nothing about implied volatility, nothing about time decay, and nothing about whether the premium you are about to pay is historically expensive or cheap.
You can be right about direction and still lose money.
Happens constantly around earnings, when volatility crush eats a correct call faster than the move can pay you back.
So this guide splits the job into four parts, because no single tool covers all four:
- Direction: is the underlying trending up, down, or chopping?
- Volatility context: is premium expensive or cheap right now (IV Rank, IV Percentile)?
- Entry timing: where exactly do you get in, at what price level?
- Risk control: position size, Greeks exposure, and when to exit.
Our top pick for the first, third, and fourth jobs is PipTrend, a TradingView-based system built around direction signals, marked entry levels, and a 12-timeframe management table. It should be paired with options-chain data (IV Rank and the Greeks) for the volatility piece.
Every tool below was assessed on the same five criteria: repainting behavior, multi-timeframe confirmation, alert quality, transparency of published results, and verified public pricing. Tools that hide their track record or their price get called out for it.
Quick Picks: Best Indicators for Option Trading at a Glance
Six options, six different jobs. The first column is our overall recommendation for traders who need a repeatable directional process.
| Tool | Best For | Price | Repaints? | Options-Chain Data Included | Rating |
|---|---|---|---|---|---|
| PipTrend | Best overall for direction, entries & trade management | From $40/mo (billed yearly, $479.99) | No, signals lock on candle close | No, pair with IV Rank/Greeks externally | Top pick |
| LuxAlgo Signals & Overlays | Best for a large all-in-one TradingView toolkit | Free tier + paid Premium/Ultimate/AI Ultra tiers | Varies by module and signal mode | No | 4.3 / 5 |
| Flux Charts Pro | Best for price action and SMC traders | $59.99/mo billed yearly ($719.88/yr) | Varies by toolkit | No | 4.2 / 5 |
| ChartPrime Plus | Best for visual structure & reversal signals | $117/mo via TradingView Paid Space | Varies by module | No | 3.9 / 5 |
| Zeiierman Trading Pro Suite | Best budget indicator library | From $37.99/mo billed annually | Varies across 80+ indicators | No | 4.0 / 5 |
| IV Rank & Greeks Dashboards | Best options-chain companion | Varies by broker/platform (often free, up to ~$50/mo) | N/A, not a chart signal | Yes, this is the point | Essential |
Two entries in the full review below did not make the quick-pick table: Market Cipher (12-month membership at $600, lifetime at $1,500) and AlgoXpert (7-day free trial, subscription price not publicly listed). Both are covered in detail further down.
Pricing and repaint status were verified at the time of writing. Vendors change both. Always confirm on the vendor site before subscribing.
PipTrend: Best Overall System for Direction, Entries & Trade Management
PipTrend is the strongest chart-based foundation on this list for options traders who need a repeatable process rather than another folder of scripts.
The reason is structural, not cosmetic.
Most indicators fire an arrow and leave you to guess the rest.
PipTrend deliberately separates the two decisions: the signal gives direction only, and the entry comes from a marked price level (VWAP, session highs and lows, previous day high/low, supply and demand zones, fair value gaps).
That single design choice stops traders from buying the top the second a green arrow prints.
Direction is painted directly onto the candles.
Green for bullish momentum, red for bearish pressure, gray while a trend is still forming.
Those gray candles matter for options traders because they flag the early phase of a move, before the crowd piles in and the premium gets bid up.
Trade management runs through a 12-timeframe confirmation table covering 1-minute up to Monthly. When you’re holding a weekly call and the H4 and Daily both flip neutral, you have a rules-based exit instead of a feeling.
Other features that carry weight for options work: a whipsaw filter that keeps you out of chop (where theta quietly eats long premium), the Confidence Band for pullback entries, automatic session killzones for Asian, London, NY AM and NY PM, and real-time push, email, and desktop alerts on any instrument and timeframe.
On the repainting question: signals confirm on candle close and do not change afterward. That is the standard any serious repainting indicator test should demand.
PipTrend publishes trade ideas taken with the indicator on a public results page with verified cTrader statements, losses and break-evens included. Not a highlight reel. That level of transparency is rare in this category.
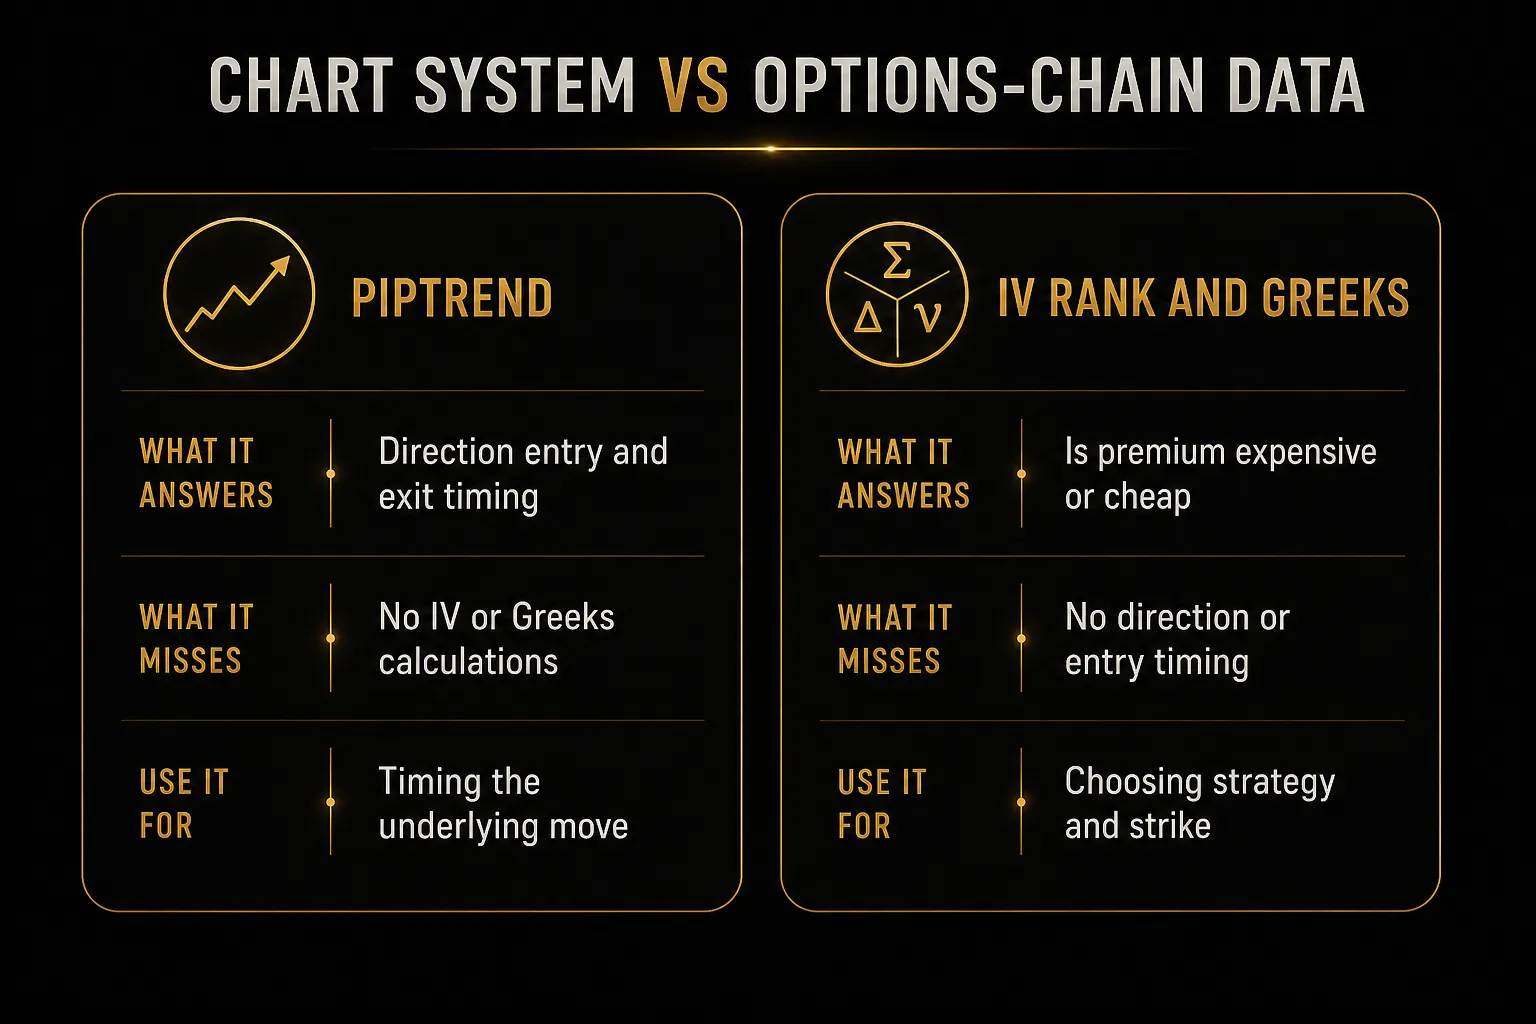
The honest drawback: PipTrend is a chart-based direction, entry, and exit system, not an options-chain analytics platform.
It does not calculate IV Rank, Greeks, or premium pricing.
Options traders need to pair it with a broker’s options chain or a dedicated IV Rank tool before choosing strikes and expirations.
Used correctly, that pairing is the whole workflow: PipTrend times the entry on the underlying, IV Rank tells you whether to buy premium or sell it.
Best for: day traders using 1m-15m session levels, swing traders reading H8 and Daily direction, prop-firm challenge traders who need fixed rules, and long-term investors timing entries off Weekly and Monthly candles. Covers Forex, Crypto, Indices, Commodities, and Stocks.
PipTrend Pricing Tiers
Monthly Plan
$59.99/mo, billed monthly.
Full access to every PipTrend indicator, real-time alerts, all markets, community access, and future updates.
Scheduled to increase to $83.99/mo.
Best if you want to test the system across a full market cycle without an annual commitment.
Quarterly Plan
$45/mo, billed as $134.99 every three months.
Saves $180/year against monthly billing.
Scheduled to increase to $63/mo.
The sensible middle tier for traders working through a prop-firm challenge with a defined timeline.
Yearly Plan
$40/mo, billed as $479.99 once per year.
Saves $240/year versus monthly, and it’s the cheapest per-month access.
Scheduled to increase to $56/mo.
All three plans include a 3-day free trial and a 30-day money-back guarantee, plus 18 free companion calculators (position size, risk-reward, expectancy, compounding, and more). Checkout runs through Whop with card and PayPal.
LuxAlgo Signals & Overlays: Best for a Massive All-In-One TradingView Toolkit
If you want the widest possible library of studies in one subscription, LuxAlgo is the deepest option here.
Nobody else on this list comes close on raw breadth.
The core Signals & Overlays toolkit gives you configurable signal modes, candle coloring, dashboards, take-profit and stop-loss points, and built-in TradingView alerts. Price Action Concepts adds market structure, BOS and CHoCH labeling, order blocks, liquidity concepts, fair value gaps, premium/discount zones, and a multi-timeframe dashboard.
Beyond the toolkits, the LuxAlgo Library spans hundreds of studies across trend, momentum, volatility, SMC/ICT, Wyckoff, Elliott Wave, chart patterns, and machine-learning concepts. The wider platform layers on screeners, order-flow tools, strategy alerts, backtesting, trade journaling, and Quant-generated Pine Script.
Pricing: a free tier is available.
Paid Premium, Ultimate, and AI Ultra tiers are offered on monthly and annual billing, with annual plans described as roughly 40% to 50% below month-to-month rates.
All paid plans carry a 30-day money-back guarantee. Stable numeric prices were not exposed on the public pricing page at the time of writing, so confirm current rates directly.
Target user: advanced TradingView users who enjoy configuring a dense platform and want one ecosystem for charting, screening, and analysis.
The honest drawback: breadth cuts both ways.
New users routinely end up with cluttered charts and conflicting signals, and the learning curve is steep.
Like every chart-based suite here, it isn’t built around options-specific metrics, so IV Rank, Greeks, and expiration selection still have to come from somewhere else.
Flux Charts Pro: Best for Price-Action and Supply/Demand Options Traders
Flux Charts Pro is the pick if your directional read comes from market structure rather than oscillators. Order blocks, fair value gaps, and multi-timeframe supply and demand zones are the backbone of the product.
The subscription bundles three main toolkits: SFX Algo, Price Action, and MTF Supply & Demand Zones. Each ships with its own dedicated screener and backtester, which is unusual at this price point and genuinely useful when you want to see how a structure setup performed before risking premium on it.
The Price Action Toolkit covers BOS and CHoCH, liquidity sweeps, breaker blocks, premium/discount zones, session markers, previous highs and lows, alerts, and multi-timeframe analysis. Daily live educational classes, a strategy library, and 24/7 priority support round out the package.
Pricing: the Pro plan runs $59.99/mo billed yearly, charged as $719.88 annually. That includes all TradingView toolkits, the screeners, three backtesters, live education, and priority support.
Target user: traders who time call and put entries off demand zones and structural breaks, and who value screening across many tickers to find setups.
The honest drawback: no built-in options-chain volatility data or Greeks, so contract selection remains a separate exercise.
And the module count can be excessive if you want one clear decision process rather than three overlapping toolkits competing for screen space.
ChartPrime Plus: Best for Visual Market Structure and Reversal Signals
ChartPrime Plus delivers the most visually polished trend-and-reversal package on this list, at the highest price.
Whether that trade is worth it depends entirely on how much you value presentation.
Three components carry the suite.
Oracle Pro handles trend and reversal signals with auto-optimization and custom signal configuration.
Market Dynamics Pro covers smart-money concepts, order blocks, chart patterns, multi-timeframe support and resistance, and market structure.
Prime Oscillators Pro handles momentum, divergences, and price-volume analysis.
ChartPrime promotes 50-plus tools in total, plus private community access, live sessions, and daily market insights. It works across TradingView’s stocks, crypto, forex, futures, and commodities markets.
Pricing: $117/mo through the ChartPrime TradingView Paid Space. The website advertises a 7-day money-back policy, subject to current terms.
There is no free trial.
Target user: traders who want a single broad visual suite covering trend, structure, and oscillators without managing separate scripts from different vendors.
The honest drawback: at $117/mo it costs nearly three times PipTrend’s annual rate, with no trial to test it first.
Beginners tend to get overwhelmed by the volume of overlays, and there are no dedicated options-chain analytics such as IV Rank, IV Percentile, or Greeks.
Zeiierman Trading Pro Suite: Best Budget-Friendly Indicator Library
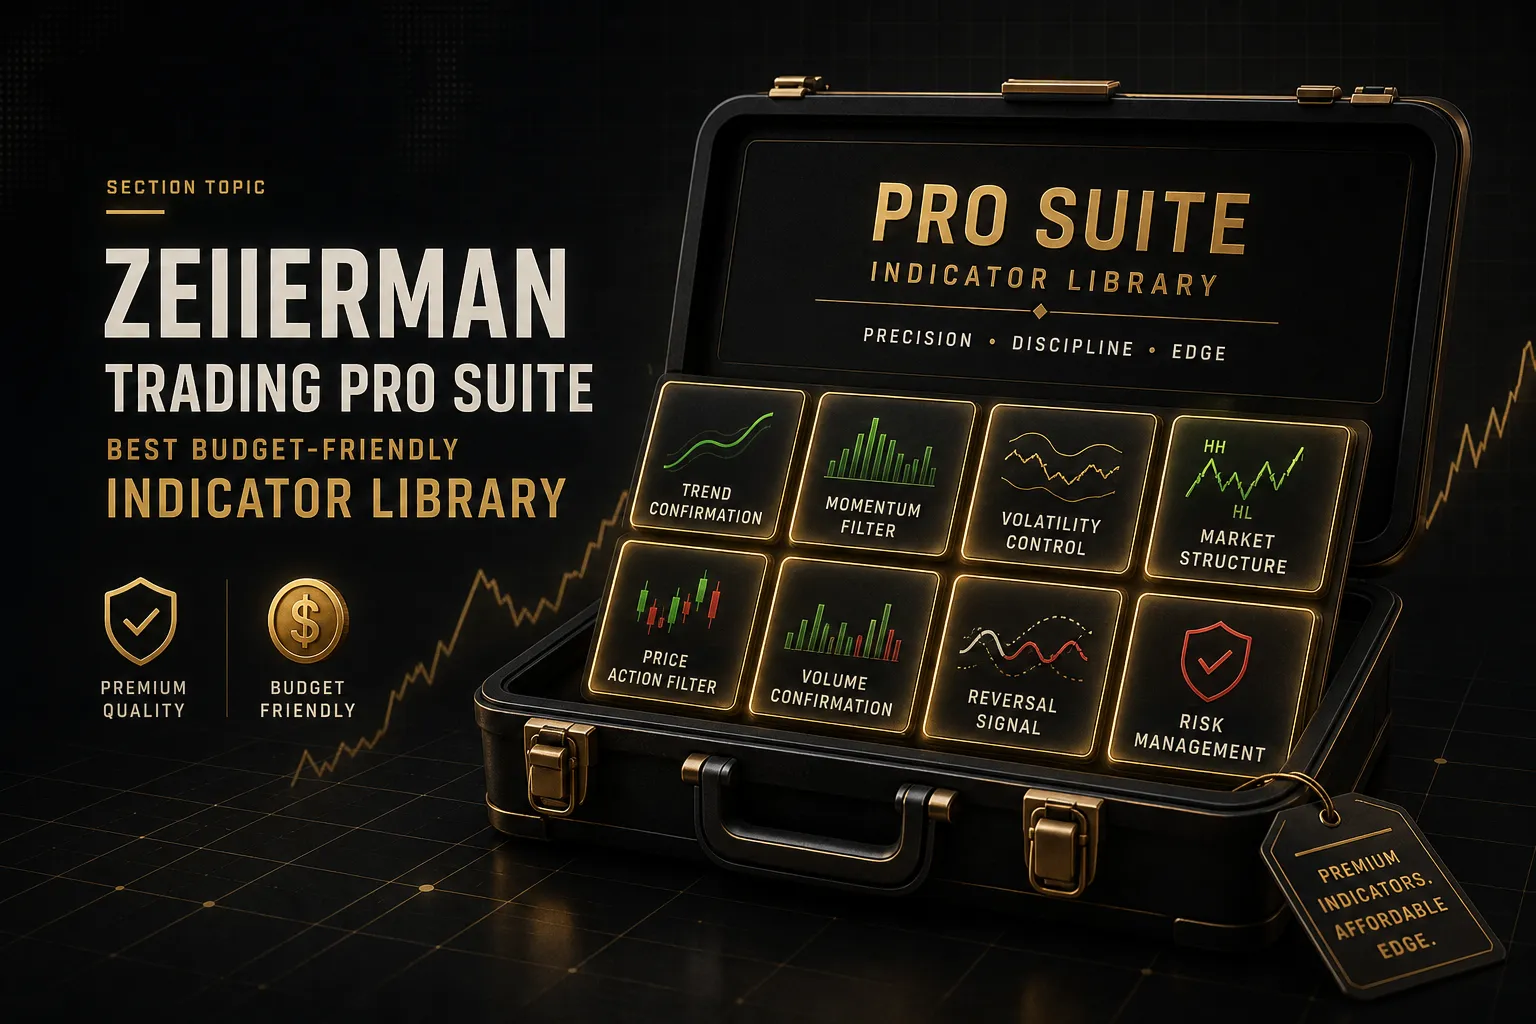
Zeiierman offers the most tools per dollar of anything reviewed here. If your priority is a large library at a low entry price, this is the one.
The Pro Suite includes more than 80 premium TradingView indicators spanning trend, momentum, support and resistance, supply and demand, smart-money concepts, reversals, oscillators, volume, volatility, and risk management. Add nine advanced buy/sell algorithms, liquidity signals, two automated-strategy bots, a set of free indicators, and VIP Discord access.
There are also predefined strategies, trade callouts, tutorials, and educational material, with claimed real-time backtesting. It covers stocks, forex, crypto, commodities, and indices across short and long timeframes.
Pricing: advertised at $49/mo billed monthly, $59.99/mo billed quarterly, and $37.99/mo billed annually.
Lifetime access is promoted, though a stable public lifetime price wasn’t displayed.
Discount codes appear regularly on the pricing page.
Target user: budget-conscious traders who want maximum tool count and enjoy experimenting with different indicator combinations.
The honest drawback: 80+ indicators encourages exactly the behavior that ruins options traders, stacking five tools that all measure the same variable and freezing when they disagree.
Promotional pricing shifts often, and like the rest of this category it is not an options-specific analytics platform.
Market Cipher: Best for a Proven Proprietary Momentum and Timing Suite
Market Cipher is a concentrated, recognizable toolset with a large community behind it, and by far the most expensive entry on this list.
The current membership includes four core scripts: Market Cipher A, Market Cipher B, Market Cipher SR, and Market Cipher DBSI.
That’s it.
No sprawling library, which is precisely the appeal for traders who have already built a process around these specific tools.
Membership delivers invite-only TradingView scripts, tutorials, an official guide, Discord community access, and support. The scripts work across crypto, stocks, currencies, futures, bonds, and precious metals.
Target user: experienced traders already fluent in the Market Cipher methodology who want a small, well-known toolset rather than dozens of overlapping scripts.
The honest drawback: the upfront cost is steep and there is limited public quantitative validation of the methodology.
Free TradingView accounts may hit the indicator limit when loading all four scripts, forcing you to remove other tools.
And there’s no options-chain data at all, so IV, Greeks, expiration, and strike selection are entirely on you.
Market Cipher Pricing Tiers
12-Month Membership
$600 for 12 months, listed as on sale from $1,000. That works out to roughly $50/mo, which is competitive on paper… but it’s paid as a single upfront charge with no monthly option to test the water.
Lifetime Membership
$1,500 lifetime, listed as on sale from $3,000.
It breaks even against the annual plan after two and a half years.
Enterprise and custom pricing require contacting the company directly.
AlgoXpert Trading System: Best for 0DTE and Intraday Session Traders
For same-day options, AlgoXpert has the most structured intraday confirmation process reviewed here.
It is built for traders who want a checklist, not an arrow.
The system runs a five-engine workflow: value, liquidity, qualifying zones, multi-timeframe bias, and entry confirmation. AlgoXpert advertises 61 modules packed into a single TradingView indicator slot, including volume profiles, point of control, value area high and low, untested POCs, low-volume zones, session frames, VWAP, points of interest, and structure timeframes.
The Command Deck reads ten timeframes and offers aggressive, standard, or conservative structure modes. The Confluence Core is tuned to M5 and only prints a confirmed setup after a 35-check entry engine passes, with candle-close locking and no historical repainting claimed.
That confirmation discipline matters enormously for 0DTE, where a single bad entry on a contract with hours of life left is close to unrecoverable.
Pricing: a 7-day free trial is advertised. No stable public subscription price was found on the site, so you’ll need to contact the vendor for current terms.
Undisclosed pricing is a legitimate mark against it.
Target user: intraday and 0DTE options traders who want rules-based confirmation before every entry.
The honest drawback: the tight M5 tuning limits usefulness for swing options traders working off Daily and Weekly charts.
And the volume modules use exchange-reported volume (tick volume for forex), which is not the same thing as true options order flow, implied volatility, or Greeks.
IV Rank, IV Percentile & Greeks Dashboards: Best Options-Chain Companion Tools
This is the category most “best indicator for option trading” roundups skip entirely, and it’s the one that separates profitable options traders from directional gamblers.
Every chart tool above analyzes the underlying.
These tools analyze the option itself.
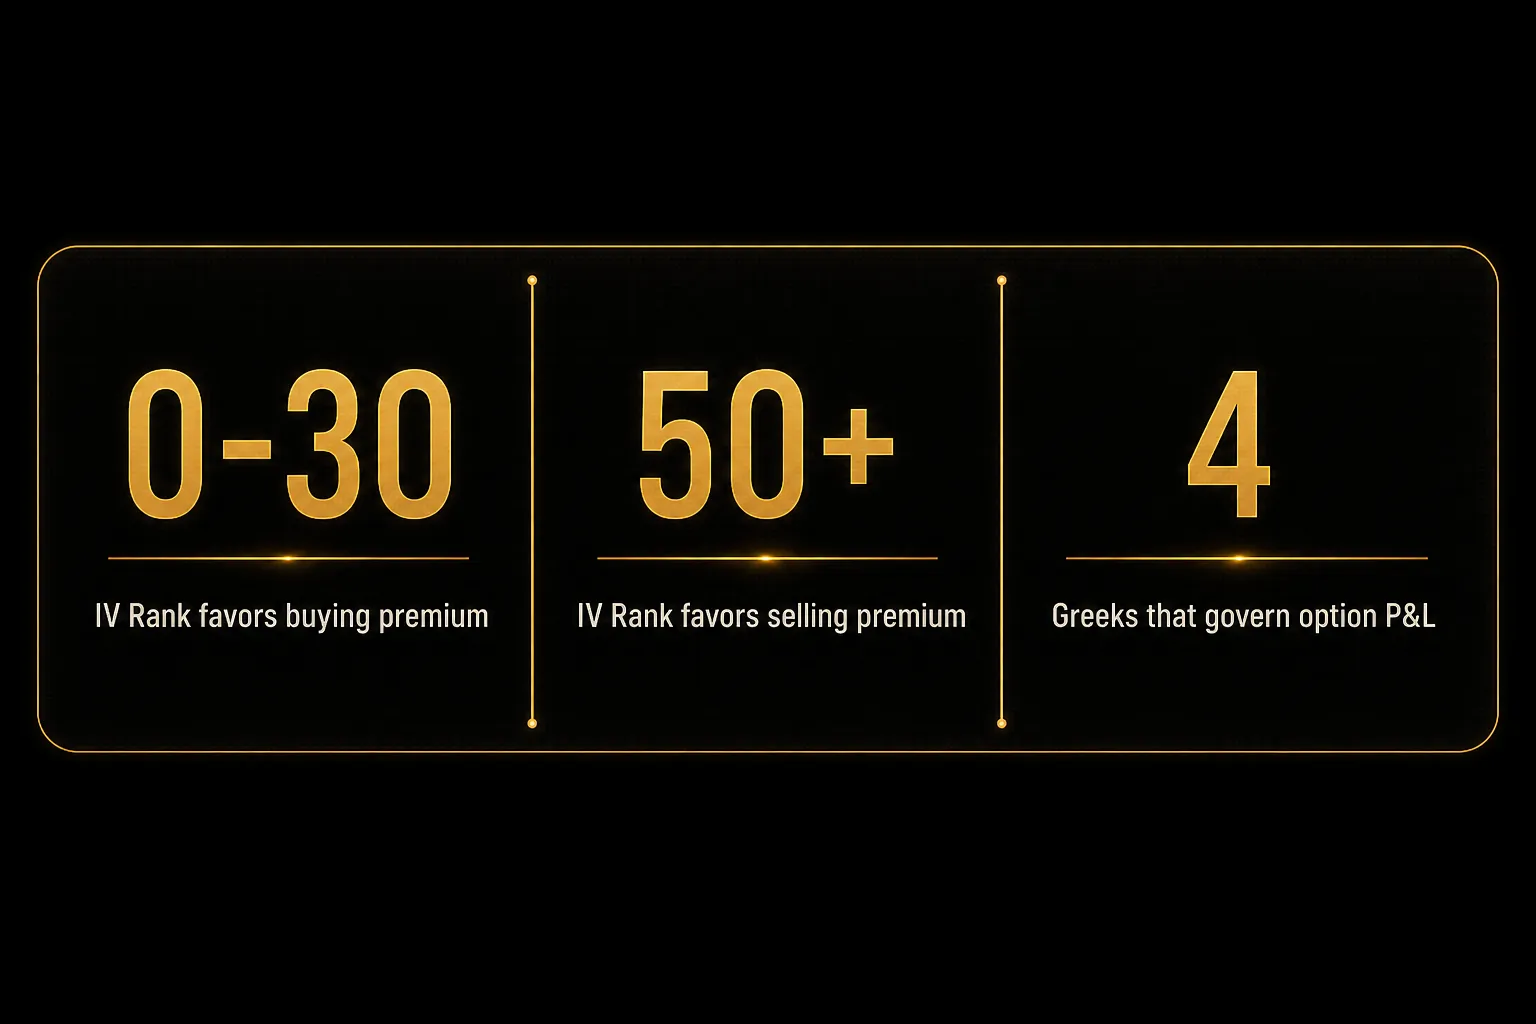
IV Rank tells you where current implied volatility sits relative to its 52-week range, on a 0-100 scale. IV Percentile tells you what share of the past year IV traded below today’s level.
Together they answer one question: is this premium historically expensive or cheap?
The strategy implication is direct.
Low IV Rank (say, under 30) favors buying premium, long calls and long puts, because contracts are cheap and an IV expansion works in your favor.
High IV Rank (over 50) favors selling premium through credit spreads, iron condors, and covered calls, because you’re collecting inflated prices that tend to mean-revert.
Then come the Greeks, which govern how a correct directional call actually converts into P&L:
- Delta: how much the option moves per $1 move in the underlying. Your directional exposure.
- Gamma: how fast Delta changes. Explosive near expiration, which is why 0DTE swings so violently.
- Theta: daily time decay. The rent you pay for holding long premium, and the income you collect when short.
- Vega: sensitivity to implied volatility changes. The reason correct earnings calls still lose money.
That last point deserves emphasis.
Buy a call into earnings with IV Rank at 85, watch the stock gap up 4%, and still lose money when IV collapses post-announcement.
Volatility crush punishes traders who read direction perfectly but ignored the premium they paid.
Pricing: most of this comes free inside broker platforms.
thinkorswim, Tastytrade, and Optionstrat all surface IV Rank, IV Percentile, and full Greeks at no extra cost.
Standalone TradingView options analytics and third-party subscriptions typically run $0 to $50/mo.
The honest drawback: these tools say absolutely nothing about direction, entry timing, or trend strength.
An IV Rank of 12 tells you options are cheap.
It does not tell you whether to buy the call or the put.
That’s why they must be paired with a directional charting system like PipTrend, LuxAlgo, or one of the others above.
Which Indicator Should You Actually Choose?
Pick by strategy, not by feature count.
Here’s the framework.
Long-premium directional trades (buying calls and puts). You need a clean trend and entry system plus cheap volatility. Pair PipTrend for direction and entry level with an IV Rank reading under 30.
Buying a call in a confirmed uptrend when premium is historically cheap is the highest-probability version of this trade.
Buying the same call at IV Rank 80 is a different trade with a much worse risk profile.
Short-premium trades (credit spreads, iron condors, covered calls).
Flip the priority.
Volatility context outranks chart signals here. Lead with IV Rank and IV Percentile above 50, then check Theta and Vega exposure, and only then use a chart tool to pick your strike placement relative to structure.
Selling premium in a low-IV environment is how accounts bleed slowly.
0DTE and intraday trades.
Session-based tools win.
AlgoXpert’s M5 confirmation engine or PipTrend’s VWAP, session killzones, and previous-day high/low levels give you the intraday reference points that same-day contracts live and die on.
Add bid-ask spread awareness: a wide spread on an illiquid 0DTE strike can cost more than your stop loss.
Swing and multi-day options. Higher-timeframe confirmation is everything, because you’re paying multiple days of Theta.
PipTrend’s 12-timeframe table or LuxAlgo’s multi-timeframe structure dashboards let you confirm that H4, Daily, and Weekly agree before you commit to a two-week expiration.
One rule cuts through all of it.
Pick one directional/entry system and one volatility reference. Nothing more.
Stacking three momentum oscillators that all measure the same variable does not improve accuracy, it just guarantees that something on your chart always disagrees with something else.
That’s how traders end up frozen at the exact moment a setup triggers.
Our recommendation: use PipTrend as your single chart-based foundation for direction, entries, and exits, then check IV Rank on the options chain before every trade to decide whether you’re buying or selling premium. One system for the underlying. One reference for the contract.
That combination costs about $40/mo for PipTrend on the annual plan plus whatever your broker already gives you for free. Compared to $117/mo for ChartPrime Plus or $600 upfront for Market Cipher, it’s the most efficient setup on this list for a working options trader.
FAQ: Common Questions About Indicators for Options Trading
Which indicator is most accurate for option trading?
No single indicator is “most accurate,” because options profitability depends on three separate variables: direction, implied volatility, and time decay.
The most reliable setup in 2026 is a non-repainting directional system such as PipTrend combined with IV Rank from your broker’s options chain.
Accuracy claims from any vendor selling a standalone arrow indicator should be treated skeptically unless backed by verified statements.
What is the best indicator for buying options?
For buying calls and puts, use a trend and entry system paired with a low IV Rank reading.
PipTrend’s color-coded trend candles and marked entry levels (VWAP, session highs/lows, supply and demand zones) time the entry, while IV Rank below 30 confirms you aren’t overpaying for premium.
Buying long premium when volatility is already elevated is the single most common way retail options traders lose on correct directional calls.
What is the best indicator for option selling?
For selling premium, IV Rank and IV Percentile are the primary indicators, not chart signals.
Look for IV Rank above 50 before opening credit spreads, iron condors, or covered calls, since you want to sell contracts that are historically expensive.
Chart tools then play a secondary role, helping you place short strikes outside key structure levels such as prior highs, lows, and demand zones.
Is RSI good for options trading?
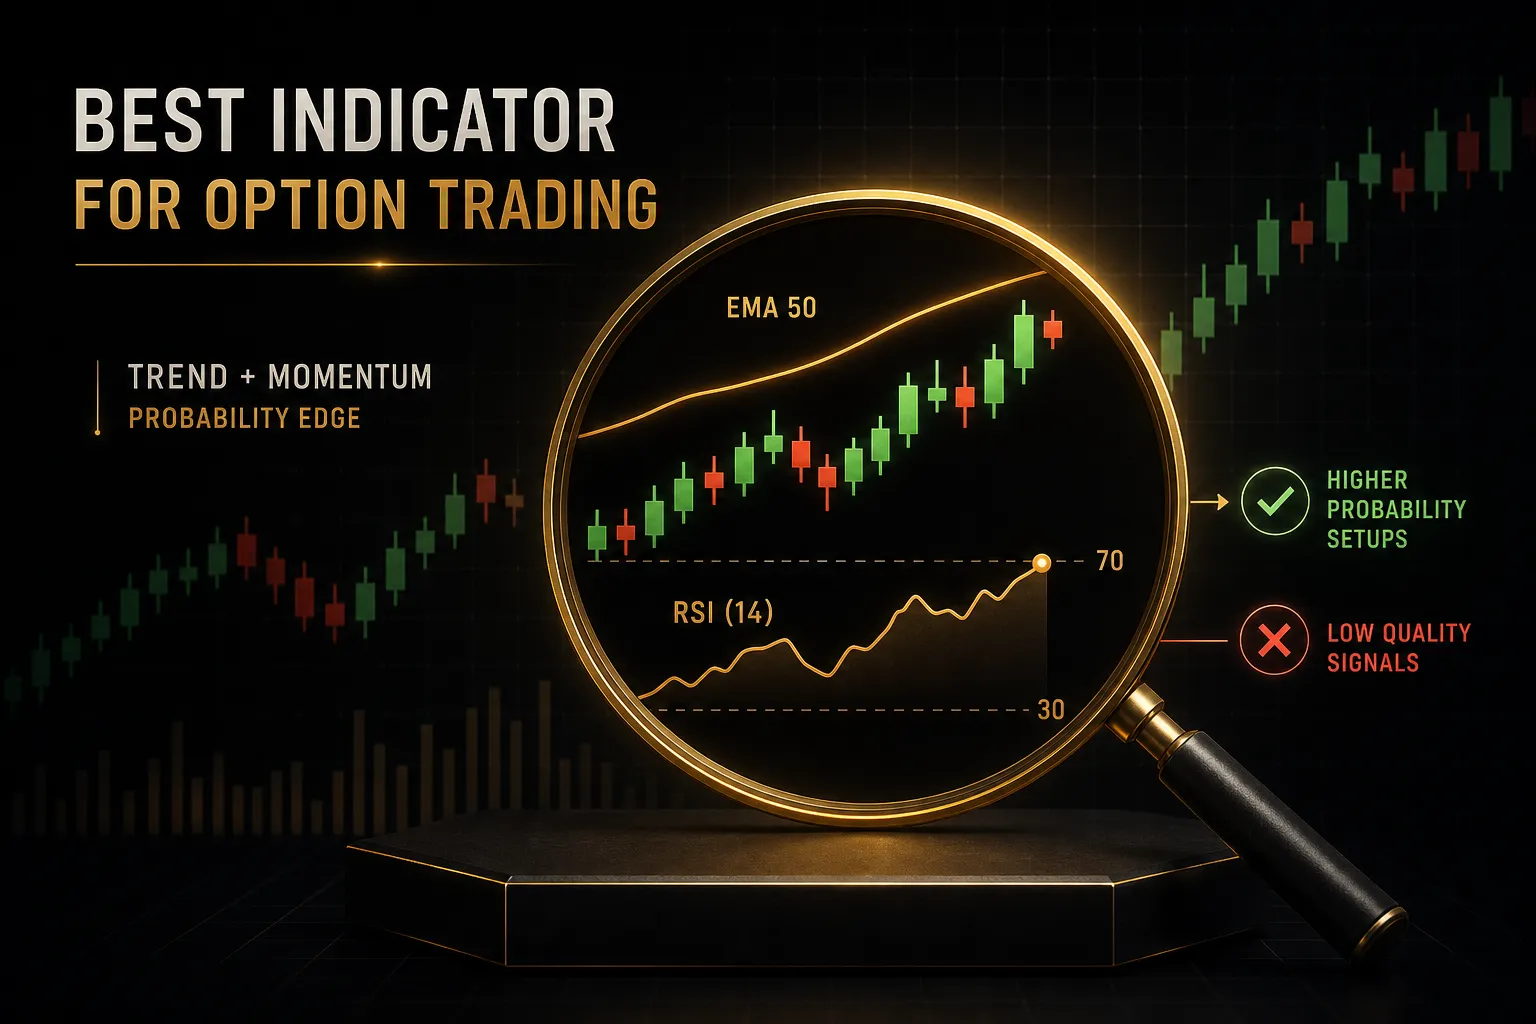
RSI is useful as a momentum reference but insufficient on its own for options.
It measures the underlying’s price momentum and says nothing about implied volatility, Theta decay, or whether your chosen strike is fairly priced.
RSI divergences can help time reversals, but pair them with a structured entry system and always check IV Rank before you pick the contract.
What is the best TradingView indicator for options trading?
PipTrend is our pick for the best TradingView indicator system for options traders in 2026, priced from $40/mo on the annual plan with a 3-day free trial and a 30-day money-back guarantee.
It separates direction from entry, confirms trades across 12 timeframes, locks signals on candle close, and publishes verified results including losses.
LuxAlgo is the strongest alternative if you want a much larger library and are comfortable with a steeper learning curve.
Which indicator is best for 0DTE options?
For 0DTE, prioritize session-based intraday tools: VWAP, opening range levels, previous day high and low, and volume profile.
AlgoXpert’s 35-check M5 confirmation engine and PipTrend’s session killzones plus VWAP levels are both well suited to same-day expirations.
Gamma exposure is extreme on 0DTE contracts, so confirmation discipline and tight bid-ask spread checks matter more than adding another oscillator to the chart.
Sources
Risk Disclaimer: Trading involves risk. Past performance doesn't guarantee future results. Only trade with money you can afford to lose. PipTrend is a tool to assist your trading decisions, not financial advice.