
You stare at your chart. Price makes a new high. Your RSI makes a lower high. Your MACD histogram shrinks while price climbs. Something's wrong. You know what convergence divergence is, but you freeze. Do you counter-trend the divergence? Wait for confirmation? Check another timeframe? Most traders learn the concept, spot the pattern, then lose money because they mistake recognition for strategy. The gap between seeing divergence and trading it profitably sits in the details – which timeframes matter, how you separate direction from entry, and whether your signals repaint after you commit capital.
Understanding Convergence Divergence Beyond the Textbook Definition
Convergence divergence describes the relationship between price movement and indicator movement. When price and your indicator move in the same direction, they converge. When they move in opposite directions, they diverge. The concept of divergences in technical indicators explains how this relationship signals potential reversals, but most educational material stops there.
You need to understand that divergence doesn't predict – it warns. Price makes a higher high at 1.0850 on EUR/USD. Your oscillator makes a lower high. That's bearish divergence. It tells you momentum is fading, not that price will reverse in the next five candles. The warning becomes actionable only when you layer it with price action, support and resistance, and multi-timeframe confirmation.
Regular Divergence vs Hidden Divergence
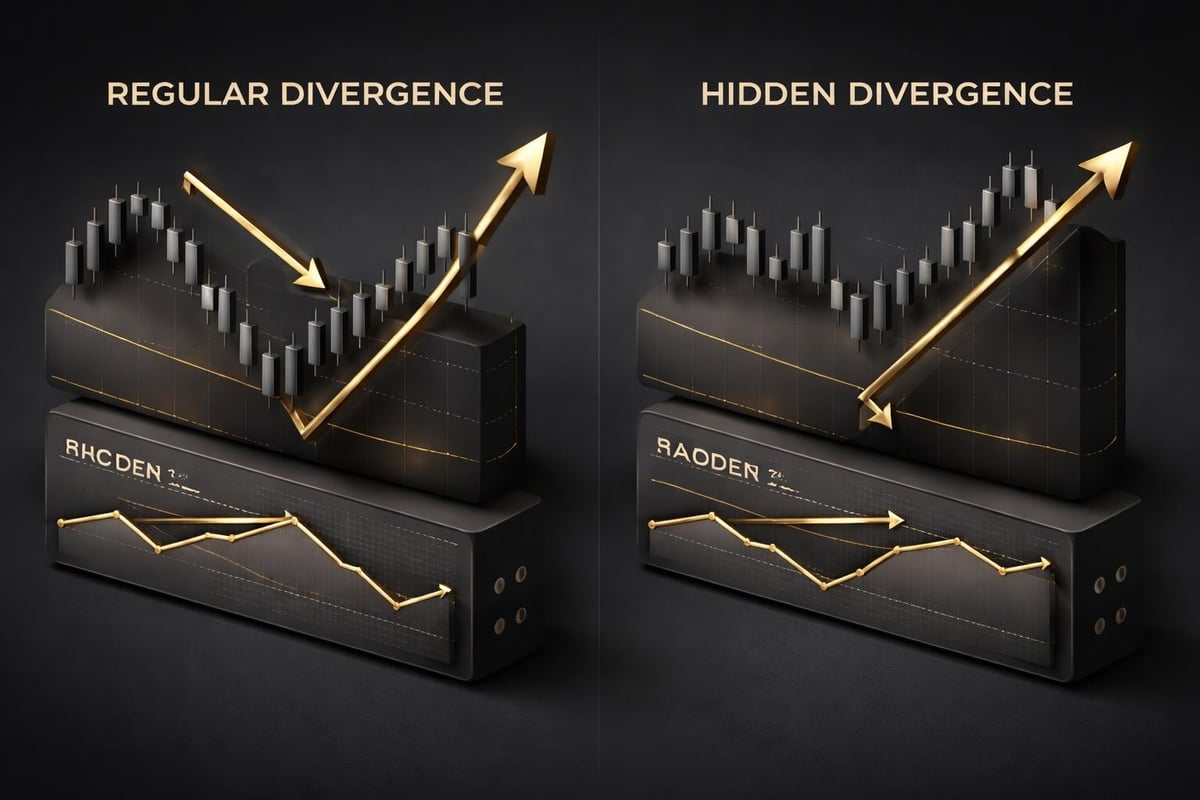
Regular divergence signals potential trend reversals. Price makes higher highs while your indicator makes lower highs – bearish regular divergence. Price makes lower lows while your indicator makes higher lows – bullish regular divergence. You spot this at trend extremes when momentum fades before price does.
Hidden divergence signals trend continuation. Price makes higher lows (uptrend) while your indicator makes lower lows – bullish hidden divergence suggesting the uptrend continues. Price makes lower highs (downtrend) while your indicator makes higher highs – bearish hidden divergence suggesting the downtrend continues. You use this to add to positions or re-enter after pullbacks.
The practical difference matters. Regular divergence says "this trend might end." Hidden divergence says "this pullback might end." You trade them differently. Regular divergence requires tight stops and conservative targets because you're counter-trending. Hidden divergence allows wider stops and larger targets because you're with the trend.
The MACD Convergence Divergence Framework
The Moving Average Convergence Divergence indicator combines convergence divergence concepts into one tool. The MACD line represents the difference between 12-period and 26-period exponential moving averages. The signal line is a 9-period EMA of the MACD line. The histogram shows the distance between them.
You're watching for three convergence divergence signals here. First, when the MACD line crosses the signal line, momentum shifts. Second, when the histogram expands or contracts, trend strength changes. Third, when price action diverges from MACD movement, you get reversal warnings.
Standard settings (12, 26, 9) work across Daily and H4 timeframes for swing positions. For day trading on H1 or M15, many traders tighten to (8, 17, 9) or (5, 13, 5) to catch momentum shifts faster. The tradeoff – tighter settings generate more signals but more noise.
Here's what matters: MACD convergence divergence works best when you use it for direction, not entries. MACD tells you if momentum favors longs or shorts. It doesn't tell you where institutional liquidity sits or which specific candle to enter. That's a separate decision.
Timeframe Alignment for Convergence Divergence Signals
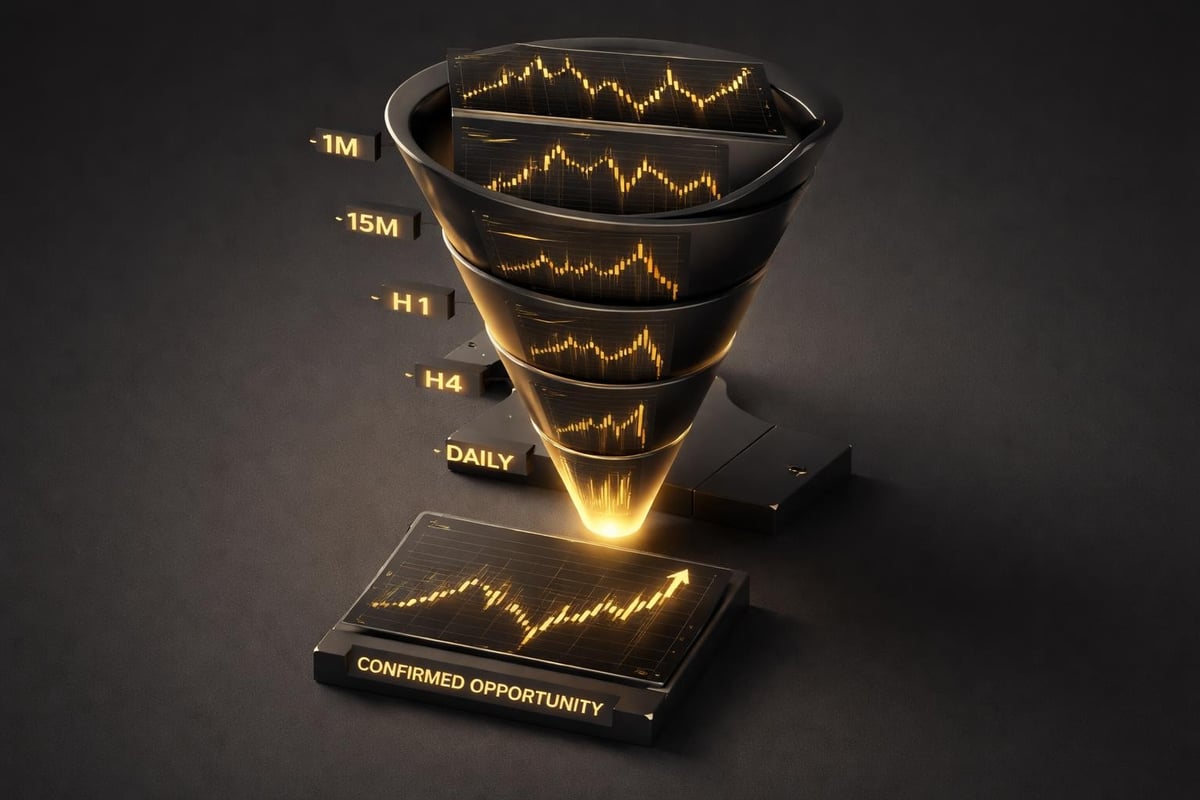
You need convergence across timeframes to trade divergence profitably. Here's the systematic approach. Check Daily for overall trend bias. If Daily MACD is above the signal line and histogram is expanding, you have bullish momentum. Drop to H4. If H4 shows bullish hidden divergence – price making higher lows while MACD makes lower lows during a pullback – you have continuation setup.
Now you have direction. You still need entry. Drop to H1 or M15 and wait for price to reach institutional levels – previous day high/low, VWAP, session open, or supply/demand zones. When price reaches those levels and your entry timeframe shows a confirming signal, you have a complete trade.
The mistake most traders make? They spot divergence on H1 and trade it immediately without checking if H4 and Daily agree. You get a 15-pip winner that reverses into a 40-pip loser because you traded against the higher timeframe trend.
| Timeframe | Role | Divergence Type | Action |
|---|---|---|---|
| Daily | Trend bias | Regular divergence warns of major reversals | Don't counter-trade established trends |
| H4/H8 | Swing structure | Hidden divergence confirms continuation | Align entries with this direction |
| H1 | Entry refinement | Divergence + price action | Wait for liquidity levels |
| M15/M5 | Precision timing | Confirmation only | Execute when higher timeframes align |
Trading Convergence Divergence with Non-Repainting Signals
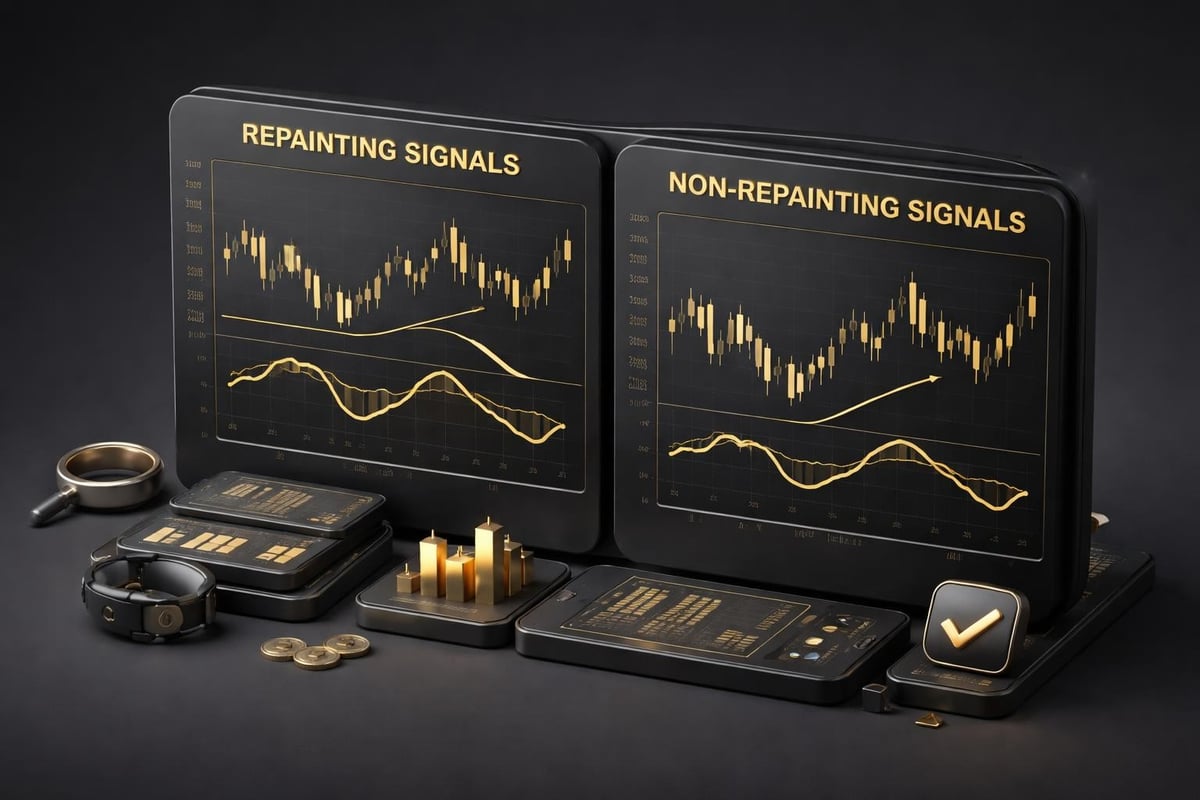
Most free divergence indicators repaint. They show you a perfect divergence signal two hours ago, but when you were trading live, that signal wasn't there. The indicator recalculates based on closed candles and "predicts" the past. You can't trade that.
You need signals that form after the candle closes. A non-repainting signal on H1 EUR/USD appears only when the H1 candle completes. If that candle shows bearish divergence at 1.0850 resistance and closes, the signal stays. It doesn't disappear when the next candle opens. Understanding divergences in technical analysis requires this distinction – confirmed signals versus predictive repaints.
The practical test: take a screenshot of your chart with signals showing. Wait three candles. Refresh your chart. Do the same signals appear in the same places? If they moved or disappeared, your indicator repaints. You can't build a systematic approach on shifting signals.
For prop firm traders, this becomes critical. Your funded account rules require consistent risk management and drawdown control. You can't afford to enter a divergence trade at 1.0850, watch price drop 20 pips, then have your signal disappear and tell you the trade was never valid. You need transparency – the signal was there or it wasn't.
Practical Convergence Divergence Setups Across Asset Classes
Forex pairs show clean convergence divergence patterns because of their trending nature. EUR/USD, GBP/USD, and USD/JPY respect divergence signals on H4 and Daily timeframes when combined with major support and resistance levels. Your target should match the average daily range – roughly 70-90 pips for EUR/USD, 100-130 pips for GBP/USD. Risk:reward ratios of 1:2 or 1:3 work because major pairs trend far enough to justify the wait.
Set your stop loss beyond the swing that created the divergence. If price made a higher high at 1.0850 and your oscillator made a lower high, your stop goes 10-15 pips above 1.0850. Your target goes to the previous swing low or a major support level. That might give you 30-pip risk for 60-90 pip target.
Crypto markets show exaggerated convergence divergence patterns due to volatility. BTC/USD and ETH/USD divergences on H8 or Daily often precede 5-10% moves. The challenge – false signals increase because crypto doesn't respect traditional technical levels the same way regulated Forex markets do. You need tighter confirmation. Don't trade divergence alone on crypto. Wait for a momentum candle break after divergence forms, then enter on the retest.
Indices like S&P 500, NASDAQ, and DAX respond to divergence during news events and session opens. Regular divergence before major economic releases (NFP, FOMC, CPI) warns you to tighten stops or stay flat. The best index divergence trades happen during trending sessions – 2 PM to 4 PM EST when US indices either continue morning trends or reverse. Hidden divergence during lunch pullbacks (12 PM to 2 PM EST) sets up continuation entries for the afternoon session.
Stock traders use divergence to time entries around earnings or sector rotation. A stock making new 52-week highs while RSI shows lower highs suggests the rally is exhausting. But stocks can maintain divergence for weeks during strong bull markets. You need volume confirmation – if volume drops as price makes new highs with divergence present, your reversal probability increases.
Combining Convergence Divergence with Session Liquidity Levels
Direction without precision entries burns capital. You spot perfect bearish divergence on EUR/USD H4 at 1.0850. You short immediately. Price rallies another 30 pips to 1.0880 before reversing. Your stop gets hit. The divergence was valid – your entry was early.
Institutional traders don't trade divergence signals – they trade levels. VWAP, previous day high/low (HOD/LOD), session opens, and supply/demand zones are where large orders sit. When convergence divergence signals align with these levels, your probability improves dramatically.
Here's the systematic process. Identify divergence on H4. Mark the price level where divergence formed – that's your alert zone, not your entry. Drop to H1 or M15. Identify the nearest institutional level below (for bearish divergence) or above (for bullish divergence). Wait for price to reach that level. When price touches the level and shows rejection (bearish pin bar, engulfing candle, or strong momentum close), then you enter.
Example: EUR/USD shows bearish divergence at 1.0850 on H4 at 10 AM EST. You don't short at 1.0850. You check where VWAP sits – let's say 1.0830. You check previous day high – 1.0855. Price rallies to 1.0855 (PDH), respects it with a bearish engulfing candle on M15. Now you short with a 15-pip stop above 1.0870, targeting 1.0800 (previous swing low). That's 15 pips risk for 55 pips reward – 1:3.67 risk:reward.
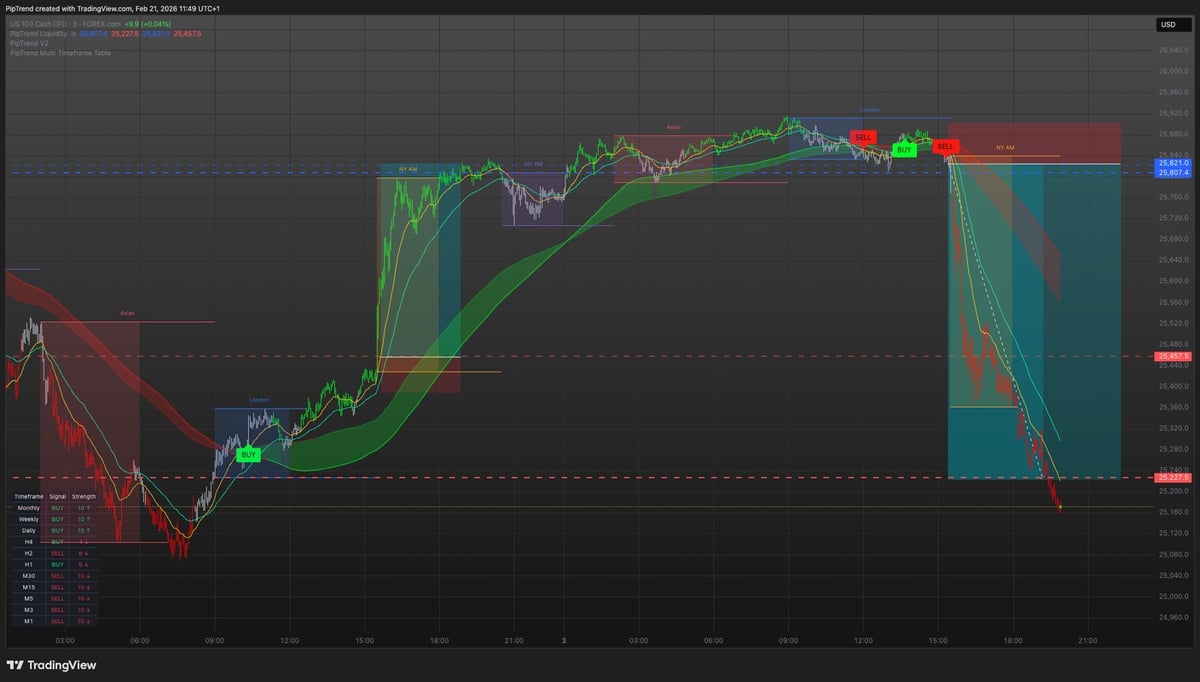
This is where a system like PipTrend solves the execution gap. You get directional signals from non-repainting BUY/SELL indicators, entry precision from Session Liquidity levels showing exactly where institutional orders sit, and trade management from a Multi-Timeframe Table showing all 12 timeframes at once. You're not guessing where VWAP is or manually calculating previous day levels – the system shows you. One glance tells you if your H1 divergence trade aligns with H4 and Daily direction.
Managing Divergence Trades with Multi-Timeframe Confirmation
You enter short at 1.0850 on bearish divergence. Price drops 20 pips to 1.0830. Do you hold for your 1.0800 target or take profit? You need a management system that removes emotion.
Use a multi-timeframe table showing 1m, 5m, 15m, 30m, H1, H2, H4, H8, H12, Daily, Weekly, and Monthly all at once. When you enter on H1 divergence, watch the 5m and 15m timeframes. If they flip bullish while you're in a short, price might retrace before continuing down. You either tighten your stop to breakeven or take partial profit.
If H4 remains bearish and Daily confirms your direction, hold for your full target. If H4 flips neutral or bullish, exit immediately regardless of your profit or loss. The higher timeframe disagreement means your divergence trade is losing probability.
Prop firm traders managing 5% max daily drawdown can't afford to hold divergence trades that flip against higher timeframes. You entered with H4 confirmation. H4 changes. You exit. Simple rule, repeated every trade.
Common Convergence Divergence Mistakes That Cost Pips
Trading divergence without price action confirmation kills accounts. You see divergence, you short. Price keeps rallying for 50 more pips because you ignored the fact that price was at mid-range with no resistance overhead. Wait for price to reach a decision point – support, resistance, trendline, or Fibonacci level – before acting on divergence.
Ignoring the trend is the second mistake. Bearish divergence in a strong uptrend on Daily just means a pullback is coming, not a reversal. Convergent and divergent trading strategies explains how market conditions determine which approach works. Counter-trending divergence trades require smaller position sizes and tighter stops.
Using divergence alone without volume reduces accuracy. Divergence with declining volume is stronger than divergence with increasing volume. If volume surges as price makes a new high but your oscillator makes a lower high, institutional money might still be entering. Wait for volume to confirm the weakness.
Overtrading lower timeframe divergence generates commissions, not profits. Divergence on 1m or 5m charts produces dozens of signals daily. Most fail. Stick to H1 and higher for divergence signals. Use lower timeframes only for entry refinement after higher timeframe divergence confirms.
Building a Systematic Convergence Divergence Process
Write down your rules. This removes discretion and emotion. Here's a tested framework you can adapt:
Step 1: Check Daily chart for trend bias using MACD or Stochastic. If Daily shows bullish momentum, you only trade bullish divergence (regular or hidden). You don't counter-trade the Daily trend.
Step 2: Drop to H4. Wait for divergence to form at a swing high or swing low. Mark the exact price level. Set an alert 10 pips before that level so you don't sit watching charts.
Step 3: When your alert triggers, drop to H1. Identify the nearest institutional liquidity level – VWAP, session open, previous day high/low, or supply/demand zone.
Step 4: Wait for price to reach that level. Confirm with a price action signal – pin bar, engulfing candle, or momentum break and retest.
Step 5: Enter with stop loss 10-15 pips beyond the swing that created divergence. Target the next major support or resistance level. Aim for minimum 1:2 risk:reward.
Step 6: Manage the trade using a multi-timeframe view. If the timeframe that gave you entry signal flips against you, tighten stop to breakeven. If the timeframe above (H4 if you entered on H1) flips against you, exit immediately.
Following divergence trading rules systematically means you apply the same process every time. You remove the "should I take this trade?" question because your system already answered it.
Adapting Convergence Divergence for Different Trading Styles
Day traders working M15 to H1 timeframes use divergence to time entries within the Daily trend. You check Daily bias at market open. Daily is bullish. You wait for bullish hidden divergence on H1 during the London or New York session. You enter at session lows targeting session highs. Your trades last 2-6 hours. You close everything before the session ends.
Swing traders working H4 to Daily timeframes use divergence to catch multi-day moves. You spot regular divergence on Daily at a major resistance level. You enter on H4 confirmation, targeting the next major support 200-400 pips away. Your stops are wider – 50-80 pips – but your targets justify the risk. Trades last 3-7 days.
Position traders working Daily to Weekly use divergence to time entries into long-term trends. Weekly bullish hidden divergence after a 3-week pullback in an uptrend signals re-entry for a months-long position. Your stops sit 150-250 pips away. Your targets are 800-1500 pips or more. You hold through short-term noise.
The convergence divergence concept scales across all timeframes. The rules stay the same. Only your position size, stop distance, and target distance change based on the timeframe you trade.
Measuring Success with Convergence Divergence Metrics
Track every divergence trade in a journal. Record the timeframe where divergence appeared, the price level, whether it was regular or hidden, the entry price, stop loss, target, and outcome. After 30 trades, calculate your win rate and average risk:reward.
A good divergence system produces 45-55% win rate with 1:2.5 or better risk:reward. That means you can lose more often than you win and still profit. If your win rate exceeds 60%, you're either getting lucky or your sample size is too small. If your win rate drops below 40%, you're either ignoring higher timeframe confirmation or entering without price action signals.
Your maximum drawdown should stay under 8% for swing trading and under 5% for day trading. If you hit 10% drawdown, stop trading divergence for a week. Review your last 20 trades. Find the pattern. Are you over-trading lower timeframes? Ignoring trend? Entering too early without liquidity level confirmation?
Professional traders know that convergence divergence is one tool in a complete system. It provides warnings and context. It doesn't replace risk management, position sizing, or trade psychology. You still need all three.
Convergence divergence signals trend weakness and continuation when you layer it across timeframes and combine it with institutional liquidity levels. The concept works – the execution separates profitable traders from those who recognize patterns but can't translate them into consistent results. PipTrend delivers that execution layer with non-repainting directional signals, precise entry points at liquidity levels, and 12-timeframe management in one unified system. Start your 3-day trial and see how systematic clarity replaces guesswork across every asset class you trade.