Buy-Side Liquidity Explained: A Trader's Guide to Highs
On this page
What Traders Mean by Buy-Side Liquidity
Here’s the mistake almost every trader makes on their first pass through Smart Money Concepts: they see a high labeled “buy-side liquidity” and read it as bullish.
Buy orders sit up there, so price must want to go up, right?
Not even close.
The label describes where resting buy orders cluster, not the direction price will take once it gets there.
That single confusion produces more bad entries than almost any other idea in retail trading. A trader marks a swing high, watches price spike through it, buys the breakout, and gets stopped out ninety seconds later when the market reverses hard.
This guide separates two things that usually get blended together.
On one side, the chart-labeling vocabulary of ICT trading and Smart Money Concepts: pools, sweeps, stop runs, liquidity grabs. On the other, actual market microstructure as institutions define it, where the Bank for International Settlements breaks liquidity into four measurable dimensions: tightness (the bid-ask spread), depth (volume available at each price), resiliency (how fast the book refills after a large order), and immediacy (how quickly a trade can be executed).
Both frameworks matter.
One gives you a language for marking charts. The other tells you what is physically happening when your stop gets triggered.
What you’ll walk away with: an objective method for marking levels, a way to judge whether a move through a high was a sweep or a genuine breakout, and a confirmation workflow that stops you from following signals blindly.
The Mechanics Behind the Term
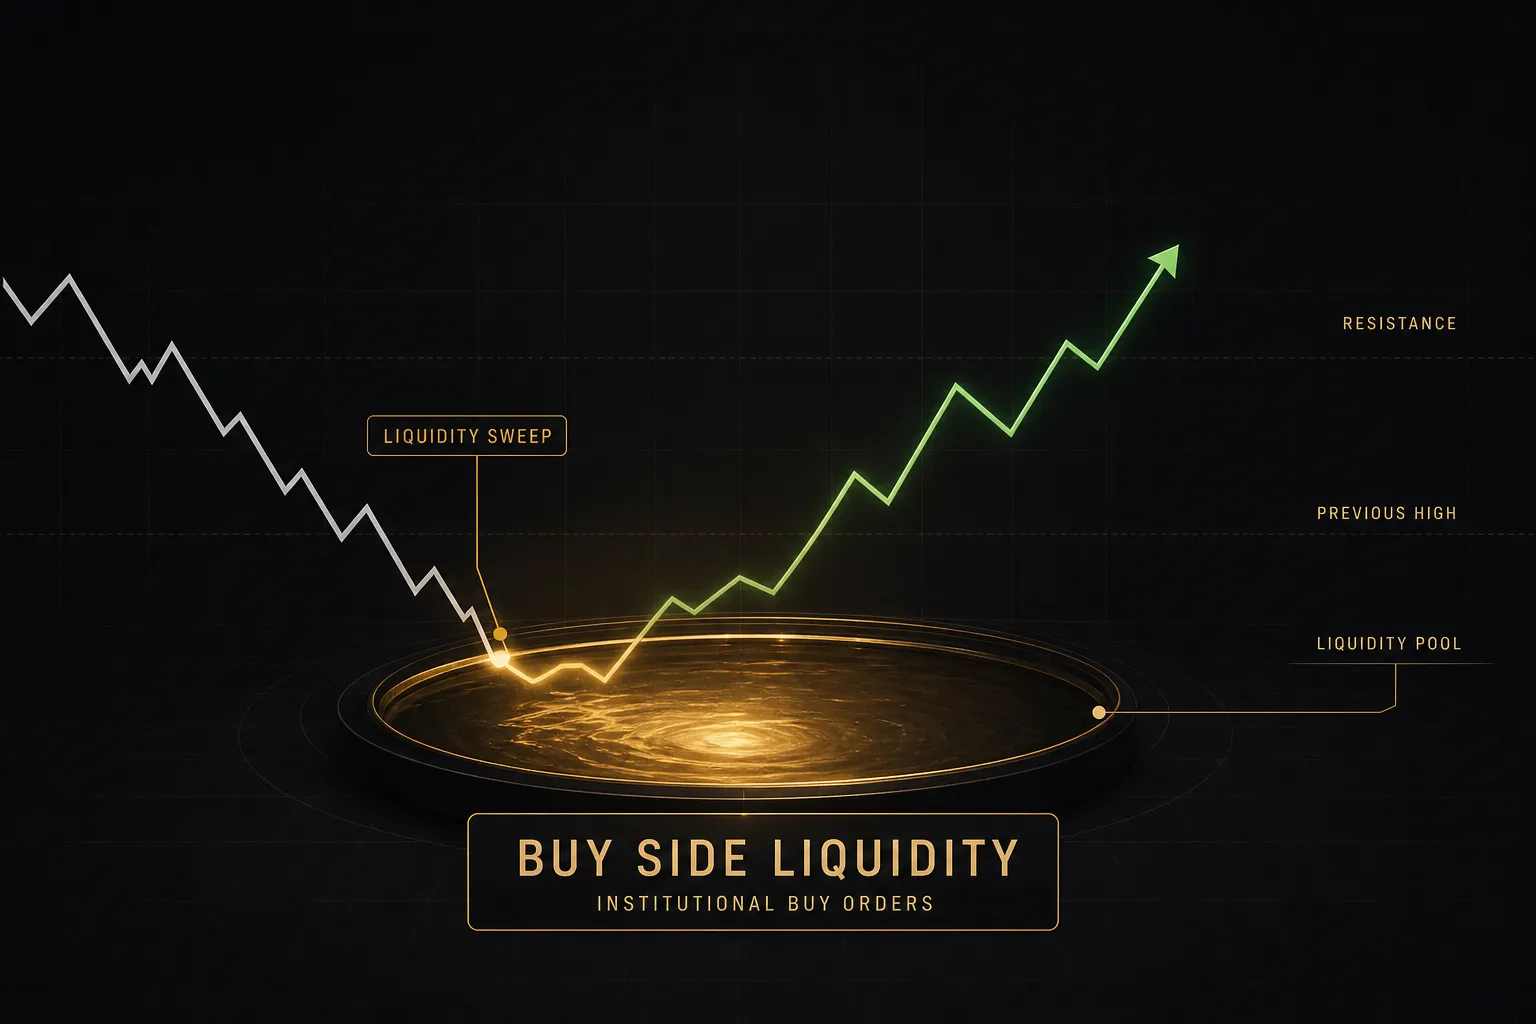
Strip away the jargon and buy-side liquidity is a bookkeeping fact. Above the current price, somewhere in the order book and in brokers’ conditional order queues, sit orders that will execute as buys when price reaches them.
That’s it.
No intent, no prophecy, no institutional conspiracy baked into the definition.
Why It Sits Above Price
Buy orders that trigger automatically live above the market for a simple structural reason: a buy stop only makes sense if price rises to it.
Two populations create them.
Breakout traders place buy stops above resistance because they want in if the level breaks. Short sellers place protective buy stops above their entries because that’s where their thesis dies.
Both groups, for entirely different reasons, end up parking buy orders in the same neighborhood: just above an obvious high.
The concentration is what makes the level interesting.
Traders don’t scatter stops randomly. They cluster them a few pips above the most visible high on the chart, because that’s the level everyone can see.
The Orders That Make Up the Pool
A liquidity pool above price is typically a mix of:
- Breakout buy stops from traders waiting to enter long on a confirmed break of a swing high.
- Short sellers’ stop-loss orders protecting positions opened at or below that high.
- Buy limit orders from sellers taking profit on short positions at predetermined targets.
- Algorithmic execution orders that reference the same technical level as a trigger.
The mechanics of what happens when they fire matter enormously, and most retail traders get this wrong.
According to guidance from Investor.gov and FINRA, a stop order becomes a market order the moment it triggers.
It does not guarantee your price.
In fast-moving conditions, that market order can fill meaningfully away from the stop level.
A cluster of stop orders isn’t a wall of buyers waiting patiently. It’s a queue of market orders that all fire at once, consuming whatever sell-side depth exists above the level. That’s why price often accelerates through a high before doing anything else.
Now, the contested part.
The Smart Money Concepts narrative says institutions deliberately drive price into these clusters to “hunt stops” and fill large orders against the resulting flow.
What’s documented is narrower: order clustering at obvious technical levels is observable and well studied, and price does frequently behave differently on either side of those levels. Whether any single move was an intentional hunt or simply the mechanical result of stops firing into thin depth is not something a retail chart can prove.
Treat the narrative as a useful model.
Not as fact.
Buy-Side vs Sell-Side Liquidity
The mirror image sits below price. Sell-side liquidity consists of sell stops resting under lows: stop-losses from long positions and breakout entries from traders shorting a break of support.
The naming trips people up constantly, so anchor it this way. The label describes the order type that will execute, not the market direction it implies.
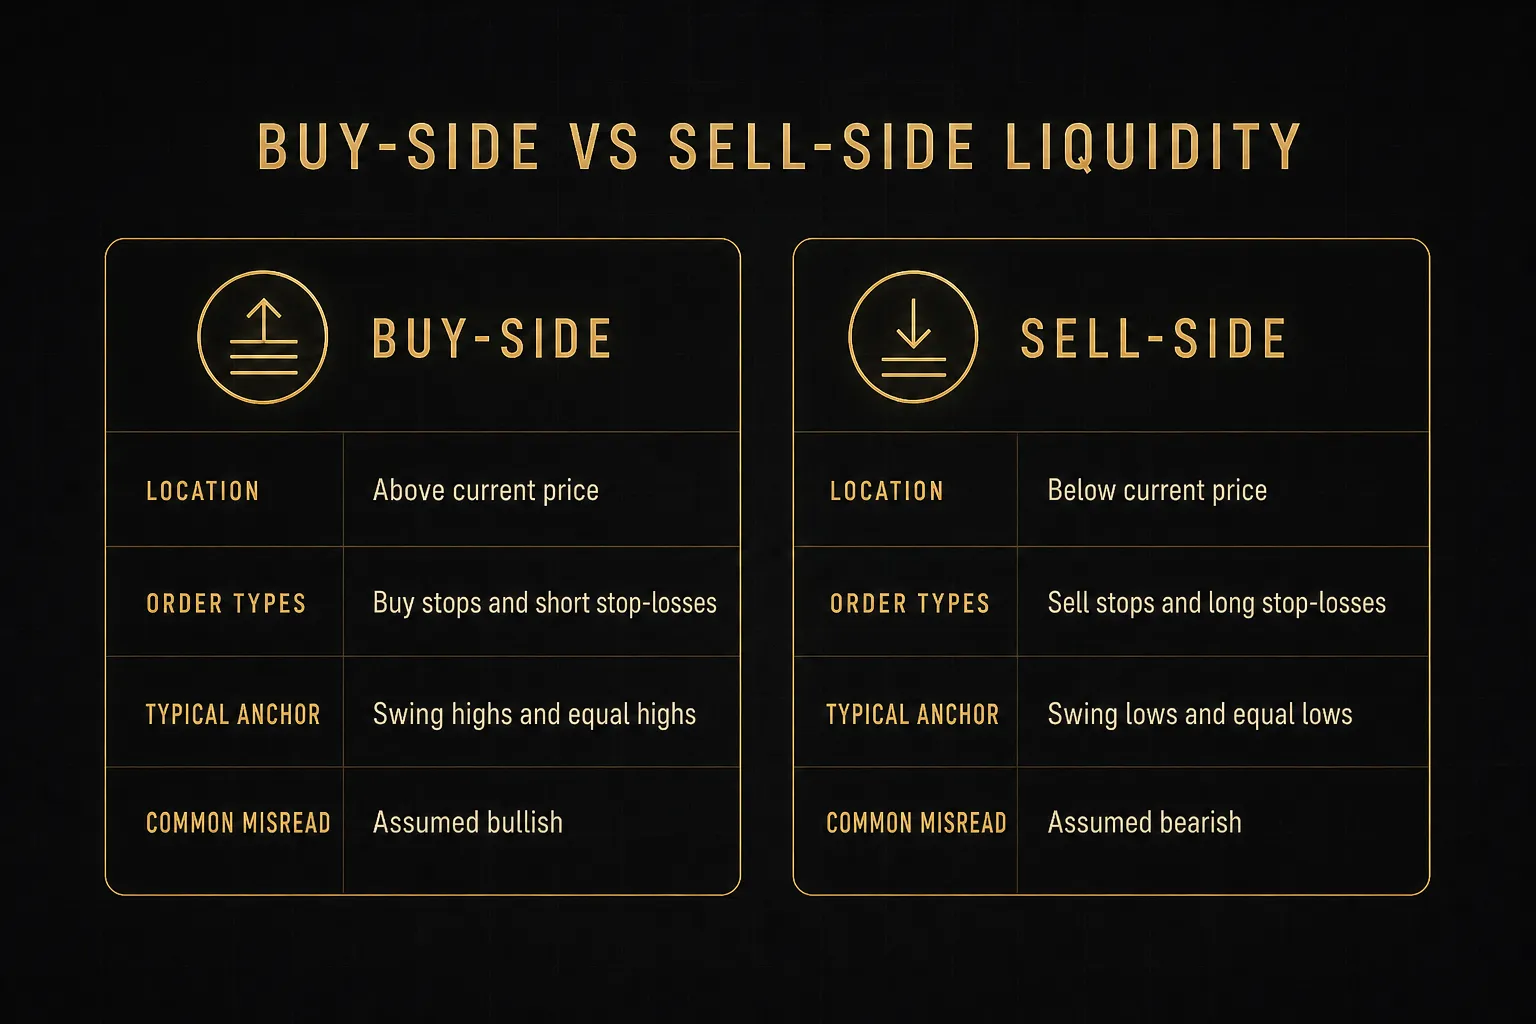
Above price, buy-side. Below price, sell-side.
Direction is a separate question entirely.
Where the Pools Actually Sit
Not every high is worth marking. If you plot every minor wick on a 5-minute chart, you’ll end up with a chart so cluttered it tells you nothing.
The useful distinction is between liquidity that sits at the outer edges of price action and liquidity trapped inside a range.
External vs Internal Liquidity
External liquidity refers to major reference highs that define the outer boundary of a move: a significant swing high, the previous day high, the previous week high, or a multi-week range top. These are the levels visible to the widest audience, which is exactly why orders pile up there.
Internal liquidity sits inside the range. The classic example is equal highs: two or more highs that terminate at nearly the same price during a consolidation.
Why do equal highs matter so much?
Because each failed test teaches the market where the ceiling is. Traders who shorted the first rejection place stops just above it. Traders who shorted the second rejection do the same.
The orders stack at one price, layer on layer.
By the third test, that flat top is one of the densest order clusters on the chart. It is also one of the most likely to be taken out, because dense clusters are efficient targets for anyone needing to fill size.
Ranking Levels by Importance
Rank levels by five factors: how obvious the level is to the average trader, how many touches it has, the timeframe it formed on, whether the session context supports activity there, and whether it remains untaken.
An untaken previous week high on a quiet Tuesday afternoon carries different weight than the same level at the London open.
Session context changes everything.
| Reference Level | Type | Typical Order Density | Session Relevance | Priority Score |
|---|---|---|---|---|
| Previous week high | External | Very high | Strongest Monday to Wednesday | 9/10 |
| Previous day high | External | High | Targeted most often at London and New York opens | 8/10 |
| Multi-touch equal highs (3+ tests) | Internal | Very high | Any session; often swept on news | 8/10 |
| Daily swing high (untaken) | External | High | Relevant across all sessions | 8/10 |
| London session high | External | Moderate to high | Primary target during New York overlap | 7/10 |
| Asian session high | External | Moderate | Frequently swept in first 90 minutes of London | 6/10 |
| Two equal highs on 15m | Internal | Moderate | Best within an established range | 5/10 |
| Minor 5m wick high | Internal | Low | Noise outside of scalping context | 2/10 |
A practical rule: if a level requires you to squint, it isn’t liquidity.
It’s a wick.
Session liquidity deserves its own note. The Asian range is typically narrow, which makes its high a compact, well-defined cluster.
London open frequently runs it.
That pattern is common enough to plan around, but it is a tendency, not a law, and it fails often enough to require confirmation.
Sweep, Grab, or Real Breakout?
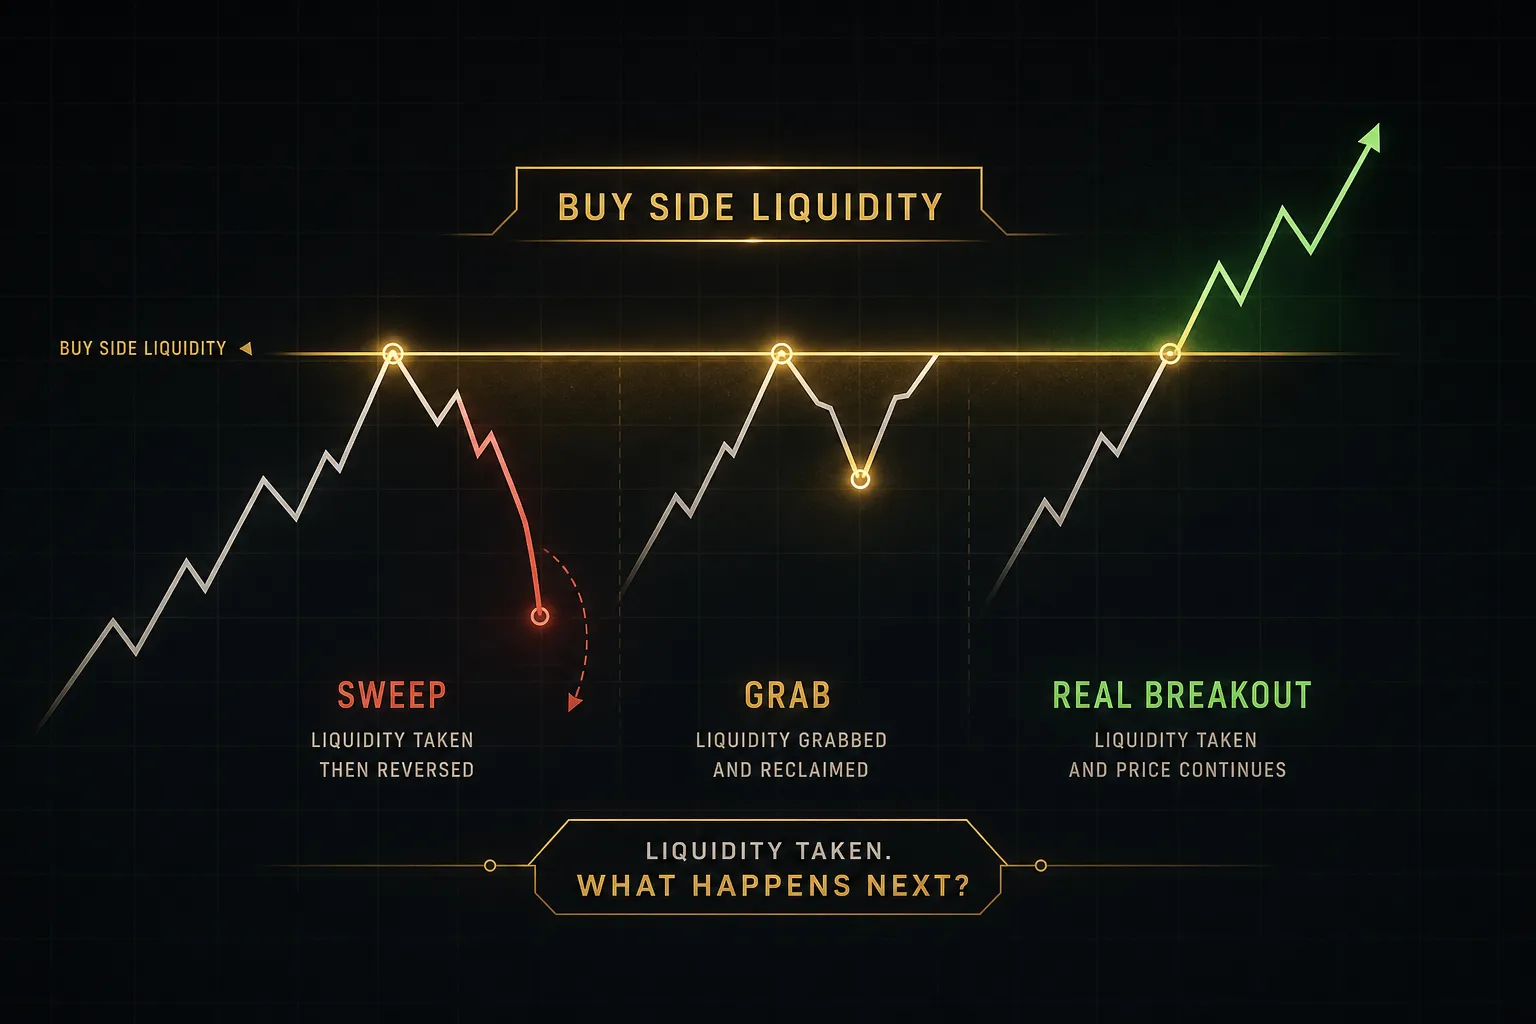
Ask five traders to define a “liquidity sweep” and you’ll get five answers, three of which describe a breakout. The vocabulary has become sloppy, and sloppy vocabulary produces sloppy decisions.
Separate the terms first.
Then the decision-making gets easier.
The Liquidity Event Lifecycle
These are distinct events, not synonyms:
- Liquidity pool: the resting cluster of buy orders above a high. A location. Nothing has happened yet.
- Liquidity sweep: price trades above the level, triggers the orders, and then closes back below it, usually within one to three candles on the timeframe you’re watching. The defining feature is rejection.
- Liquidity grab: functionally similar to a sweep, but typically used to describe a faster, more violent single-candle spike followed by immediate reversal. Same mechanics, sharper expression.
- Stop run: a directional push specifically through a known stop cluster, often extending through several minor levels in sequence. A stop run can precede either a reversal or continuation.
- Breakout: price trades above the level and accepts there, meaning it closes above and builds new candles above rather than snapping back.
- Continuation: after acceptance, price uses the old high as support and extends the trend. The liquidity that was taken becomes fuel for the next leg.
The critical insight most SMC content skips: a sweep does not guarantee a reversal. The correct mental framework is acceptance versus rejection.
Acceptance means price is comfortable above the level.
Rejection means it isn’t.
Both are legitimate outcomes, and you cannot know which one you’re getting from the wick alone.
Trending vs Ranging Context
Context does more predictive work than the sweep itself.
- In a strong uptrend, highs get taken and price keeps going. Treating every taken high as a reversal signal in a trending market is how traders spend a week fighting a move that never stops.
- In a defined range, sweeps of the range high have far better odds of producing rotation back toward the opposite side, because there’s no directional pressure sustaining the break.
- At a higher-timeframe external level after an extended run, a sweep carries the most reversal weight, because the market has reached the boundary of a larger structure with less room ahead.
- During low-liquidity hours, such as the late Asian session or the Friday New York close, sweeps become unreliable in both directions. Thin depth exaggerates every move.
What to Watch After the Sweep
Don’t enter on the first wick.
Work through a sequence instead:
- Rejection wick: did price close back below the level on the candle that took it, leaving an upper wick disproportionate to the body? A close above the high is not a sweep.
- Displacement: did a decisive, larger-than-average candle move away from the level in the opposite direction? Displacement suggests genuine flow, not just an absence of buyers.
- Market structure shift: on your execution timeframe, did price break the most recent higher low? A market structure shift is the first objective evidence that control has changed hands.
- Retest: did price return to the origin of the displacement and hold? A retest entry gives you a tighter stop and a defined invalidation, at the cost of missing some moves entirely.
Four distortions will make sweeps look better or worse than they were.
Widening spread during rollover or news can push price through a level without meaningful volume behind it. Slippage means stop fills print at prices that never appear as tradeable liquidity.
Session volatility shifts the size of a “normal” wick by a factor of two or three across the trading day. And scheduled news can produce a spike through a high that has nothing to do with order clustering and everything to do with a data surprise.
Check the economic calendar before you interpret a wick as a stop run.
It saves a surprising number of bad trades.
Building a Repeatable Confirmation Workflow
Concepts are cheap.
A process you can run identically on Monday morning and Thursday afternoon is what separates a framework from a collection of chart labels.
Here’s a workflow that combines higher-timeframe targeting with lower-timeframe execution, without letting five-minute noise override the daily picture.
Marking the Chart Step by Step
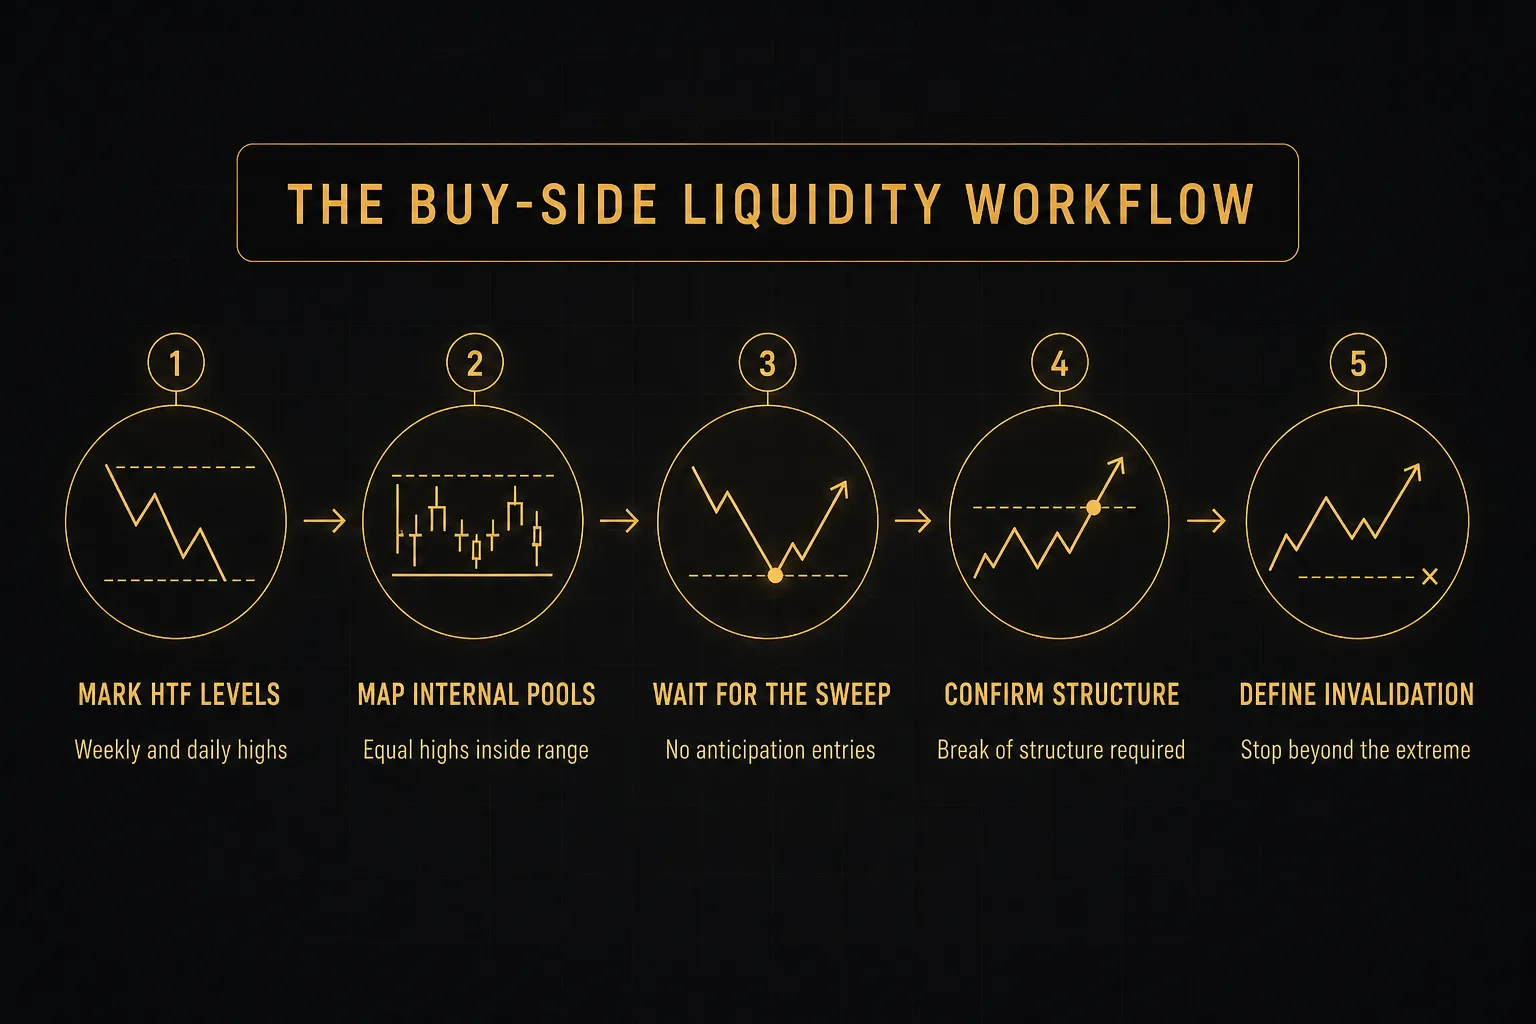
- Mark higher-timeframe external liquidity. On the daily and 4-hour charts, draw horizontal lines at the previous week high, previous day high, and the nearest untaken swing high. These are your directional targets, not your entries.
- Identify internal equal highs. Drop to the 1-hour and 15-minute charts and mark any clusters of equal highs inside the current range. Note how many touches each has; three or more is significant.
- Add session levels. Plot the Asian session high and the London session high. These give you intraday reference points that update daily and often act as the first target of a new session.
- Establish directional bias. Ask a single question of the higher timeframe: is structure making higher highs and higher lows, or is price rotating inside a range? Write the answer down before you look at anything smaller.
- Wait for the sweep. Do nothing until price actually trades through a marked level. Anticipating sweeps is how traders end up short into a trend for three consecutive days.
- Require structure confirmation. After the sweep, demand a break of structure or a market structure shift on your execution timeframe (typically 5-minute or 15-minute). No shift, no trade.
- Define invalidation before entry. Your stop goes beyond the sweep’s extreme, not at an arbitrary pip distance. If that stop makes the risk-reward unworkable, the trade doesn’t exist.
- Target the opposite liquidity. Take profit at the nearest opposing pool: sell-side liquidity below a recent low, or the mid-range if you’re trading a rotation.
Using Indicators as Confluence, Not Triggers
An indicator should answer one question: does this agree with what I already concluded from structure? If it’s generating your idea rather than checking it, the hierarchy is backwards.
A multi-timeframe trend table, like the one in PipTrend, is useful here in a specific way. After a sweep of a previous day high, you can check whether the 1-hour and 4-hour trend readings have flipped against the prevailing direction, which either supports or contradicts the reversal thesis you formed from structure.
Automatically plotted session high and low levels serve a similar role, marking the Asian and London extremes so you’re not eyeballing them at 8am.
Fast, consistent, less prone to the small errors that creep in when you draw levels manually.
But secondary means secondary.
A trend table flipping bearish is not permission to short a level that never produced a market structure shift.
Finally, journal the things that actually improve the workflow. Track sweep frequency per level type, the quality of confirmation you accepted, average favorable excursion after entry, and your false-breakout rate.
After sixty to eighty logged events, patterns emerge that no amount of reading produces. You’ll discover, for instance, that your London-session sweeps convert at double the rate of your Asian-session ones… which changes how you allocate risk immediately.
Common Questions About Buy-Side Liquidity
What does buy-side liquidity mean in forex?
Buy-side liquidity in forex refers to clusters of resting buy orders sitting above the current price, primarily buy stops from breakout traders and stop-loss orders from short sellers.
The term describes the location and order type, not a bullish forecast.
In forex specifically, these pools form around highly visible levels such as the previous day high, previous week high, and session highs, because the market is decentralized and traders across venues watch the same reference points.
What is the difference between buy-side and sell-side liquidity?
Buy-side liquidity sits above price and consists of buy orders; sell-side liquidity sits below price and consists of sell orders.
Buy-side pools are built from breakout buy stops and short sellers’ stop-losses above highs. Sell-side pools are built from breakdown sell stops and long traders’ stop-losses below lows.
The naming reflects which order type will execute when price arrives, nothing more.
Where is buy-side liquidity located?
Buy-side liquidity concentrates just above obvious highs: major swing highs, equal highs inside a consolidation, the previous day and previous week high, and session highs from the Asian and London ranges.
Density increases with the number of times a level has been tested and rejected.
A flat top tested three times typically holds more resting orders than a single sharp wick high on the same timeframe.
What happens after buy-side liquidity is taken?
Two outcomes are equally valid: rejection or acceptance.
Price may spike above the level, trigger the stops, and reverse sharply back below it, which is the classic sweep. Or it may close above and build new candles there, turning the old high into support and continuing higher.
Acceptance above a level is not a failure of the concept; it is simply the other half of it.
Is buy-side liquidity bullish or bearish?
Neither.
Buy-side liquidity is a location, not a directional signal.
The bias comes from context: an uptrend sweeping highs on the way up favors continuation, while a sweep of an untaken high after an extended run into a higher-timeframe resistance zone favors rejection.
Assign direction from market structure and trend context, then use the level as a target or trigger point.
How do you identify liquidity sweeps on a chart?
Look for price trading above a marked high and closing back below it, leaving a pronounced upper wick, followed by displacement in the opposite direction.
Genuine sweeps usually resolve within one to three candles on the timeframe you’re analyzing.
Keep in mind the limitation: chart analysis estimates where orders are likely clustered based on visible price history.
It cannot reveal the actual order book, which in forex is fragmented across dozens of venues and liquidity providers.
Trade the Level, Not the Story
Buy-side liquidity is a coordinate on a chart. It tells you where orders probably rest and where price has a reason to travel.
It does not tell you what happens when price gets there.
The traders who use the concept well treat it as a filter for attention, not a signal generator. They mark levels, wait, and let structure decide.
One thing to do before your next trade: mark the nearest untaken high on your higher timeframe.
If price sweeps it, do nothing until you see a market structure shift on your execution timeframe.
Only then check whether your indicator agrees, and only as the final filter.
The mindset shift is small but it changes everything.
Every high is a hypothesis, not an instruction.
Price arriving there is the start of the question, not the answer.
Let the market show you which side of the level it wants to live on, then trade what it shows you.
Sources
Risk Disclaimer: Trading involves risk. Past performance doesn't guarantee future results. Only trade with money you can afford to lose. PipTrend is a tool to assist your trading decisions, not financial advice.