Swing Trading Explained: A Beginner's Complete Guide
On this page
Most new traders discover swing trading the same way: they try day trading, lose sleep and money, and then hear there’s a slower version where you don’t stare at a five-minute chart all afternoon.
That version exists.
It’s just not easier.
What Swing Trading Really Means
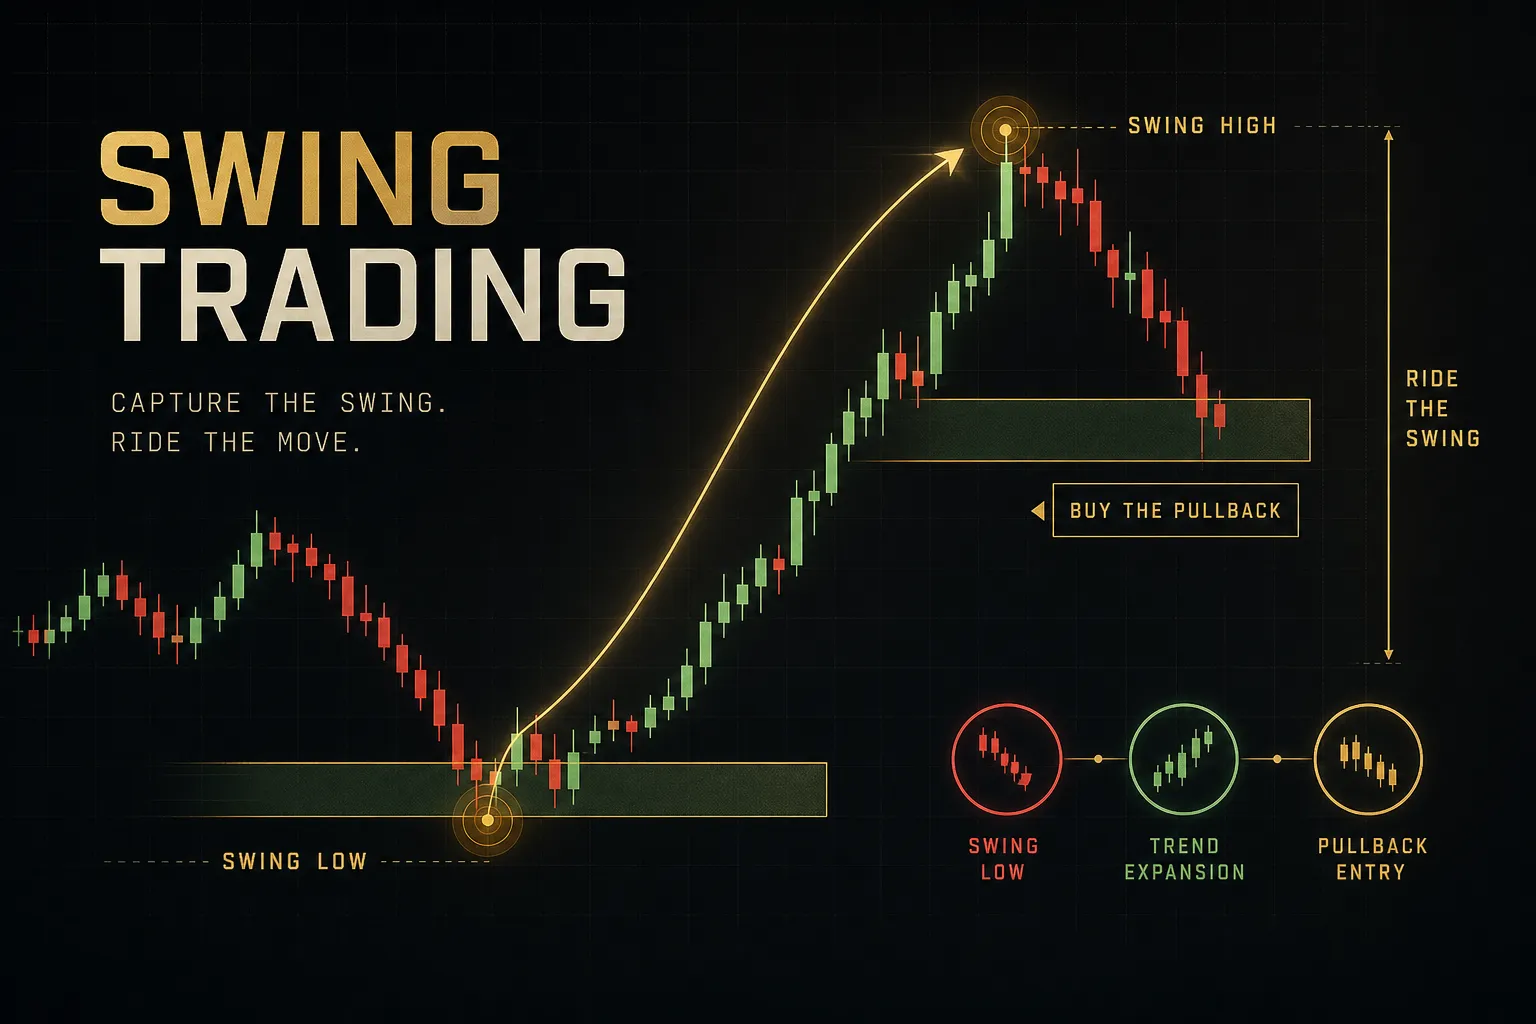
Swing trading is holding a position for roughly two or three days up to several weeks, aiming to capture one price swing inside a larger trend.
You’re not predicting where a stock will be in 2030. You’re trying to catch the move from one recognizable point in market structure to the next.
Compare the three main styles and the differences get clear fast.
A day trader opens and closes everything before the bell, carrying zero overnight exposure. A long-term investor holds for months or years and ignores most of what happens in between.
The swing trader sits in the middle, which brings a specific trade-off: fewer decisions per day, but real overnight risk on every open position.
That trade-off is why “swing trading is safer than day trading” is a misconception worth killing early.
You get more time to think and fewer commissions.
You also get gap risk, earnings surprises, and weekend headlines that no stop-loss can protect against.
This guide covers the entire workflow, not a list of favorite indicators.
Watchlist construction, entry triggers, invalidation levels, position sizing, exit rules, and post-trade review.
The indicator you use matters far less than whether those six pieces exist in writing.
A signal tells you something happened. A setup tells you what to do, how much to risk, and when you’re wrong. Beginners collect signals. Traders build setups.
Is Swing Trading Right for You
Swing Trading vs Day Trading
There’s a regulatory reason swing trading appeals to smaller US accounts. Under FINRA rules, a pattern day trader is someone who executes four or more day trades within five business days in a margin account, and that designation requires maintaining $25,000 in equity.
A day trade means buying and selling the same security on the same day. Positions held overnight generally don’t count toward that tally.
So a $2,000 account can swing trade legally while the same account would be frozen out of active day trading.
That’s a structural advantage, not a license to trade recklessly.
The rule limits your trade frequency, not your ability to lose money.
Time, Capital, and Skill You Actually Need
Forget the magic starting number.
Your minimum capital comes from position sizing math, not from a round figure someone posted online.
If your rules say risk 1% per trade and your typical stop distance is 5% of the share price, a $500 account can only risk $5, which forces awkwardly tiny positions where commissions and spread eat the edge. Realistically, most beginners start somewhere between a few hundred and a few thousand dollars, and the smaller the account, the more you should treat it as tuition rather than income.
The time commitment is where expectations break down.
“A few minutes a day” is marketing copy.
Here’s the honest weekly load:
- Weekend preparation (60 to 120 minutes): review the week’s market regime, refresh your watchlist, mark support and resistance levels, and check the earnings calendar for anything you hold or want to hold.
- Daily scanning (15 to 30 minutes): run your filters after the close when the daily candle is final, not mid-session when the chart is still moving.
- Trade management (10 to 20 minutes daily): adjust stops, check whether an open position still meets your thesis, and set alerts instead of watching live.
- Journaling (5 minutes per trade): log entry reason, invalidation level, size, outcome, and one sentence on execution quality.
- Monthly review (60 minutes): calculate expectancy, average win versus average loss, and drawdown across your last batch of trades.
Call it four to six hours a week done properly. Less than day trading demands, but not nothing.
The skill progression matters more than the hours.
Learn one rule set, test it on historical charts, then simulate execution in a paper account with realistic fills. Trade small live size next, because paper trading teaches mechanics but not the feeling of a real drawdown.
Only scale after you have evidence of consistency across a meaningful sample, which means 50 to 100 trades, not five good weeks.
A Complete Swing Trade, Start to Finish
Building a Watchlist That Isn’t Noise
The worst watchlist is the one built from social media mentions. The best one is built from filters you can state numerically.
Filter for liquidity first, since a great setup in a thin stock is a trap. A common floor is at least 500,000 to 1,000,000 shares of average daily volume and a tight bid-ask spread.
Then filter for volatility using average true range, because a stock that moves 0.5% a day can’t deliver a multi-day swing worth the risk.
Add relative strength against the sector or index, trend structure (higher highs and higher lows for longs), and a catalyst check so you’re not blindsided by an earnings date two days after entry.
From Signal to Full Trade Setup
A signal is one input.
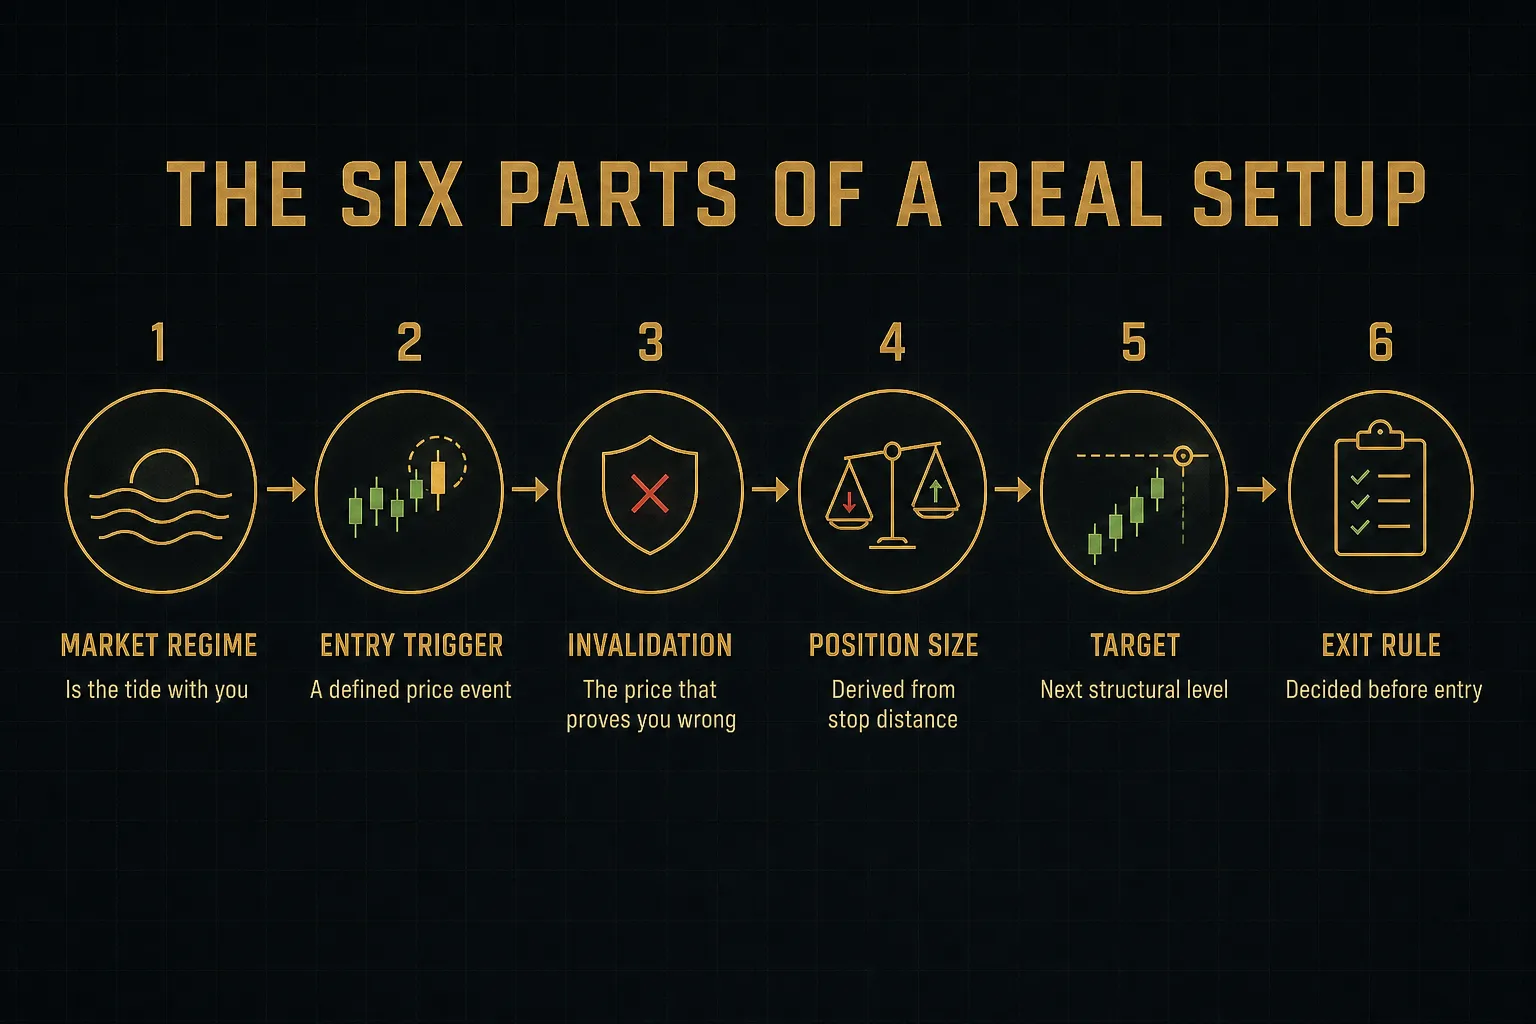
A complete setup has six components: market regime, entry trigger, invalidation level, position size, target, and exit plan. Miss any one of them and you’re improvising with real money.
Notice that entries anchored to a marked price level tend to be far more precise than entries taken from an indicator crossing. Support and resistance, prior swing highs, VWAP, and supply or demand zones give you a specific price to act at and a specific price that proves you wrong.
An RSI reading gives you neither.
- Confirm the market regime. Check the index and sector on the weekly and daily charts. Buying breakouts during a broad downtrend is the single most common way beginners donate money to the market.
- Confirm the trend context on the higher timeframe. Use the weekly chart for direction and the daily for structure. If the two disagree, you either skip the trade or halve your size.
- Mark your levels before the trade exists. Draw support, resistance, and the prior swing points on a clean chart. Levels drawn after you want to enter are rationalizations, not analysis.
- Wait for the entry trigger at your defined level. That might be a pullback holding the 20-day moving average, a breakout above a marked resistance with volume confirmation, or a reversal candle inside a demand zone. No trigger, no trade.
- Set the stop at the invalidation point. Ask what price proves the setup wrong, then place your stop just beyond it. Do not place stops based on the dollar amount you’re comfortable losing.
- Size the position from your risk percentage. Account equity times risk percent, divided by the distance from entry to stop. The stop dictates the size, never the reverse.
- Define the target and the exit rule. Identify the next structural level as your target and require a minimum risk-to-reward ratio, commonly 2:1. Decide in advance whether you’ll scale out, trail the stop, or exit at a fixed level.
- Check the calendar and place the order. Confirm no earnings, dividend, or major macro event lands inside your expected hold, then execute with a limit order at your level.
- Manage without meddling. Set price alerts, move the stop only in your favor and only at predefined points, and resist adjusting targets because the position feels good.
- Log the trade immediately. Record the setup type, level, size, R multiple, and one honest note on whether you followed your own rules.
Markets, Timeframes, and Indicators
Best Timeframes for Swing Entries
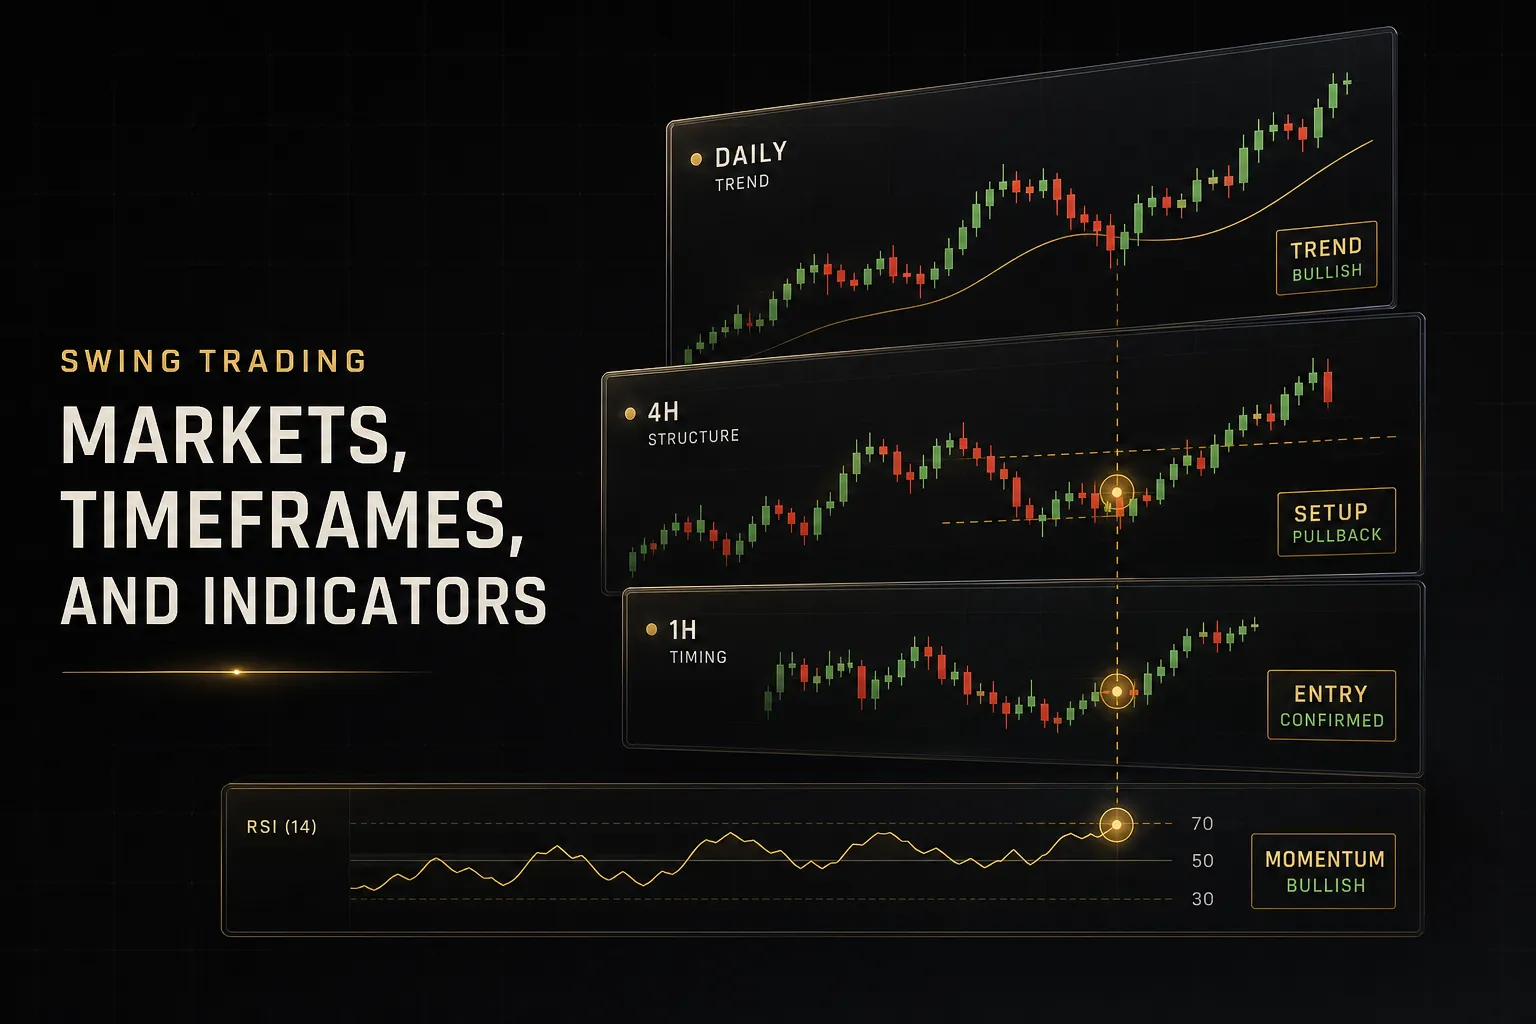
The daily chart is the primary swing trading timeframe, and the 4-hour chart is a close second for markets that trade around the clock. Daily candles filter out intraday noise while still producing enough setups to stay busy.
Use the weekly chart for trend context, since it tells you whether you’re trading with or against the dominant flow. Drop to the hourly for entry timing only, tightening your entry price without changing your thesis.
That’s multi-timeframe analysis in practice: weekly for direction, daily for structure and setup, hourly for execution.
Three timeframes. Not eight.
Comparing Stocks, Forex, Crypto, and Futures
Each market punishes different mistakes. Gap risk destroys careless stock traders, leverage destroys careless forex traders, and funding costs quietly bleed careless crypto traders.
| Factor | US Stocks | Forex | Crypto | Futures |
|---|---|---|---|---|
| Trading hours | 9:30am to 4:00pm ET, plus limited extended hours | 24 hours, 5 days a week | 24/7, no close | Nearly 24 hours with daily maintenance breaks |
| Typical leverage | 2:1 overnight on margin accounts | Up to 50:1 on major pairs for US retail | Varies widely by venue and jurisdiction | Built into contract size, often 10:1 or higher effective |
| Liquidity | Excellent in large caps, poor in micro caps | Deepest market globally in majors | Strong in majors, thin in small altcoins | Excellent in front-month index and energy contracts |
| Overnight or carry cost | Margin interest on borrowed funds | Swap or rollover, can be positive or negative | Perpetual funding rates paid every few hours | No financing charge, but contracts expire and must be rolled |
| Gap behavior | Frequent overnight and weekend gaps, especially on earnings | Small Sunday open gaps in most conditions | Rare gaps but violent 10%+ intraday moves | Modest gaps thanks to near-continuous sessions |
| Main beginner hazard | Holding through an earnings report | Oversizing because leverage is available | Volatility exceeding stop distance assumptions | Contract size making 1% risk impossible on a small account |
For most beginners, liquid US stocks or major forex pairs on the daily chart are the sane starting point. Futures contract sizes make proper position sizing nearly impossible below several thousand dollars.
Using Indicators as Support, Not Signals
Here’s the trap nobody warns you about: stacking indicators that measure the same thing feels like confirmation but is actually one opinion repeated four times.
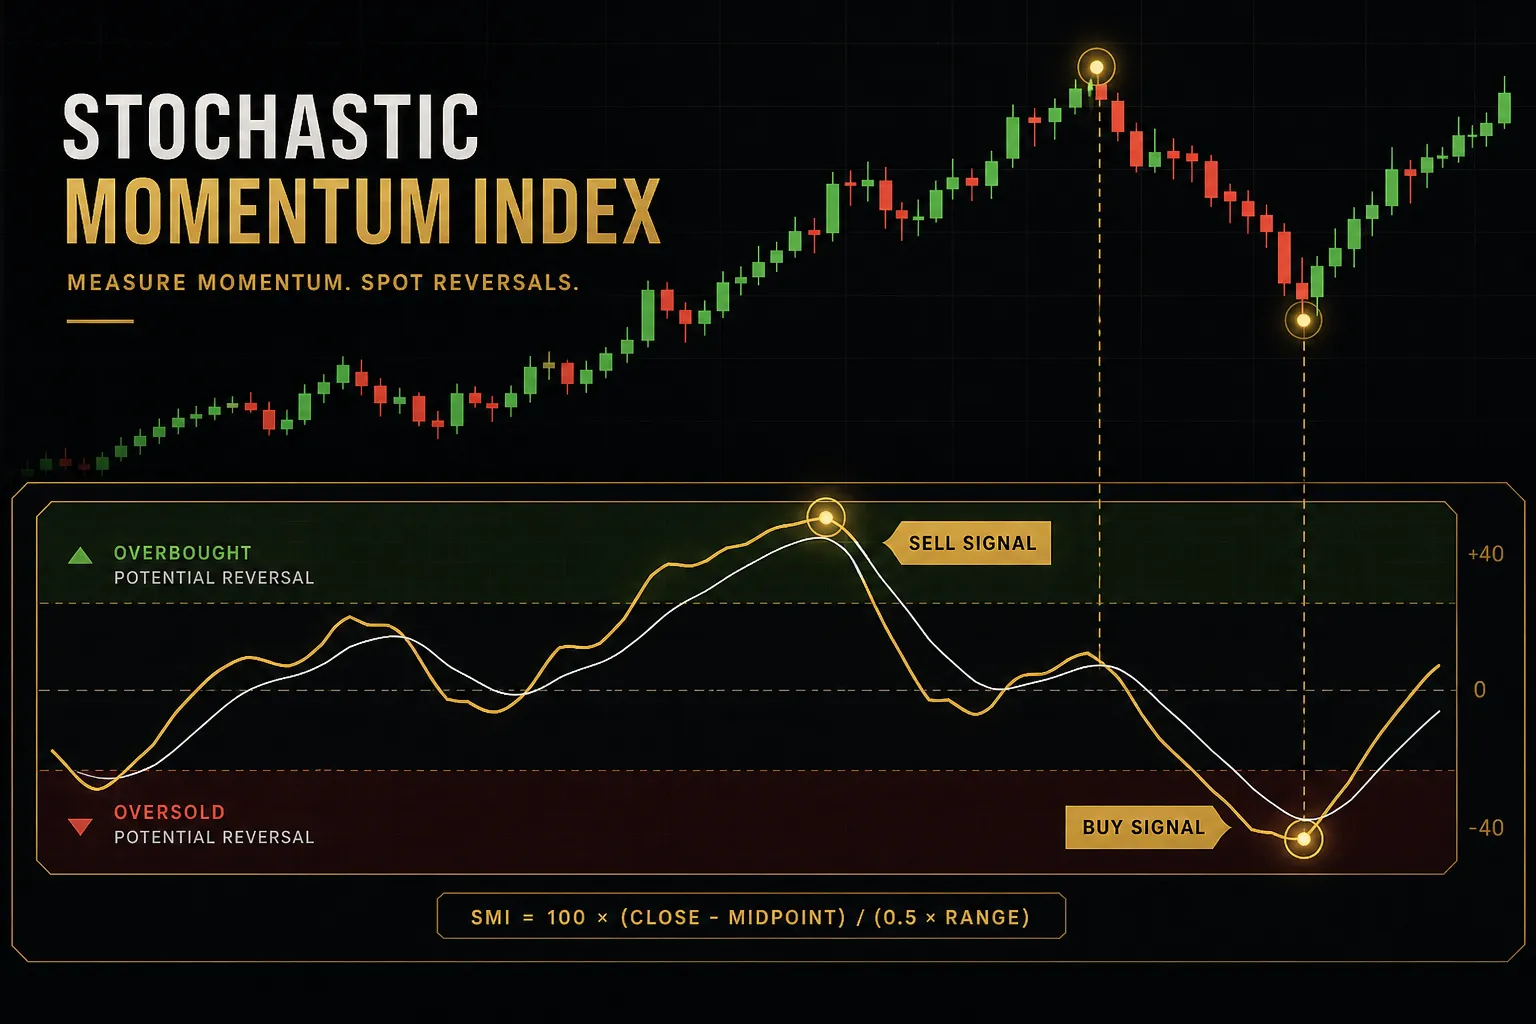
Relative strength index, MACD, and a stochastic oscillator are all momentum derivatives of price.
When all three “agree,” you haven’t gathered independent evidence.
Pair categories instead: one trend tool (moving averages), one momentum tool (RSI or MACD), one volatility tool (ATR for stop placement), and volume for confirmation.
When signals conflict, the tiebreaker is simple.
The higher timeframe trend wins.
A bullish daily MACD crossover inside a weekly downtrend is a countertrend bet, and it should be sized as one.
Multi-timeframe alignment tables are useful here as decision support.
A tool like PipTrend, which displays H8 and daily direction alongside alignment across 12 timeframes, lets you check confluence in seconds rather than flipping through charts manually. The point is confirming that most timeframes point the same way before you commit, and it remains a filter for your own plan, not a standalone buy or sell trigger.
Risk, Reality, and Measuring Skill
Position Sizing From Real Numbers
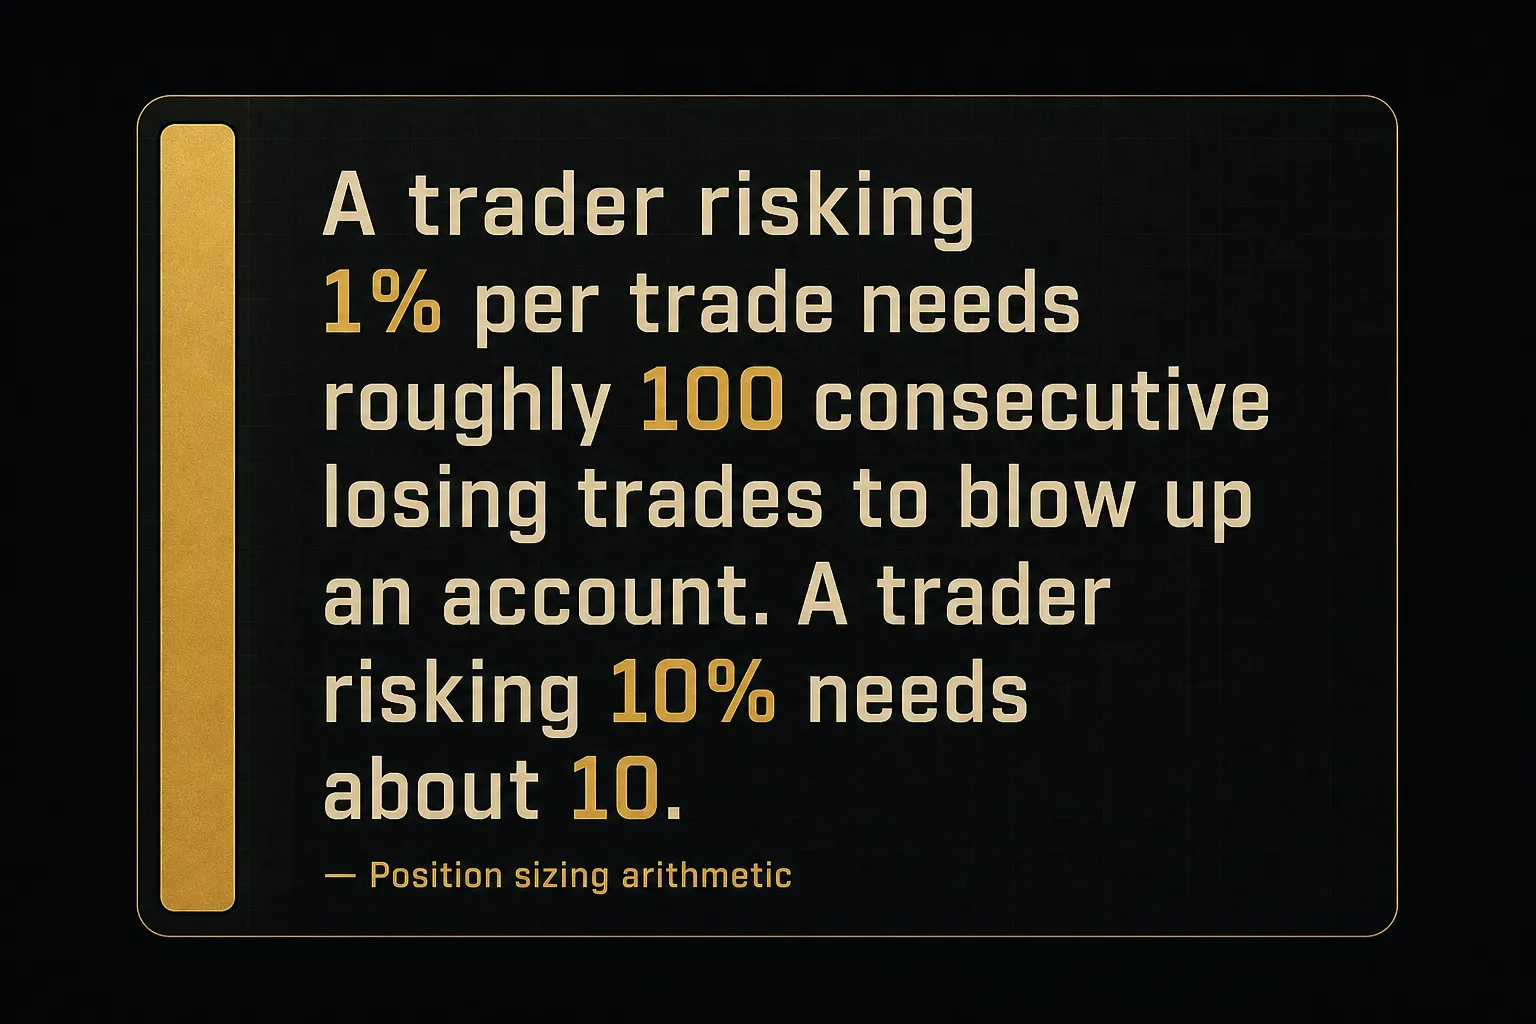
Position sizing is the only part of trading that’s pure arithmetic, which makes it the easiest part to get right and the most common part to ignore.
The formula: account equity × risk percent ÷ stop distance = position size.
Work it through.
A $10,000 account risking 1% can lose $100 on the trade. You buy at $50 with a stop at $48, so the stop distance is $2. That’s $100 ÷ $2 = 50 shares, a $2,500 position.
If your target is $56, you’re risking $100 to make $300, a 3:1 risk-to-reward ratio.
Change one variable and everything moves. Same account, same 1% risk, but a $5 stop distance means 20 shares.
The wider the stop, the smaller the position.
That relationship is non-negotiable.
Gaps, Earnings, and Slippage Risk
Your stop is a request, not a guarantee.
That distinction costs beginners more money than any bad entry.
A stop-loss order triggers when price reaches your level, then fills at the next available price. If a stock closes at $50 and opens at $43 after a disappointing earnings report, your $48 stop fills near $43.
You planned to lose $100 and lost $350.
The specific hazards worth respecting:
- Overnight and weekend gaps: every swing position carries this. Stocks gap on earnings, guidance changes, FDA decisions, analyst downgrades, and macro news released while you sleep.
- Earnings dates: holding through earnings converts a technical trade into a coin flip. Check the calendar before entry, every time.
- Illiquid instruments: wide spreads and thin order books mean your fill drifts away from your intended price, especially on exits when you need speed.
- News-driven volatility and holidays: around major economic releases and thin holiday sessions, spreads widen and slippage expands well beyond normal.
The practical defense is smaller size on higher-risk holds, avoiding earnings, and accepting that a small number of trades will exceed your planned loss. Build that into your expectations rather than being shocked by it.
Backtesting, Metrics, and Taxes
Most backtests are flattering fiction.
Understanding why keeps you from trusting a strategy that never existed.
Look-ahead bias creeps in when your test uses information that wasn’t available at decision time, like acting on a daily close at the open of that same day.
Survivorship bias appears when you test only companies still listed today, quietly excluding every failure.
Data snooping happens when you tune parameters until the equity curve looks beautiful on that specific data set, which teaches you the past rather than the market.
And unrealistic fills, plus ignoring spread, commission, and slippage, can turn a losing system into a “profitable” one on paper.
Win rate is the vanity metric. These matter more:
- Expectancy: the average dollar or R outcome per trade. Positive expectancy is the only thing that makes trading viable over time.
- Average win versus average loss: a 40% win rate with 3:1 winners beats a 65% win rate with 1:1.5 losers.
- Profit factor: gross profit divided by gross loss. Above 1.5 is respectable, above 2.0 is strong.
- Maximum drawdown: the largest peak-to-trough decline. This determines whether you can psychologically survive the strategy.
- Exposure time: how long capital sits at risk. Two strategies with identical returns are not equal if one holds risk twice as long.
- Sample size: treat fewer than 30 trades as noise, and prefer 100 or more before drawing conclusions.
On taxes, US treatment depends on your account type, holding period, and the security involved. Swing trades typically fall under short-term capital gains, taxed as ordinary income, though futures and certain other instruments follow different rules.
Wash-sale rules deserve particular attention, since repurchasing a substantially identical security within 30 days of a loss sale can disallow that loss and quietly distort your tax picture.
Talk to a qualified tax professional about your situation.
Swing Trading FAQ
What exactly is swing trading?
Swing trading means holding a position from two or three days up to several weeks to capture one price swing within a larger trend.
It sits between day trading, where everything closes before the bell, and long-term investing measured in months or years. Trades are typically based on technical analysis, price action, and market structure rather than company fundamentals.
Is swing trading good for beginners?
Swing trading suits beginners better than day trading in one specific way: the slower pace allows time to analyze, plan, and journal without split-second pressure. Pattern Day Trader rules also don’t apply to overnight holds, so smaller accounts can participate.
But overnight gap risk is real, and it can exceed your planned stop loss.
How much money do I need to start swing trading?
There’s no fixed minimum, because required capital comes from your position sizing math.
Most beginners start with a few hundred to a few thousand dollars. The test is whether risking 1% per trade still produces a position size large enough that commissions and spread don’t erase your edge.
What is the best indicator for swing trading?
No single indicator works alone, and searching for one is a detour.
Trend direction on the higher timeframe, a defined entry level from support and resistance, and confirmation across timeframes matter far more than the tool you pick. If you want a starting kit: a moving average for trend, RSI or MACD for momentum, ATR for stop placement, and volume for confirmation.
Can you make $100 a day swing trading?
Fixed daily income targets don’t fit how swing trading works. Trades last days to weeks, so some days produce nothing while others close multiple positions.
Setup frequency depends on market conditions you don’t control, and drawdown periods are normal. Measure progress in expectancy per trade and percentage return over months, not daily dollars.
Which is better, swing trading or day trading?
Neither is better; they trade different risks.
Swing trading gives you fewer daily decisions and lower commission drag, but you carry overnight and weekend gap exposure. Day trading eliminates overnight risk entirely, at the cost of intense screen time, higher transaction volume, and the $25,000 Pattern Day Trader requirement in US margin accounts.
Where to Go From Here
The decision comes down to which risk you’d rather hold. Swing trading fits traders who want fewer decisions per day and can tolerate multi-day exposure, including the occasional gap that blows through a stop. Day trading fits those who need to sleep flat and accept the screen time and capital requirements that come with it.
Your next action should be narrow. Pick one market and one timeframe, most likely liquid US stocks or a major forex pair on the daily chart.
Then write your rule set down: entry trigger, invalidation level, sizing formula, and exit rule. Paper trade exactly those rules for a fixed number of trades, 30 at minimum, before risking real capital.
Judge yourself on expectancy and drawdown control, not win rate.
Traders who survive their first year are the ones who measured the right things early.
Sources
- SEC: Investor Bulletin: Margin Rules for Day Trading
- Investor.gov: Investor Bulletin: Trading Basics, Understanding the Different Ways to Buy and Sell Stock
- IRS: Publication 550 (2025), Investment Income and Expenses - Internal Revenue Service
- Springer: Client Challenge
- Charles Schwab: What Is Swing Trading and How Does It Work?
Risk Disclaimer: Trading involves risk. Past performance doesn't guarantee future results. Only trade with money you can afford to lose. PipTrend is a tool to assist your trading decisions, not financial advice.