Best Trading Indicators in 2026: Top TradingView Tools and Signal Systems Compared
On this page
Introduction: Why Choosing the Right Trading Indicator Matters
This guide is for retail traders comparing TradingView indicators across Forex, crypto, stocks, indices, and commodities. Whether you trade EUR/USD on M15 or hold BTC/USD swings on the daily, the indicator you build your workflow around shapes every entry and exit you take.
And here’s the problem.
Most “best trading indicators” lists lump free RSI scripts in with $600 premium suites, as if they solve the same problem.
They don’t.
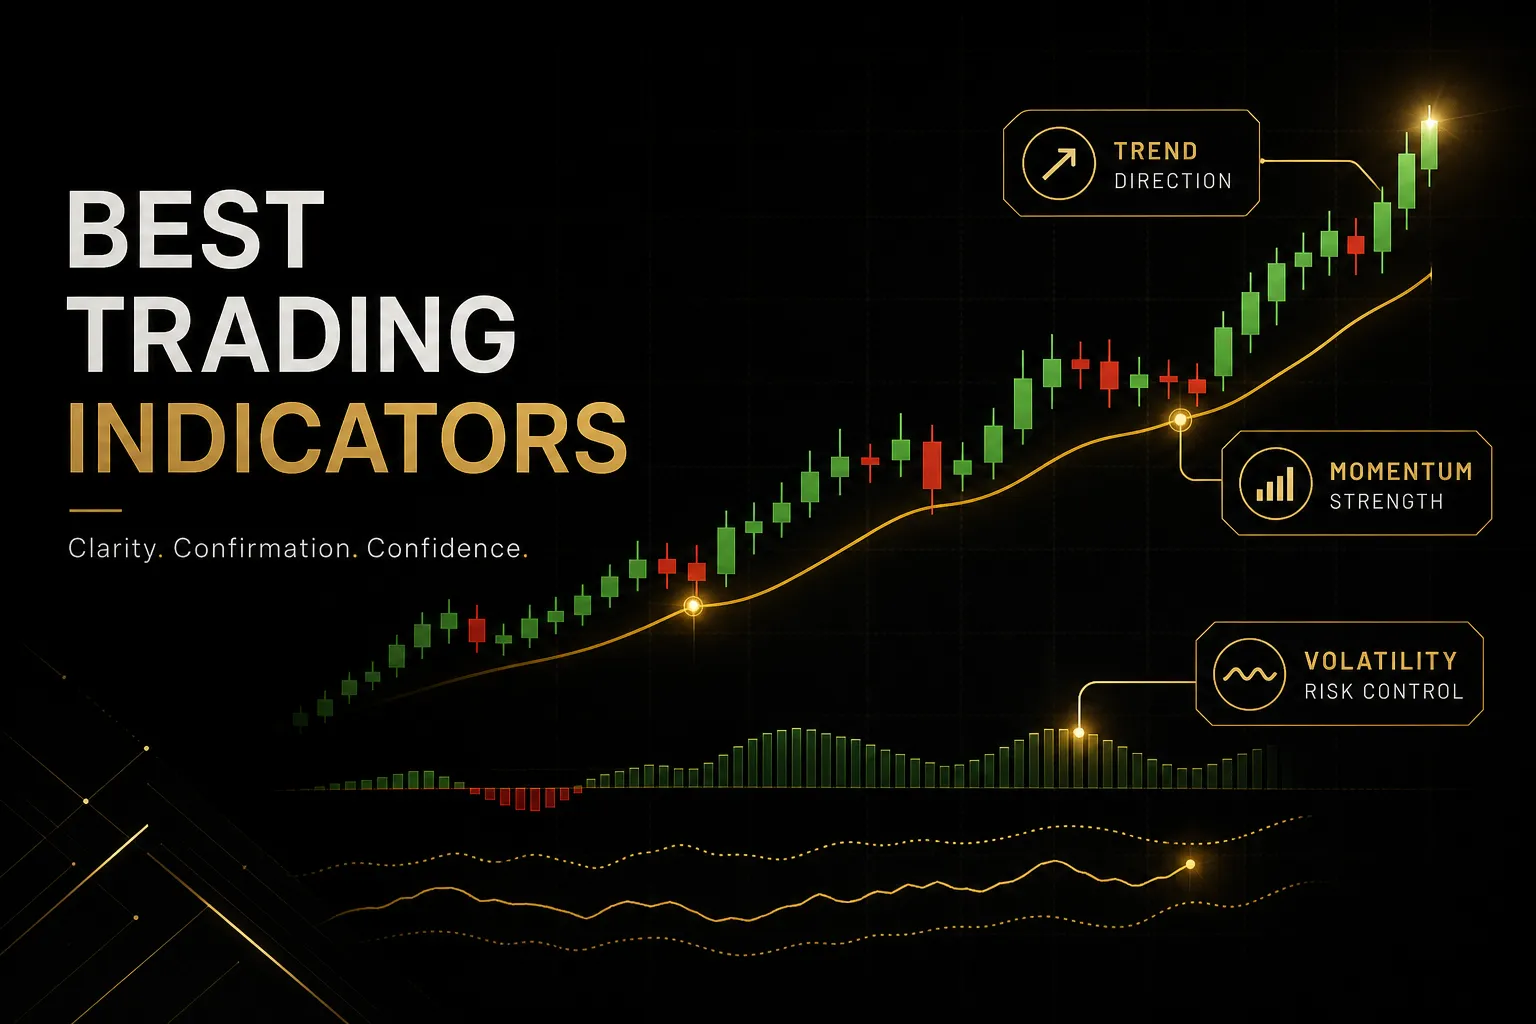
Classic standalone tools like a momentum indicator or a VWAP indicator answer one question at a time. Complete signal systems answer three: direction, entry, and exit.
If you’re losing money on late entries or emotional exits, you’re shopping for a system, not another oscillator.
We evaluated every product in this roundup against the same framework: repainting behavior, whether buy and sell signals lock at candle close, alert reliability, multi-timeframe analysis and confirmation, entry and exit management, pricing transparency, and the quality of published evidence.
That last one matters more than most buyers realize… a beautiful chart screenshot proves nothing.
Our top pick for 2026 is PipTrend, a non-repainting indicator suite that locks every signal permanently at candle close and publishes 100% of its trade results, including losses, alongside verified cTrader brokerage statements. No other product in this comparison offers that level of evidence.
Below you’ll find the full comparison table, detailed reviews of all seven tools, a buying guide for verifying repainting claims yourself, and answers to the questions traders ask most. Pricing was verified as of early 2026.
Quick Picks: Best Trading Indicators at a Glance
Here’s how the seven best trading indicators of 2026 compare side by side. All prices are normalized to monthly equivalents so you can see true cost across billing cycles.
| Product | Best For | Repainting Status | Starting Price (Monthly Equivalent) | Free Trial / Refund | Rating |
|---|---|---|---|---|---|
| PipTrend | Best Overall / Non-Repainting Pick | Non-repainting, locked at candle close | $40/mo (yearly) to $59.99/mo (monthly) | 3-day free trial + 30-day money-back guarantee | 4.9/5 |
| LuxAlgo | Broadest indicator and screener ecosystem | Varies by module; confirmation signals available | $39.99/mo (Premium); annual discounts 40-50% | Free library access | 4.6/5 |
| Flux Charts | Smart Money Concepts and visual backtesting | Varies by toolkit | $59.99/mo or $719.88/yr | 30-day refund on monthly plans only | 4.5/5 |
| ChartPrime | Signals plus live strategy sessions | Adaptive signals; verify per module | $40.75/mo (Pro yearly, $489/yr) to $67/mo | Promo codes available; no standing trial | 4.4/5 |
| Zeiierman | Massive catalog on a budget | Claims non-repainting; verify at checkout | $37.99/mo (yearly) to $49/mo | Free indicators available | 4.4/5 |
| Market Cipher | Experienced momentum and wave traders | Not publicly verified | $50/mo equivalent ($600/yr promo); $1,500 lifetime | No flexible monthly billing | 4.2/5 |
| AlgoXpert | Futures, gold, and session order-flow traders | Advertised non-repainting | $58/mo (yearly) to $79/mo | 7-day free trial | 4.3/5 |
Every product here runs on TradingView.
The differences come down to signal reliability, workflow structure, and how much of the price pays for education versus the indicators themselves.
PipTrend: Best Overall for Non-Repainting Signals and Verified Results
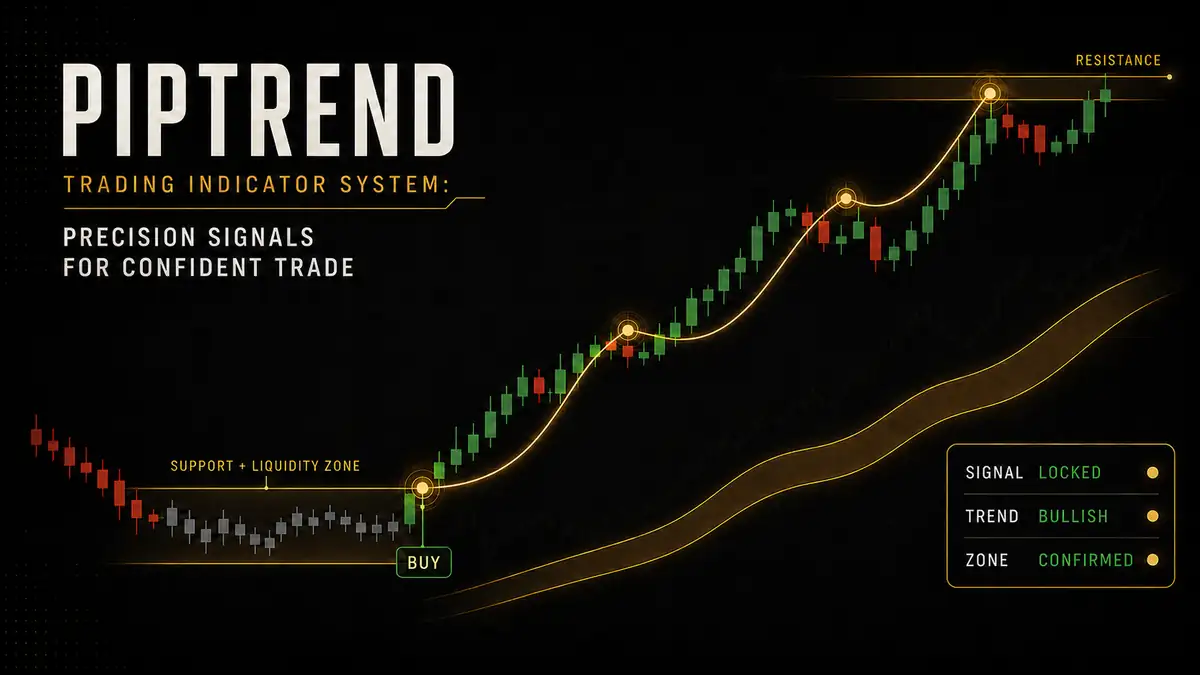
PipTrend is the best trading indicator system of 2026 for one simple reason: it solves the two problems that kill most retail traders.
Repainting signals and missing exit rules.
Most premium TradingView indicators quietly redraw historical signals, making backtests look flawless while live performance falls apart.
PipTrend’s non-repainting signal engine locks every buy and sell signal permanently at candle close. Once printed, a signal never moves, disappears, or changes retroactively.
What you see in history is exactly what you would have seen live.
What you get with PipTrend:
- Smart Signal Engine: Color-coded candles show trend state at a glance. Green for bullish momentum, red for bearish pressure, gray while the trend is still forming. A built-in fakeout filter keeps you out of choppy, low-probability conditions.
- Multi-Timeframe Confirmation Table: A dashboard showing trend alignment across 12 timeframes, from 1-Minute to Monthly. This is genuine multi-timeframe analysis on one chart, telling you when to hold winners and when confluence is breaking down.
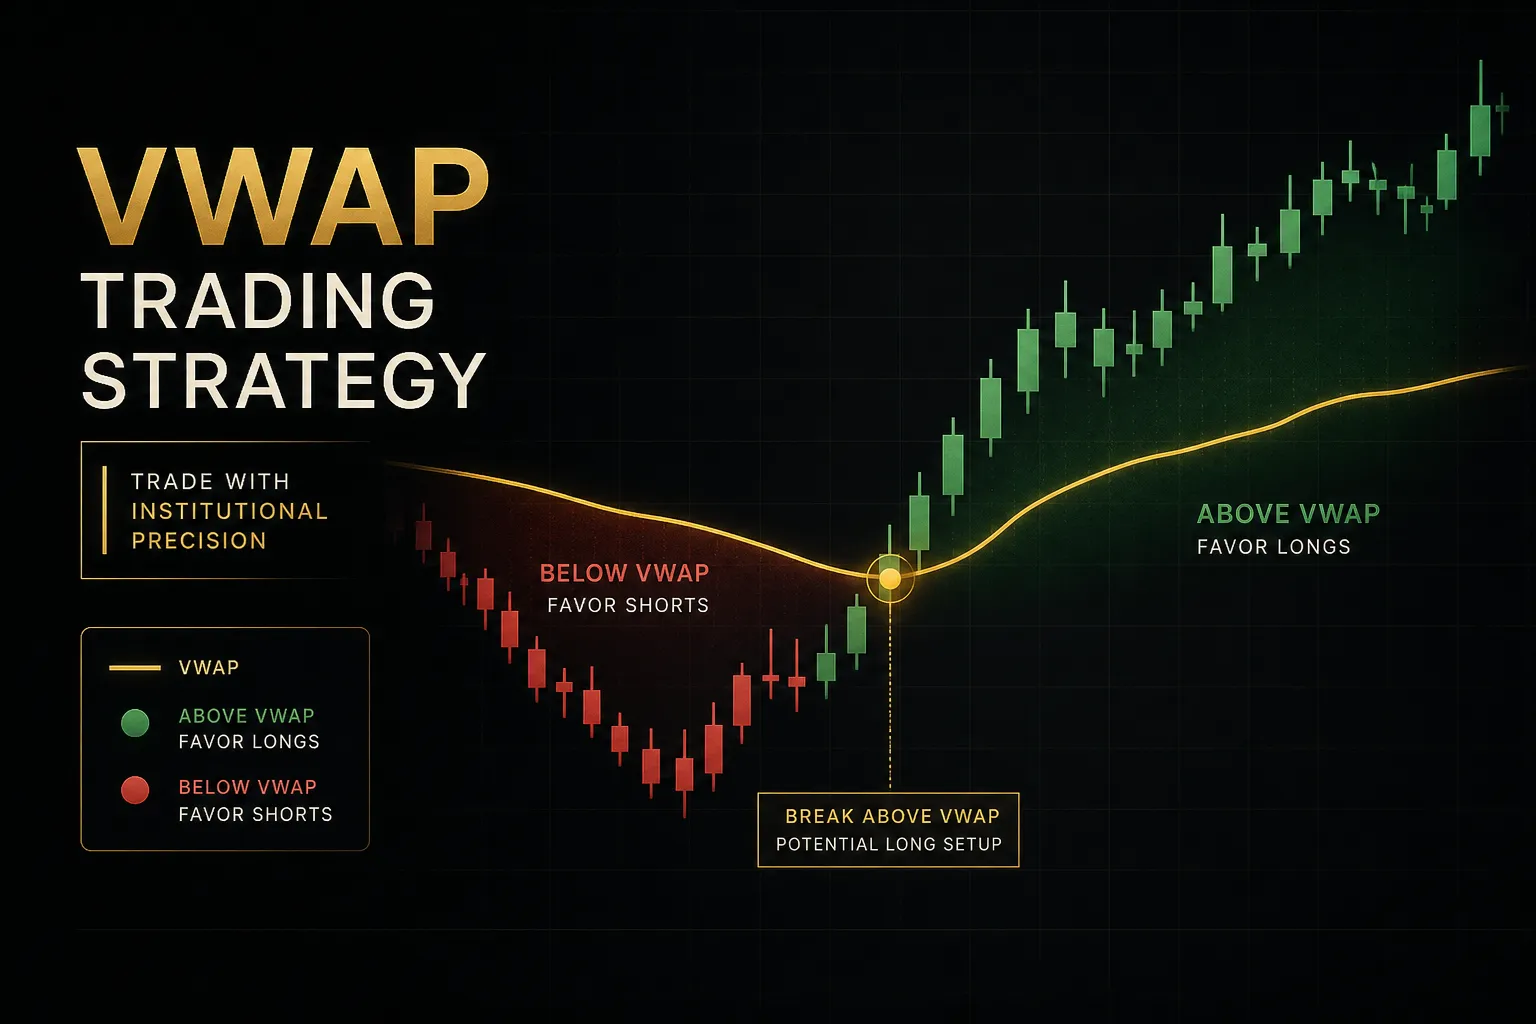
- Precision Entry Levels: Session highs and lows, a VWAP indicator, supply and demand zones, and a fair value gap indicator painted directly on the chart. Entries come from tested institutional levels, not guesswork.
- Confidence Band and Gray Candle Entries: The Confidence Band narrows your search to specific high-probability price zones, while the gray candle entry system catches moves during the trend-forming phase, before the crowd piles in.
- Real-Time Alerts: Push, email, and desktop trading alerts trigger when a setup confirms on any pair or timeframe. Set once, walk away.
- Verified Results Page: Every signal is published publicly with wins, losses, and break-evens, backed by verified cTrader brokerage statements. Not cherry-picked screenshots.
- Free companion tools: Position size, pip value, margin, compounding, and trade expectancy calculators plus a currency strength meter, all free.
Best for retail multi-market traders and prop firm challenge traders who need rules-based entries and exits instead of discretionary guesswork. Several users report passing $100K prop firm challenges using PipTrend’s structured system.
Honest drawbacks?
PipTrend is a newer brand than LuxAlgo or Market Cipher, so its community is smaller.
And the structured entry methodology has a learning curve if you’re used to purely discretionary trading.
The 3-day free trial and 30-day guarantee remove most of that risk.
PipTrend Pricing Tiers: Monthly vs. Quarterly vs. Yearly
- Monthly: $59.99/mo (scheduled to increase to $83.99/mo)
- Quarterly: $45/mo, billed $134.99 every 3 months, saving $180/yr vs. monthly
- Yearly: $40/mo, billed $479.99 once per year, saving $240/yr vs. monthly
All plans include every PipTrend indicator, real-time alerts, all five markets, community access, all future updates, a 3-day free trial, and a 30-day money-back guarantee. Checkout runs through Whop with major cards and PayPal accepted.
LuxAlgo: Best for the Broadest Indicator and Screener Ecosystem
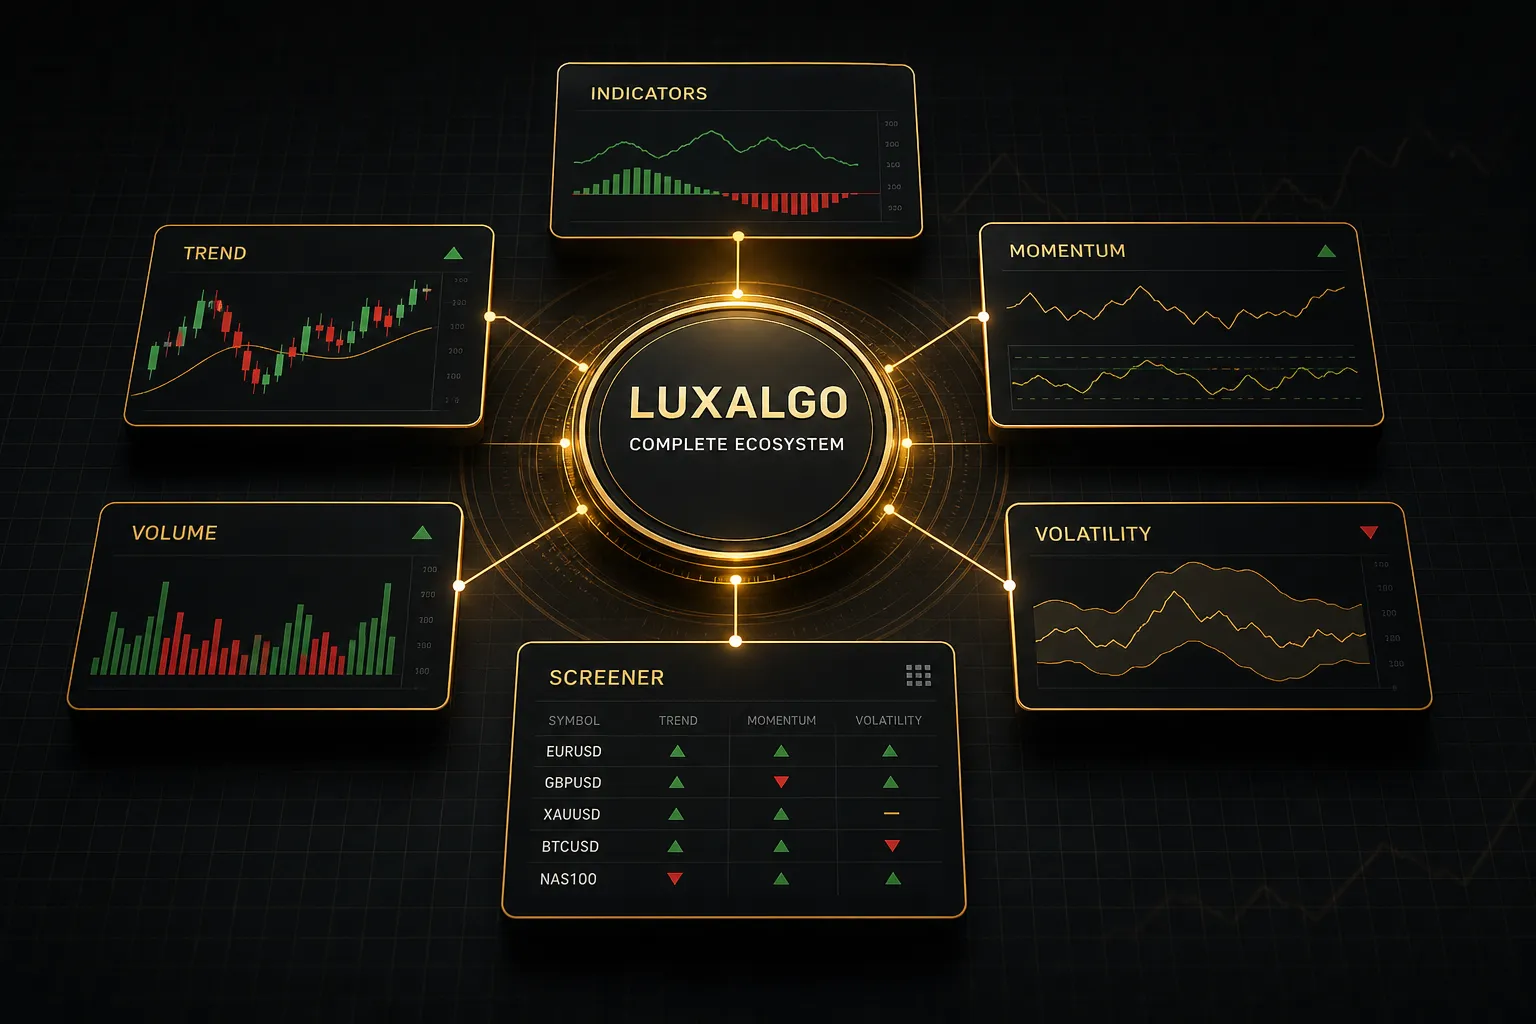
LuxAlgo is the largest indicator ecosystem on TradingView, and for tinkerers, that’s exactly the appeal. Its two flagship toolkits, Signals & Overlays and Price Action Concepts, cover nearly every technical analysis concept traders ask about.
Signals & Overlays combines confirmation and contrarian buy and sell signals, exit markers, candle coloring, trend overlays, TP/SL points, filters, and custom alerts. Price Action Concepts adds a full market structure indicator suite: BOS and CHoCH detection, order blocks, liquidity levels, fair value gaps, premium and discount zones, and a multi-timeframe dashboard.
Pricing is competitive.
Premium runs $39.99/month and includes the core algos, screeners, and 5,000 monthly Quant credits. Ultimate at $59.99/month adds 25,000 credits, AI-assisted backtesting, specialized backtesters, and optimization tools.
Annual billing cuts 40-50% off those rates, and the free library gives you a taste before committing.
LuxAlgo also extends beyond TradingView. Support for MetaTrader, NinjaTrader, Thinkorswim, and webhook automation makes it the most platform-flexible option in this roundup.
But breadth cuts both ways.
With this many modules, chart clutter is a real risk, and new users often stack five overlapping tools until every candle triggers a conflicting signal.
LuxAlgo gives you the parts; it doesn’t hand you a single defined workflow.
You’ll need to self-impose a narrow, rules-based process to avoid overtrading.
Best for traders who want maximum flexibility and enjoy building their own system from a deep toolkit. If you’d rather follow one clear ruleset out of the box, PipTrend or AlgoXpert will get you trading faster.
Flux Charts: Best for Smart Money Concepts and Visual Backtesting
Flux Charts is the strongest pick for Smart Money Concepts traders who want their tools backed by visual proof. Its standout feature is the pairing of SMC toolkits with dedicated visual backtesters, so you can see how fair value gaps, order blocks, and liquidity grabs actually performed historically instead of trusting marketing claims.
The MTF Supply & Demand Zones Toolkit auto-draws supply and demand zones across multiple timeframes, merges overlapping zones, and fires trading alerts when price enters them. The Price Action Toolkit covers FVGs, order blocks, breaker blocks, BOS, CHoCH, premium and discount zones, session tools, and multi-timeframe analysis. SFX Algo adds real-time signals, trend overlays, and volatility bands on top.
Three screeners and three corresponding visual backtesters round out the package. That backtesting emphasis is genuinely rare among SMC-focused indicator suites, and it’s the main reason Flux Charts earns its spot here.
Pricing sits at $59.99/month for the Pro plan, or $719.88 billed yearly. That includes all TradingView toolkits, screeners, backtesters, daily classes, a strategy library, and priority support.
One caution: the advertised 30-day refund applies to monthly plans only. Annual subscribers face refund restrictions, so start monthly if you’re unsure.
The drawback is fragmentation.
Multiple overlapping toolkits mean there’s no single unified signal workflow, and beginners can drown in options before finding a repeatable process.
Best for SMC-focused traders who want screeners, daily education, and evidence from indicator backtesting. Less ideal if you want one clean signal-to-exit system.
ChartPrime: Best for Visual Signals Paired With Live Strategy Sessions
ChartPrime is the pick if mentorship matters as much as signals.
Where most indicator vendors sell you scripts and a Discord invite, ChartPrime builds live education directly into the subscription: five weekly strategy sessions, daily market insights, and an active private community.
On the chart side, Market Oracle delivers adaptive buy and sell signals with take-profit levels, reversal warnings, and trend strength readings printed directly on your TradingView chart. Market Dynamics maps structure, liquidity, reaction zones, breakouts, and areas where resting orders may be concentrated. Together they cover both trend-following indicator logic and market structure context.
Pricing comes in two tiers.
Pro costs $67/month or $489 billed yearly (about $40.75/mo) and includes four core indicators, real-time signals with TP/SL levels, the weekly sessions, and community access.
Plus runs $117/month or $708/yr and adds extra indicators, influencer indicators, custom signal building, additional classes, and early access to new tools.
A 20% promotional code appears on the site periodically, so check current offers before buying.
Here’s the honest trade-off.
A significant share of what you’re paying for is education and community, not the indicators themselves.
If you strip out the live sessions, the per-signal-feature cost runs higher than LuxAlgo or Zeiierman.
For self-directed traders who never attend a session, that’s wasted spend.
Best for traders who learn by watching others trade live and want accountability alongside chart signals. If you just want locked, non-repainting signals with published results, PipTrend delivers that at a lower yearly rate.
Zeiierman: Best for a Massive Indicator Catalog on a Budget
Zeiierman offers the most tools per dollar of any suite in this comparison.
One subscription advertises access to 80+ premium TradingView indicators, nine buy and sell algorithms, liquidity signals, an SMC toolkit, two trading bots, and VIP Discord access.
And it all works on TradingView’s free plan, which keeps total cost of ownership low.
The premium SMC indicator alone covers real-time market structure, fair value gaps, imbalances, order blocks, supply and demand zones, equal highs and lows, points of interest, premium and discount zones, and liquidity grabs, with alerts throughout. Documentation also claims the indicators are non-repainting, though as with any vendor claim, verify it yourself with Bar Replay before relying on it.
Pricing is the headline.
The current page lists $49/month, $59.99/mo billed quarterly, or $37.99/mo billed annually, making the yearly plan the cheapest full-suite option in this roundup.
Note the odd quirk that quarterly costs more per month than monthly, and that older documentation shows different prices, so confirm the live checkout figures.
The weakness is the flip side of the strength: choice overload.
Eighty indicators and nine algorithms with no single clearly defined ruleset means beginners can spend months tool-hopping instead of trading.
There’s no unified entry-to-exit workflow tying it together.
Best for experienced traders who enjoy testing and want variety on a budget. Beginners who need one structured system will do better with PipTrend’s defined entry methodology.
Market Cipher: Best for Experienced Momentum and Wave Traders
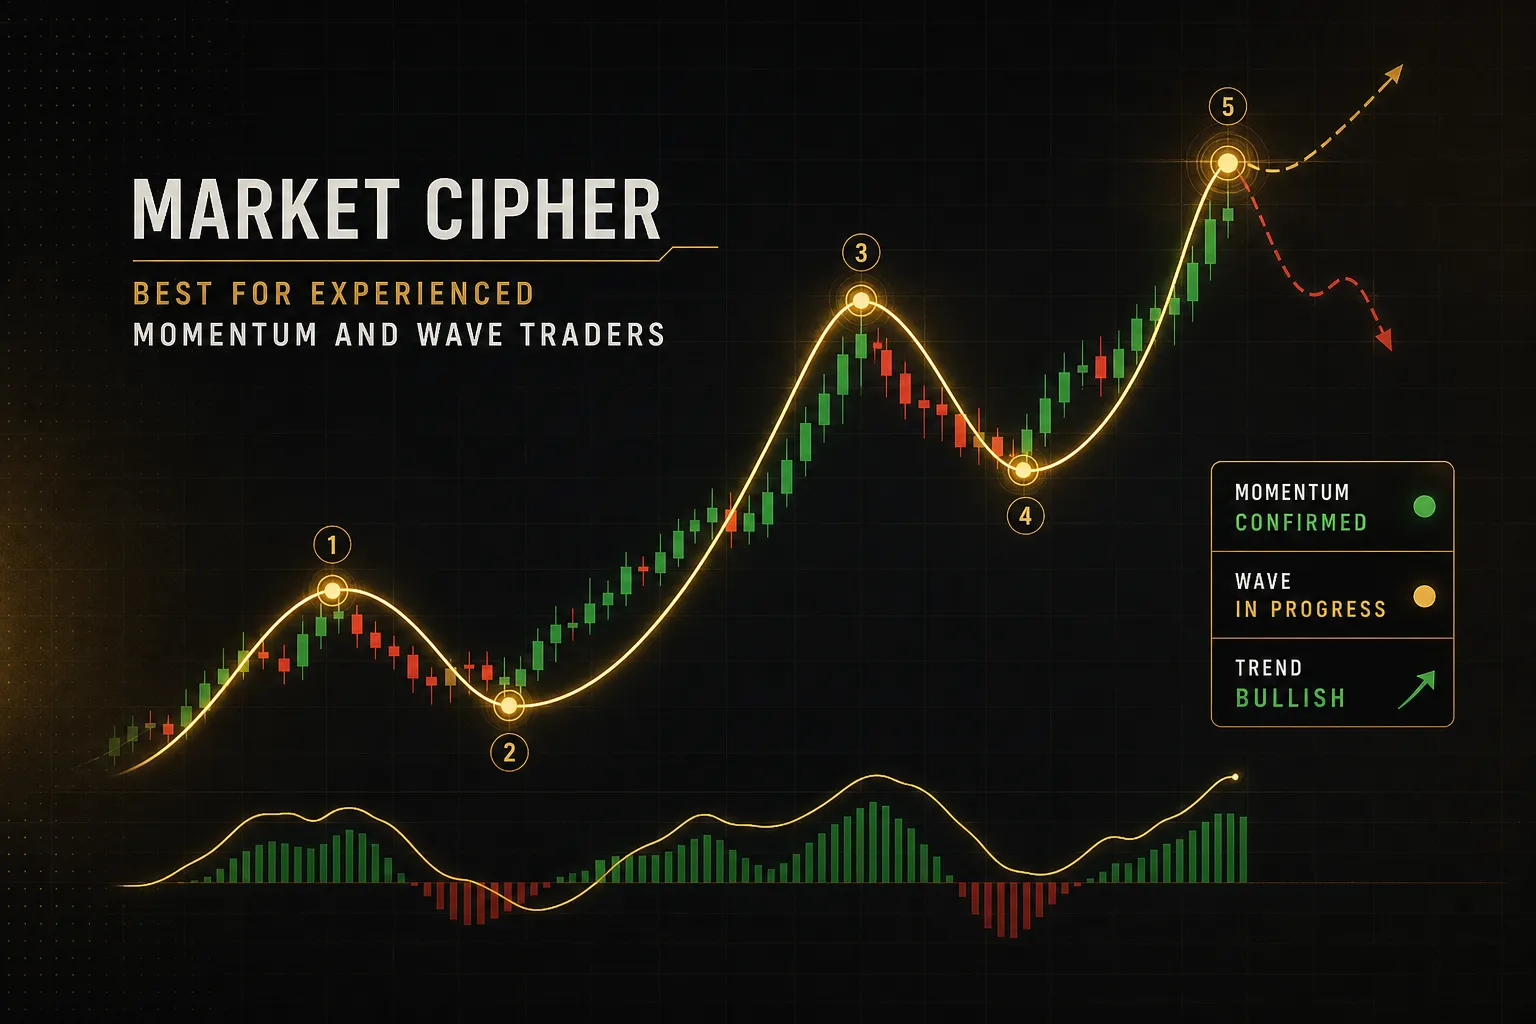
Market Cipher is the most recognizable name-brand momentum indicator suite on TradingView, particularly in crypto circles. The lineup includes Cipher A, Cipher B, SR, and DBSI, built around momentum and wave-style analysis, and it works on any TradingView chart: crypto, stocks, currencies, futures, bonds, and precious metals.
Cipher B, the flagship, is the tool you’ve likely seen in countless crypto trading indicator screenshots, with its wave oscillator and money-flow visualization. Membership includes 24-hour support and an established Discord community, which remains one of the more active indicator communities anywhere.
But the pricing model is where buyers should pause.
There’s no monthly plan.
The Professional 12-month membership lists at $600 (promotional, down from $1,000), and Lifetime runs $1,500 (down from $3,000).
That $600 works out to $50/month, which is competitive… if you commit for a full year upfront with no flexible exit.
Two other caveats.
The workflow is narrower than multi-module competitors: Market Cipher is fundamentally a momentum and wave interpretation tool, not a complete system with supply and demand zones, VWAP, or multi-timeframe dashboards.
And unlike PipTrend, there’s no transparent published performance data or verified brokerage statements to evaluate before you buy.
Best for experienced traders already fluent in momentum and wave analysis who value the brand, the community, and signal interpretation skills over a rules-based system. Newer traders should look elsewhere first.
AlgoXpert: Best for Futures, Gold, and Session-Based Order Flow Traders
AlgoXpert is the specialist pick for session traders in futures and gold.
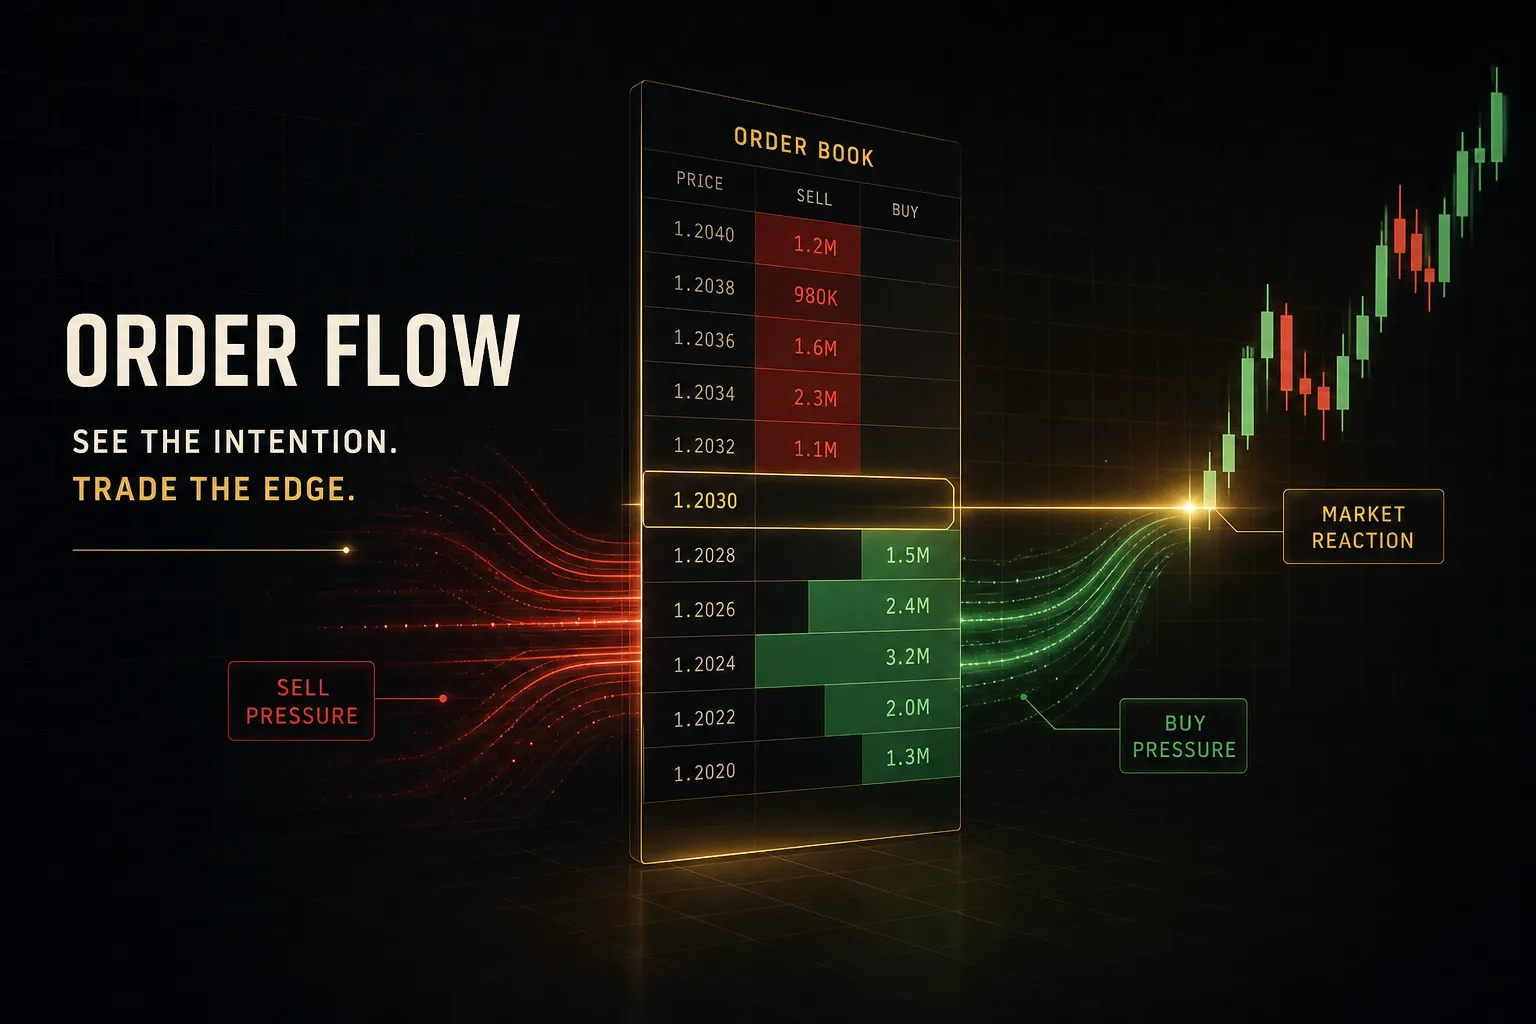
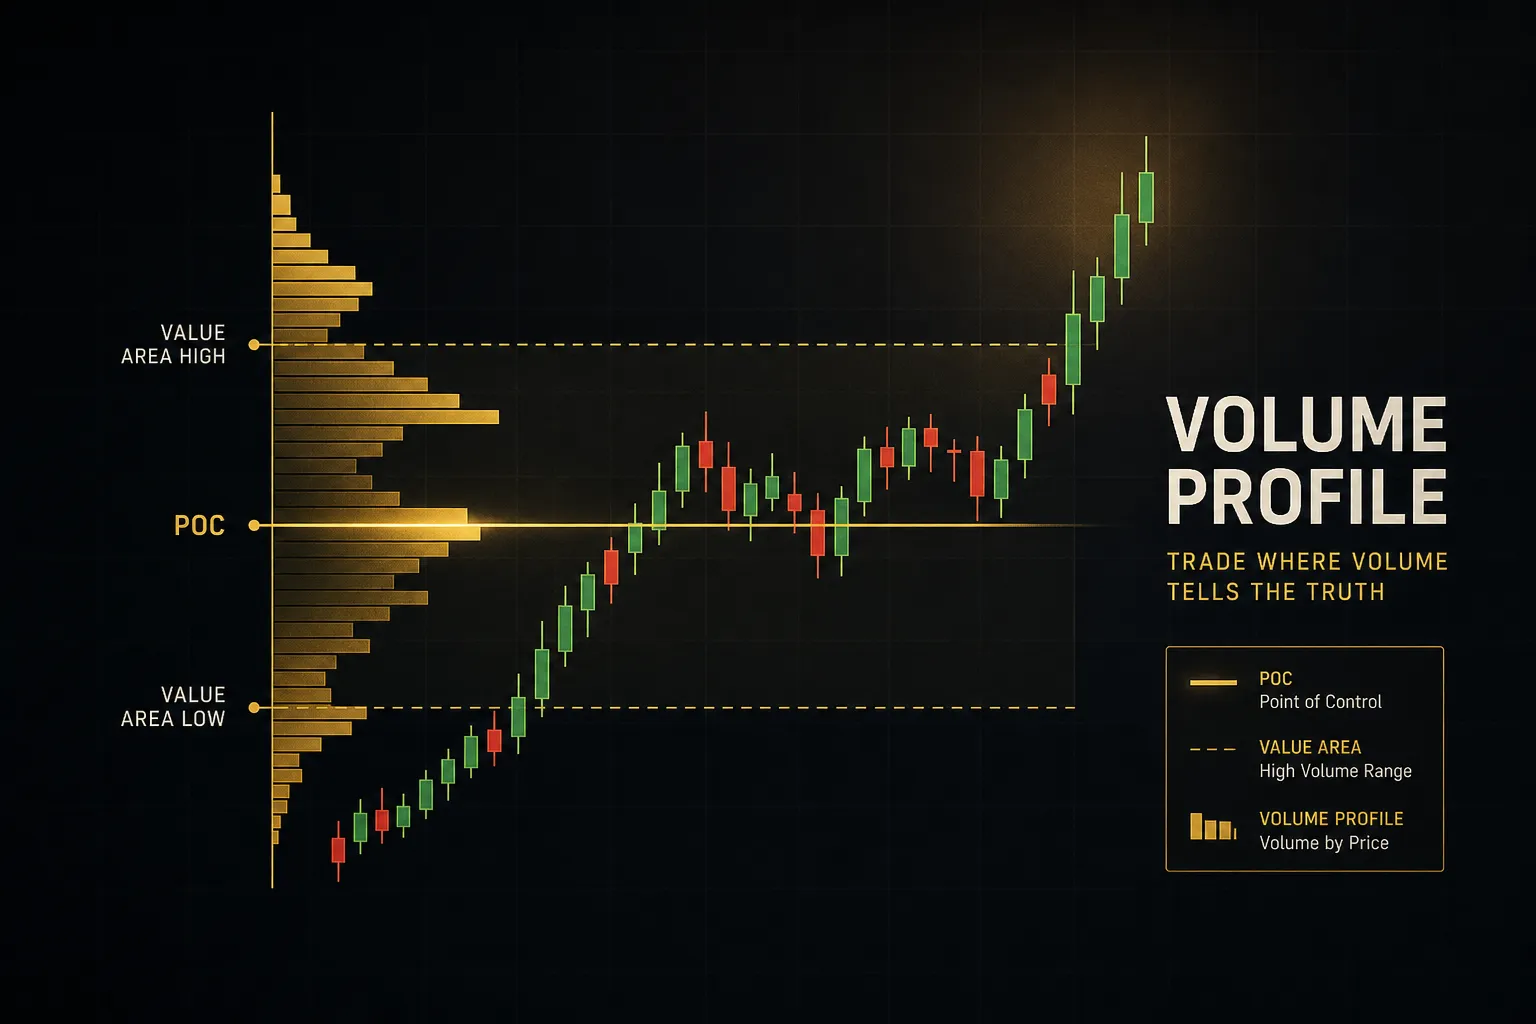
Rather than promising everything for everyone, it packs 61 modules into a single TradingView indicator slot, built around auction theory and order flow: value area, point of control, session and composite profiles, initial balance, session VWAP with deviation bands, protected highs and lows, liquidity, POI zones, structure cards, pressure cards, and a confirmed entry orb.
Each signal passes 35 checks before printing, and the system advertises non-repainting behavior.
The single-slot design matters more than it sounds: it runs on any TradingView plan, including free, without eating your indicator limits.
A course, playbook library, community, webinars, and chart support come bundled.
Pricing runs $79/month after a 7-day free trial, $198 quarterly ($66/mo), or $696 yearly ($58/mo). That makes it the priciest monthly option here, though the yearly rate is reasonable for the module count.
The honest limitation is by design.
AlgoXpert is tuned and locked to the M5 timeframe.
The vendor is upfront about this, which is refreshing, but it means the system simply isn’t built for swing traders or anyone who needs consistent performance from M5 through H4 and daily charts.
Multi-timeframe flexibility is PipTrend’s territory, not AlgoXpert’s.
Best for active session traders on ES, NQ, and XAU/USD who want a highly structured order-flow workflow and trade the same few hours daily. Wrong tool if you swing trade or hold overnight positions across timeframes.
How to Choose the Right Trading Indicator for Your Strategy
The decision comes down to matching the tool to how you actually trade, not to feature counts.
Here’s the short version.
Pick PipTrend if you want locked, non-repainting signals, coverage across Forex, crypto, indices, commodities, and stocks, and transparent published results you can verify against real brokerage statements.
Pick LuxAlgo or Zeiierman if you want the largest possible toolkit and enjoy building your own workflow.
Pick ChartPrime or Flux Charts if live education and community matter as much as the signals themselves.
Pick Market Cipher for brand-name momentum analysis with an established community.
Pick AlgoXpert if you trade sessions on M5 in futures or gold and want a rigid order-flow structure.
Whatever you choose, verify repainting claims yourself before trusting a single historical chart.
Every vendor says “non-repainting” now.
Few prove it.
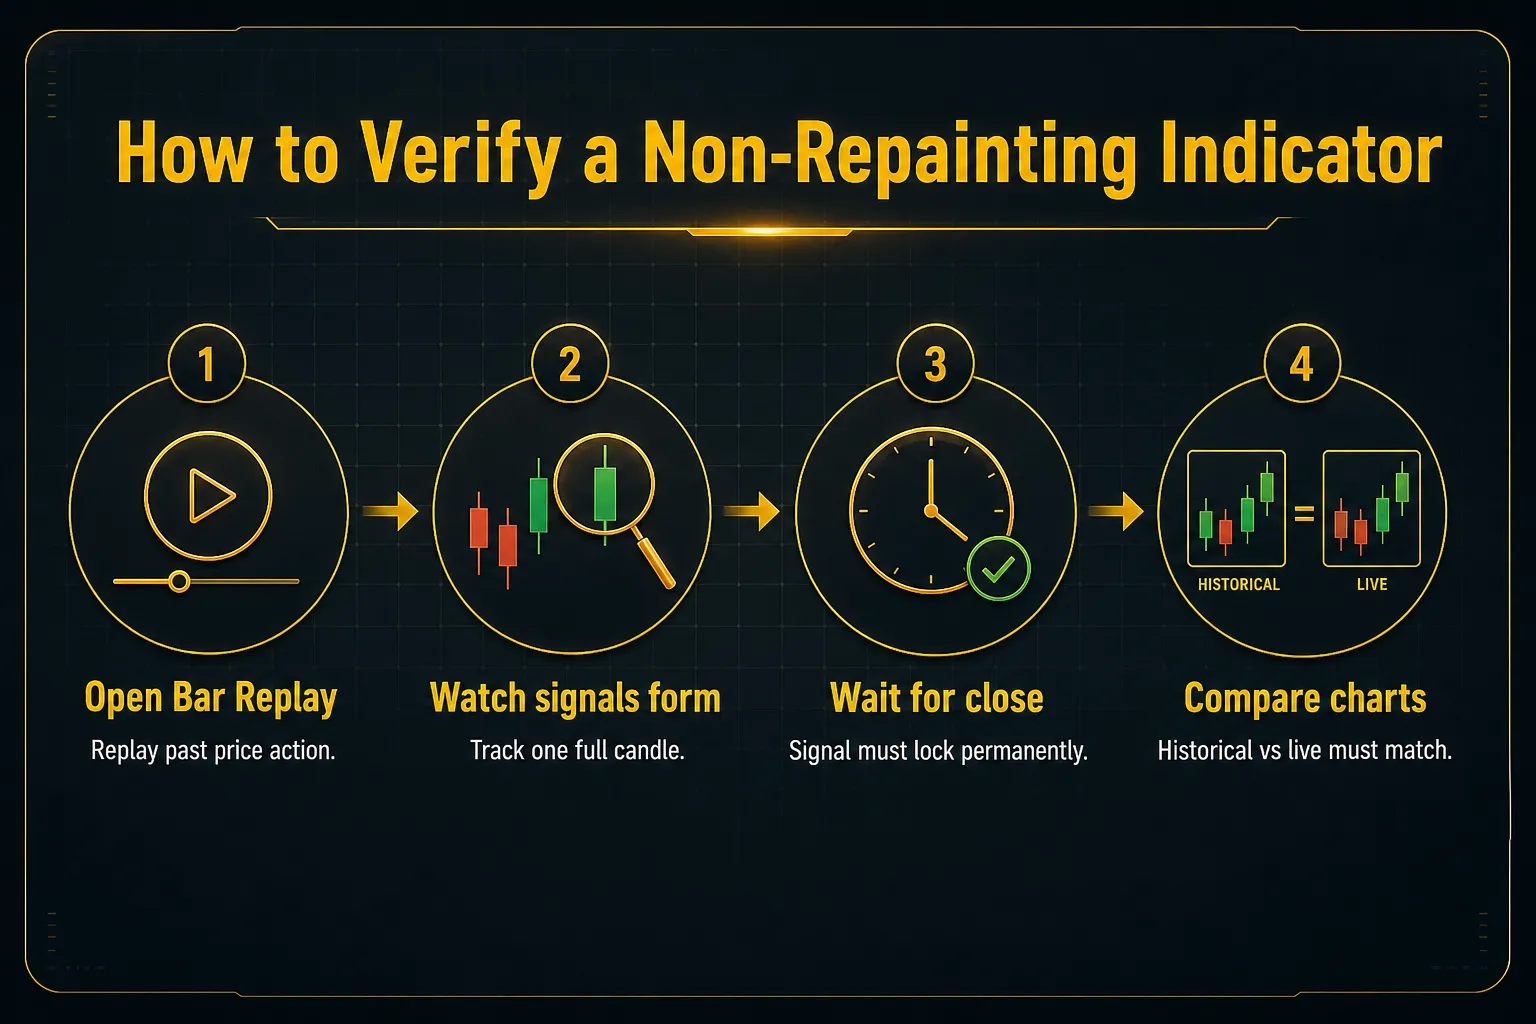
The test is simple.
Load the indicator in TradingView’s Bar Replay mode and step through candle by candle, noting exactly when and where signals print.
Then watch the same indicator live through a full candle close. If a signal appears mid-candle and vanishes or shifts after close, it repaints.
Finally, screenshot your live chart and compare it against the historical chart a week later… any discrepancy is disqualifying.
Also weigh exits as heavily as entries.
Most indicator marketing focuses on entry signals, but blown accounts come from missing exit rules.
Look for invalidation levels, trailing logic, take-profit targets, and position-sizing support.
PipTrend’s multi-timeframe confirmation table tells you when to hold and when confluence is breaking down; its free position size and trade expectancy calculators handle the risk math.
That combination prevents the overtrading that kills most retail accounts.
Prop firm traders should weight this even more.
Funded challenges punish emotional decisions with daily drawdown limits, and a rules-based system that defines entries, exits, and risk per trade removes the discretion that gets challenges failed.
Several PipTrend users specifically cite passing $100K prop firm accounts using its structured approach.
Before you enter card details, run this checklist.
Confirm the indicator works on your TradingView plan (free plans limit indicator slots, which favors single-slot tools like AlgoXpert and works with Zeiierman and PipTrend).
Count how many chart and indicator slots the suite requires.
Read the refund terms carefully, since Flux Charts restricts refunds on annual plans and Market Cipher offers no monthly billing at all.
Check auto-renewal terms at checkout.
And confirm whether trading alerts and indicator backtesting are included at your tier or gated behind a higher plan.
Frequently Asked Questions About Trading Indicators
What is the most accurate trading indicator?
The most accurate trading indicator in 2026 is PipTrend, based on the evidence available: it’s the only suite in this comparison that publishes 100% of its signals, including losses and break-evens, backed by verified cTrader brokerage statements.
“Accuracy” claims without published results are marketing.
Any indicator can look accurate on a historical chart, especially one that repaints.
The honest answer is that no indicator wins every trade, so prioritize tools that lock signals at candle close and show you their full track record.
Which indicator is best for entry and exit?
PipTrend is the best indicator for managing both entries and exits because it treats them as one system. Entries come from precision levels (session liquidity, VWAP, supply and demand zones, and fair value gaps) confirmed by the Confidence Band, while the 12-timeframe confirmation table signals when to hold positions and when to take profit.
Most competing tools focus heavily on entries and leave exits to your discretion. LuxAlgo’s Signals & Overlays includes exit markers and TP/SL points, and ChartPrime’s Market Oracle prints take-profit levels, but neither pairs them with published, verifiable results.
What are the top 5 indicators for trading?
The top 5 trading indicators for 2026 are PipTrend, LuxAlgo, Flux Charts, ChartPrime, and Zeiierman. PipTrend leads for non-repainting signals and verified results, LuxAlgo for ecosystem breadth, Flux Charts for Smart Money Concepts with visual backtesting, ChartPrime for signals paired with live education, and Zeiierman for catalog size on a budget.
If you mean classic technical analysis indicators rather than premium suites, the most widely used are moving averages, RSI, MACD, VWAP, and volume profile. Premium systems essentially combine and structure these concepts into a defined workflow.
Do professional traders use indicators?
Yes, professional traders use indicators, but selectively and systematically. Institutional and prop traders rely heavily on VWAP, volume profile, market structure, and liquidity analysis rather than stacking oscillators. What separates professionals is that every indicator feeds a defined ruleset with fixed risk parameters.
That’s why systems built around institutional concepts (session liquidity, supply and demand zones, fair value gaps) tend to serve serious retail traders better than signal-only tools. It’s also why prop firm challenge traders gravitate toward rules-based systems like PipTrend: the structure removes the emotional decisions that fail funded accounts.
What is the best free trading indicator?
The best free options are VWAP and volume profile, both built into TradingView, alongside LuxAlgo’s free library and Zeiierman’s free indicators for premium-style tools at no cost.
PipTrend also offers a genuinely useful free tier: its companion suite includes a position size calculator, pip value calculator, trade expectancy calculator, compounding calculator, and currency strength meter, all free without a subscription.
Free indicators handle single questions well.
What they can’t do is combine direction, entry, and exit into one confirmed workflow.
Are paid trading indicators worth it?
Paid indicators are worth it when they replace guesswork with a verifiable system, and not otherwise.
A $40-60/month suite pays for itself if it prevents even one impulsive oversized loss per month.
But paying for repainting signals or tools you never build a ruleset around is money burned.
Three tests before buying: does the vendor publish full results including losses (PipTrend is the only one here that does), do signals lock at candle close, and can you exit via a trial or refund?
PipTrend’s 3-day free trial and 30-day money-back guarantee, AlgoXpert’s 7-day trial, and Flux Charts’ monthly-plan refund all let you verify before committing.
Skip anything that offers neither proof nor an exit.
Risk Disclaimer: Trading involves risk. Past performance doesn't guarantee future results. Only trade with money you can afford to lose. PipTrend is a tool to assist your trading decisions, not financial advice.