On this page
What VWAP Really Tells You
Ask a pension fund trader why they care about a single blue line on an intraday chart, and the answer has nothing to do with technical analysis.
It’s about performance review.
If they fill a large order below the day’s volume-weighted average price, they beat the benchmark.
Above it, they underperformed.
That’s what VWAP is at its core: an execution benchmark used by institutions to judge whether they got a fair price.
It answers one question.
Where did the average share actually trade today, weighted by how much size went through at each level?
Most VWAP guides fail traders in the same way.
They show a chart where price touched VWAP and bounced, call it support, and stop there.
But the line touches happen dozens of times per session and the vast majority produce nothing tradeable.
A touch is not a signal.
Context turns it into one.
This article treats VWAP as one input inside a rule set. You’ll get a framework for reading whether the session is a trend day or a range day, because the same VWAP touch means opposite things in each. You’ll get defined entries, structural stop-loss placement, profit targets tied to real levels, and explicit invalidation rules that tell you when the idea is dead.
And you’ll get something most content on this topic skips entirely: the conditions under which the correct trade is no trade.
VWAP produces false signals routinely. In a choppy, range-bound market, price can cross the line eight or ten times in an hour, stopping out anyone treating each cross as a directional trigger.
The traders who make money with a VWAP trading strategy aren’t the ones who spot the most setups.
They’re the ones who filter hardest.
Every rule that follows exists to reduce the number of trades you take, not increase it.
VWAP Basics That Actually Matter
How VWAP Is Calculated
The formula is simple arithmetic, and understanding it explains most of VWAP’s behaviour. For each bar, you take the typical price (high plus low plus close, divided by three) and multiply it by that bar’s volume. Sum those values across the session, then divide by cumulative volume.
VWAP = Σ(Typical Price × Volume) ÷ Σ(Volume)
Two consequences follow immediately.
First, high-volume bars pull the line toward themselves far harder than quiet bars. A single institutional block print at 10:15 can drag VWAP more than twenty low-volume bars afterwards.
Second, VWAP gets progressively harder to move as the day goes on. By 3pm, the denominator is enormous.
This is why VWAP is jumpy in the first thirty minutes and nearly rigid into the close, and why early-session signals need wider tolerances than afternoon ones.
The session reset matters just as much. At the start of each trading day, both sums return to zero.
Yesterday’s data contributes nothing.
VWAP is a same-day memory, which is exactly why it’s an intraday trading tool rather than a trend indicator.
VWAP vs Moving Averages
People lump VWAP in with the 20-period EMA because both are lines that price oscillates around. They’re built on fundamentally different information.
| Attribute | VWAP | Simple/Exponential Moving Average |
|---|---|---|
| Input data | Price and volume together | Price only |
| Lookback | Cumulative from session open | Fixed period (e.g. 20 bars) |
| Continuity | Resets every session | Continuous across days |
| Sensitivity late in day | Very low (large denominator) | Constant throughout |
| Primary use | Institutional execution benchmark | Trend smoothing and crossovers |
An EMA on a 5-minute chart weights the last twenty bars regardless of whether 400 shares or 4 million traded.
VWAP doesn’t care about bar count. It cares about where the money actually changed hands.
That’s the practical edge.
A moving average tells you the average of recent prices. VWAP tells you the average price of recent participation.
Session Settings Change Everything
Here’s a mistake that quietly ruins backtests and live trades alike: mismatched session settings.
If your VWAP is calculated from regular trading hours only (9:30am to 4:00pm ET for US equities) but your chart displays pre-market and after-hours bars, the line will start at the 9:30 open while price has already been moving for hours.
Flip the settings and you get a completely different line on the same chart.
On a stock that gapped up 6% pre-market on earnings, the extended-hours VWAP can sit several percent below the regular-hours VWAP.
Two traders looking at “VWAP support” are looking at two different prices.
The default recommendation: use regular trading hours VWAP with regular trading hours charts. That’s what the institutional algorithms executing large orders are benchmarking against, which is precisely why the level attracts reactions.
Extended-hours VWAP has a narrow use case: gap plays where overnight volume was genuinely heavy. Otherwise the thin pre-market prints distort the typical price calculation and give you a line nobody else is watching.
The VWAP Trading Playbook
Every rule below assumes you’ve already answered one question: what kind of day is this? Get that wrong and even perfect execution loses money, because trend-day rules applied to a range day produce a stream of small stop-outs.
Trend Day or Range Day?
The first ninety minutes tell you almost everything. Read them properly and you’ve filtered out half your losing trades before placing one.
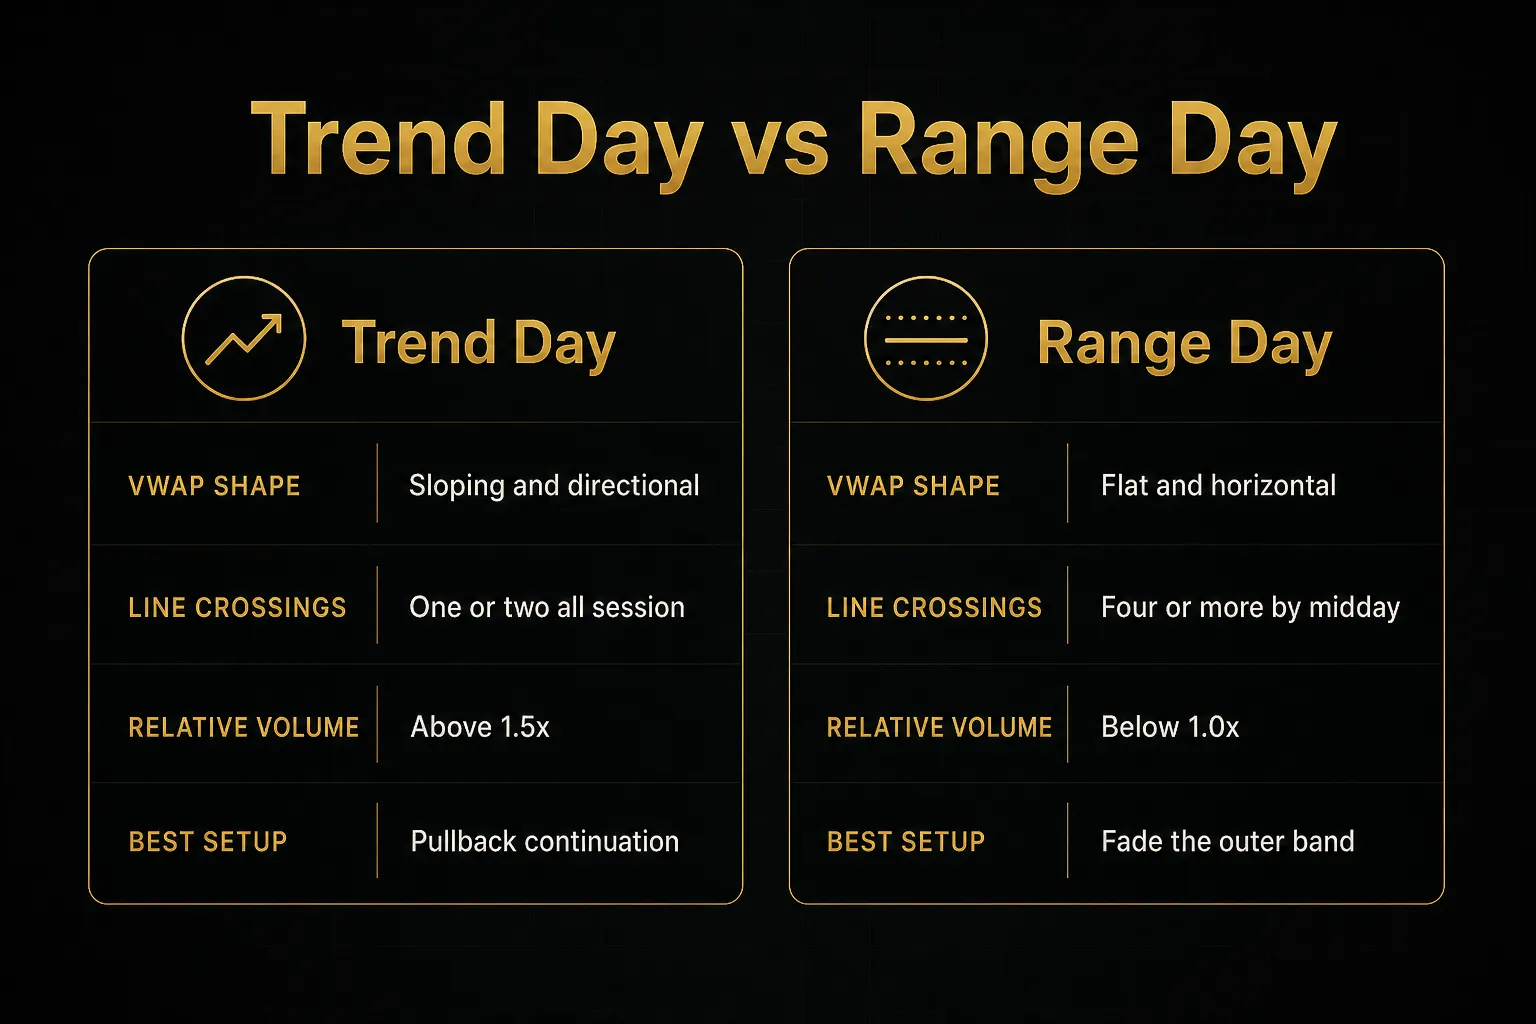
- Trend day clue #1: the opening range breaks with expanding volume. Price clears the first 15 or 30-minute range and the breakout bar carries relative volume of 1.5x or more versus the same time of day over the past twenty sessions. Volume that dries up on the break is a warning, not a confirmation.
- Trend day clue #2: VWAP develops a visible slope. On a genuine trend day, the line angles up or down and keeps angling. A flat VWAP by 11am rarely produces a clean trend afternoon.
- Trend day clue #3: price respects the line without piercing deeply. Pullbacks touch VWAP or come within a few ticks, then reverse. Two or three clean holds in a row is confirmation that the benchmark is being defended.
- Range day clue #1: VWAP flattens and price oscillates across it. If price has crossed the line four or more times in the first two hours, you’re in a range-bound market. Continuation setups will fail.
- Range day clue #2: the opening range holds. Breakout attempts fail back inside within two or three bars, repeatedly. Each failure adds evidence.
- Range day clue #3: relative volume sits below 1.0. Quiet sessions mean-revert. Loud sessions trend. That correlation isn’t perfect, but it’s strong enough to act as a filter.
Pullback and Breakout Rules
These are the two workhorse setups.
Both require volume confirmation.
Neither works without trend-day context.
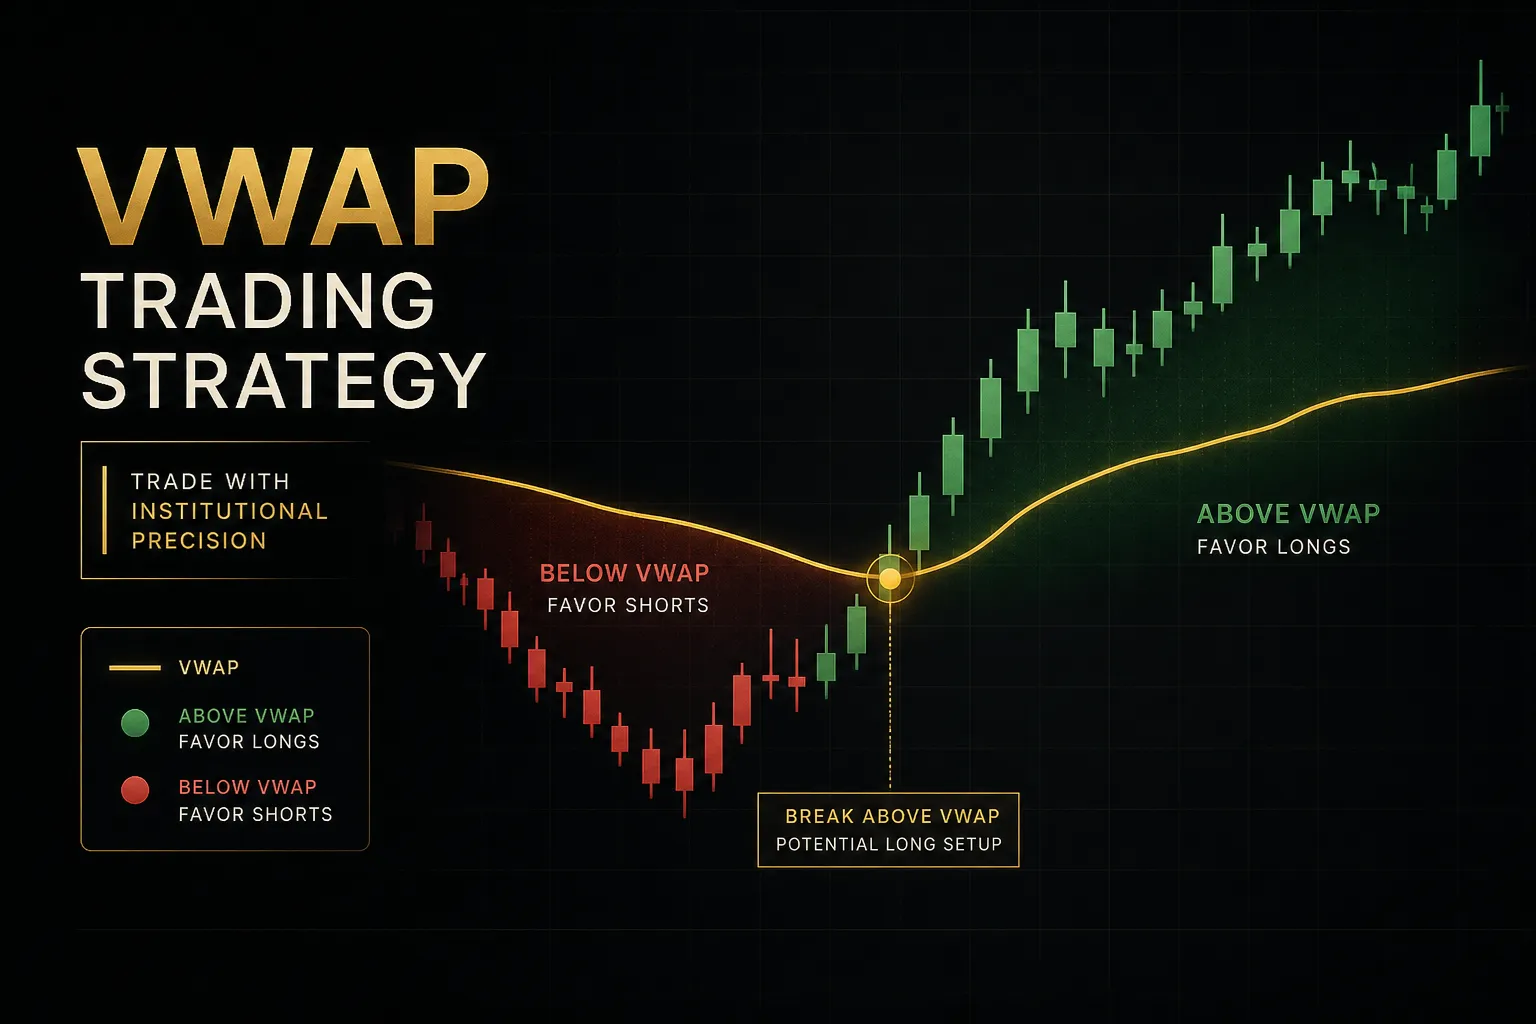
- Pullback continuation entry. With price trending above a rising VWAP, wait for a retest of the line where volume on the pullback bars is visibly lower than on the preceding impulse. Enter on the first bar that closes back above VWAP after the touch. Declining volume into the retest means sellers aren’t committing.
- Pullback stop-loss placement. Place the stop beyond the most recent swing low, not a fixed distance under VWAP. Structure defines risk. If that swing low is so far away the trade fails your risk-to-reward test, skip it.
- Pullback profit target. Use the prior session high (for longs) or low (for shorts) as the primary target, with the session’s opening range extension as a secondary scale-out level. These are places where real orders sit.
- Pullback invalidation. If price closes back through VWAP on rising volume, the setup is dead. Exit. Don’t wait for the stop, because a high-volume rejection of the benchmark usually means the institutional bid has stepped away.
- Breakout entry. After a period of consolidation around VWAP, enter on the close of a bar that clears the line decisively with relative volume above 1.5x. A wick through VWAP is not a break. Require a close.
- Breakout stop. Place it just inside VWAP, on the opposite side of the break, typically 0.1% to 0.3% depending on the instrument’s average true range. Tight stops are acceptable here because the entry trigger is high-conviction.
- Breakout target. Measure the opening range height and project it from the breakout point. If the 30-minute opening range was $1.20 wide, the first target is $1.20 above the break level.
- Breakout invalidation. Immediate reversion back through VWAP within one or two bars kills it. Failed breakouts often reverse hard, so exit rather than hope.
- Universal filter: require 1.5:1 minimum. Measure the distance from entry to structural stop, then to realistic target. Below 1.5:1, the setup doesn’t get taken regardless of how good it looks.
Reversal and Mean-Reversion Setups
This is where most traders lose money with VWAP, and the reason is a single misread: assuming that a touch of VWAP from below is automatically a bounce.
In a strong downtrend, price rallying up into a declining VWAP is frequently a continuation short, not a reversal long. Sellers who missed the initial move use the benchmark as their entry.
You’re buying into their supply.
- Tell #1: volume on the rally. A genuine reclaim setup shows expanding volume as price pushes through VWAP. A failing bounce shows weak, declining volume all the way into the line. Weak volume into resistance is the clearest short trigger available.
- Tell #2: market structure. Ask whether the rally has produced a higher high on the 5-minute chart. If price is still making lower highs and lower lows while approaching VWAP, the downtrend is intact and the line is resistance.
- Tell #3: time spent at the line. Price that grinds sideways at VWAP for several bars is building a base. Price that spikes into it and immediately rejects is being sold.
- Mean reversion belongs to range days only. On a flat-VWAP session, fading extensions at the outer VWAP bands back toward the line is a legitimate strategy. Target the line itself, stop beyond the band. On a trend day, this same trade is a repeated donation.
- Add a momentum filter. RSI divergence at the band, or a clear loss of momentum on the extension bar, raises the quality of a mean-reversion entry considerably. Without it, you’re guessing at exhaustion.
- Confirm across timeframes before committing. Multi-timeframe tools such as PipTrend’s VWAP entry levels and trend-alignment table let you check whether a 5-minute pullback agrees with the 15-minute and hourly bias, which is often the difference between a genuine continuation and a bounce that’s about to fail.
One habit separates consistent VWAP traders from the rest. They write down which of the three tells is present before entering.
If fewer than two agree, no trade.
Beyond the Line: VWAP Bands and Anchors
Standard Deviation Bands
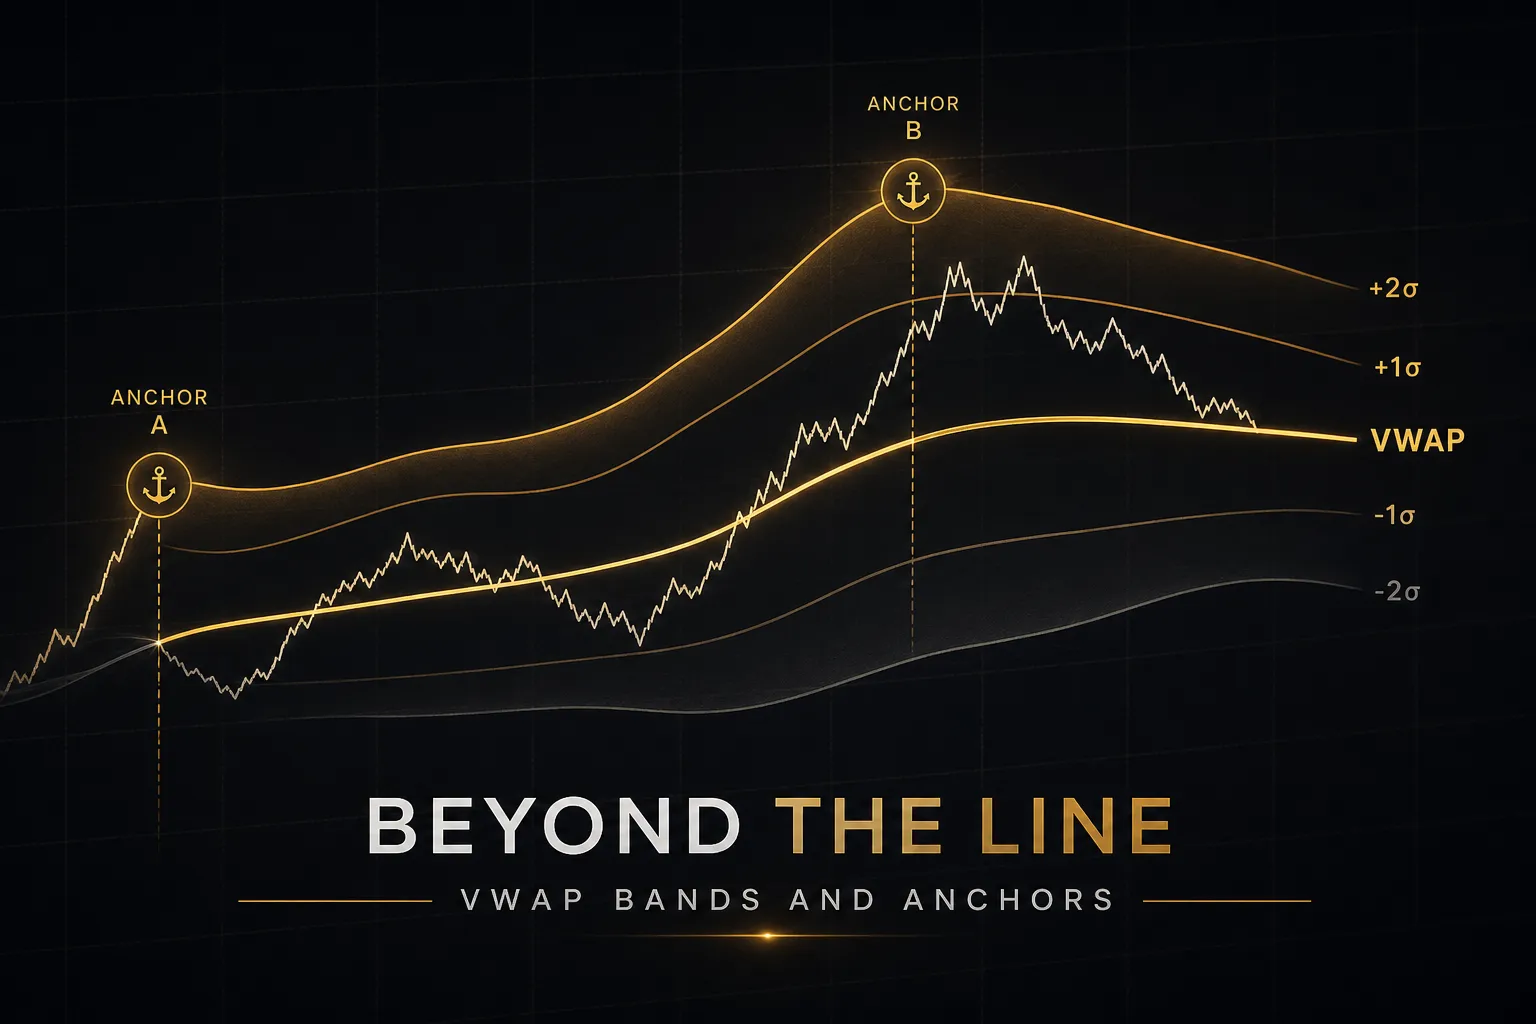
VWAP bands plot statistical extension, not overbought or oversold conditions. They’re calculated as one, two, or three standard deviations of price from VWAP over the session, and they answer a narrow question: how unusual is the current distance from fair value?
Unusual is not the same as wrong.
On a genuine trend day, price can ride the upper first band for hours, occasionally tagging the second, and never touch VWAP. Traders who short the second band on principle get run over on exactly the days that offered the largest moves.
The bands describe how the session is distributed.
They don’t predict reversion.
Where they earn their keep: on flat-VWAP range days, the outer bands mark the practical edges of the day’s support and resistance. Fading a two-standard-deviation extension back toward the line on a low relative volume session is a defensible mean reversion trade with a clean stop.
A useful diagnostic.
If price is closing outside the first band repeatedly, the day is trending and you should be looking for pullback entries, not fades.
Anchored vs Rolling VWAP
Session VWAP resets at the open.
But the anchor point is arbitrary, and moving it deliberately is where VWAP becomes a swing-trading tool.
| VWAP Type | Anchor Point | Best Used For | Typical Timeframe |
|---|---|---|---|
| Session VWAP | Daily open | Intraday execution and bias | 1 to 5 minute charts |
| Anchored VWAP | Earnings gap, news event, swing high/low | Tracking cost basis since a specific event | 15 minute to daily |
| Rolling VWAP | Trailing N periods (e.g. 5 days) | Smoothed multi-day fair value | Hourly to daily |
| Weekly/Monthly VWAP | Week or month open | Higher timeframe institutional reference | Daily charts |
Anchored VWAP shines after a defining event.
Anchor to the earnings gap candle and you’re tracking the average price paid by everyone who traded since the news broke. When price returns to that level weeks later, buyers from the gap are back to breakeven, and their behaviour there is genuinely informative.
Rolling VWAP avoids the reset problem entirely. A five-day rolling VWAP gives you a continuous volume-weighted reference without the discontinuity every morning, which suits multi-day position management better than a session line.
VWAP in Forex and Crypto
Forex has no centralized exchange, which means there is no true consolidated volume figure. What your platform shows as volume is tick volume: the number of price changes in a bar, sourced from your specific broker’s feed.
Tick volume correlates reasonably well with actual traded volume in liquid pairs, with studies putting the relationship above 0.8 in majors like EUR/USD.
It’s a proxy, not the real thing.
Two brokers will produce two slightly different VWAP lines on the same pair.
Crypto has real volume, but it’s fragmented across exchanges. A Binance VWAP and a Coinbase VWAP for the same asset can diverge meaningfully during volatile periods, and neither represents the whole market.
Then there’s the session problem.
Both markets trade continuously, so a midnight calendar reset is arbitrary and often lands in the quietest hours of the day.
The better approach in 24-hour markets: anchor VWAP to a meaningful session open rather than a calendar day. For forex, the London open at 8am GMT or the New York open at 8am ET captures the liquidity surges that actually matter. For crypto, anchoring to a major weekly open, a specific breakout candle, or a significant swing point produces far more relevant levels than a rolling midnight reset ever will.
Risk Rules and Backtesting VWAP
Position Size and Stop Placement
A VWAP setup with a 70% win rate loses money if the losers are twice the size of the winners.
Risk rules come before entry rules, always.
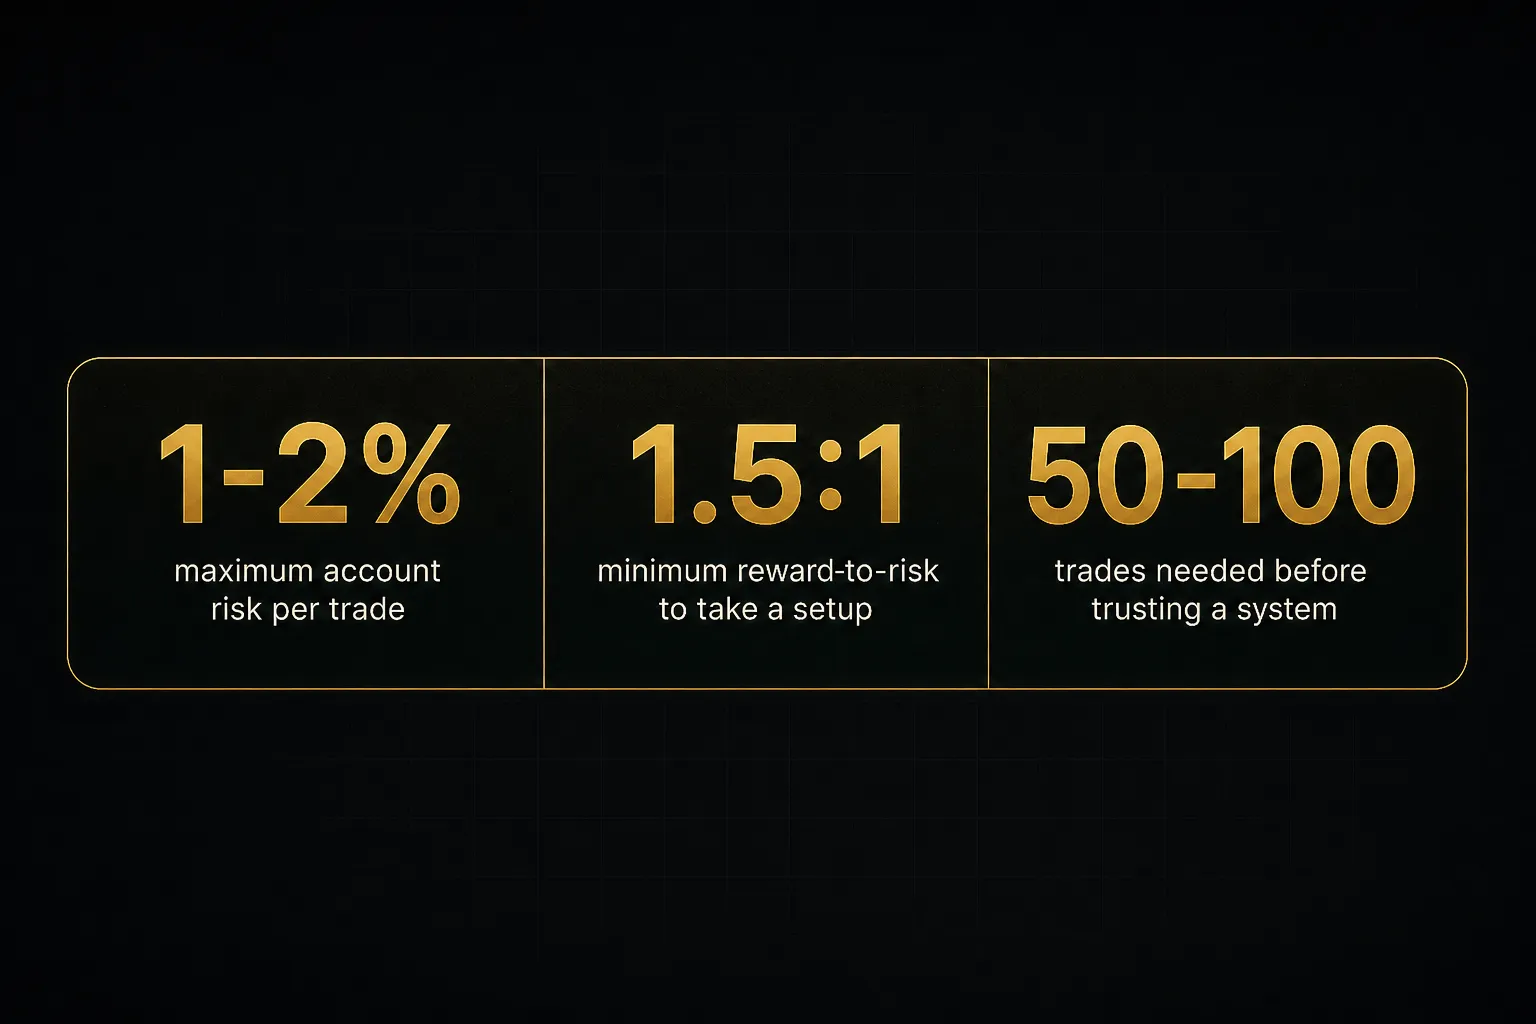
Cap risk at 1% to 2% of account equity per trade. For most traders working toward consistency, 1% is the right number.
At 1% risk, a brutal ten-trade losing streak costs roughly 9.6% of the account. At 3%, the same streak costs 26% and the recovery math turns ugly fast.
Size from stop distance, never from a fixed share count. The formula: position size equals dollar risk divided by the distance from entry to stop.
A $50,000 account risking 1% has $500 to lose. If the structural stop sits $0.40 below entry, that’s 1,250 shares. If the stop needs $1.20 of room, it’s 417 shares.
Stops belong at structure, not at a round number below VWAP.
The relevant question is: what price proves this idea wrong? For a pullback long, that’s below the swing low that formed during the retest. For a breakout, it’s back inside VWAP where the break failed.
Then apply the filter.
Measure from entry to that structural stop, measure from entry to a realistic profit target at prior session high, opening range extension, or the outer band. If the risk-to-reward ratio is below 1.5:1, pass.
There will be another setup.
Avoiding Backtest Illusions
Most VWAP backtests are fiction, and three specific errors explain why.
Look-ahead bias is the worst offender.
Scrolling a chart and deciding “I’d have entered here” uses information you couldn’t have had at the time, including the shape of bars that hadn’t closed yet. The fix is bar-by-bar replay, where the chart advances one candle at a time and you commit to entries before seeing what happens next.
Survivorship bias hides in your symbol list. Testing a VWAP strategy on today’s most liquid names ignores every stock that was liquid two years ago and has since collapsed or delisted.
Your sample is pre-selected for success.
Unrealistic fills quietly inflate every result.
Assuming you got filled at the exact VWAP touch, with zero slippage, on a fast-moving breakout bar, is fantasy. Build in one to two ticks of slippage per side plus commissions, and re-run the numbers.
Marginal strategies die at this step, which is the point.
Test any VWAP setup across at least 50 to 100 trades before risking real size. Below 50, you cannot distinguish edge from luck.
Track two metrics together: win rate and average R multiple.
A 45% win rate with an average winner of 2.2R is a strong system. A 65% win rate with an average winner of 0.8R is a slow bleed.
Reserve at least 30% of your data as out-of-sample and only look at it once, after the rules are locked.
VWAP Questions Traders Ask
Is VWAP a good trading strategy?
VWAP works best as a confirmation tool alongside volume and market structure, not as a standalone strategy. Used on its own, it generates too many false signals, particularly on range days where price crosses the line repeatedly.
Its real strength is context.
When VWAP bias, relative volume, and structure all point the same direction, the setup quality jumps significantly. When they conflict, the correct action is to stand aside.
What is the best VWAP setting for day trading?
Regular trading hours VWAP on a 1 to 5 minute chart is the standard default for intraday setups. Regular hours matter because that’s the benchmark institutional execution algorithms are measured against, which is what gives the level its magnetism.
Add one and two standard deviation bands for extension context. Make sure your chart’s session display matches your VWAP calculation setting, or the line will be plotted against data it wasn’t built from.
How do you trade when price crosses VWAP?
A raw cross of VWAP is not a signal until volume and structure confirm it. Whipsaws are extremely common in range conditions, where price can cross the line eight or more times in a single session.
Require three things: a bar that closes beyond VWAP, relative volume above 1.5x on that bar, and agreement from market structure such as a higher high on longs. Miss any one of those and the cross is noise.
What is the difference between VWAP and EMA?
VWAP resets daily and weights price by volume, while an EMA runs continuously and uses price alone. That makes VWAP a session-specific fair-value benchmark and the EMA a general trend smoother.
Practically, VWAP reflects where the money traded, and an EMA reflects where the price traded. For intraday work referencing institutional execution, VWAP is the more relevant reference. For multi-day trend tracking, the EMA is better suited.
Can you use VWAP for swing trading?
Session VWAP is primarily an intraday tool because of the daily reset, but anchored VWAP extends its usefulness to swing trading. Anchoring from a significant swing high, swing low, earnings gap, or news event creates a continuous cost-basis line that stays relevant for weeks or months.
Rolling VWAP over five or twenty days offers another swing-friendly option, giving a smoothed volume-weighted reference without the morning discontinuity.
What does VWAP tell you about institutional buying and selling?
Persistent trade above VWAP on strong volume suggests sustained institutional accumulation, since large buyers are willing to pay above the day’s average price. That’s a sign of urgency on the bid.
Repeated rejection at VWAP from below suggests distribution or profit-taking, with sellers using the benchmark as their exit.
Watch how price behaves on the third or fourth test in particular. Weakening reactions at the line usually precede a decisive move through it.
Trade the Context, Not the Line
The decision rule fits in one sentence.
Take VWAP setups only when trend-or-range context, volume, and market structure all agree, and stand aside when any of the three disagrees.
That’s it.
Everything in this rulebook exists to serve that single filter.
Here’s tonight’s exercise, and it takes twenty minutes.
Pull up your last ten VWAP trades. For each one, mark two boxes: did the entry have volume confirmation, and did market structure agree with the direction?
Then compare the results.
Most traders find something uncomfortable but useful. The trades where both boxes were ticked carry the whole P&L, and the trades where neither was ticked account for the bulk of the damage.
You don’t need a better indicator.
You need to stop taking the setups you already know were low quality.
VWAP’s value doesn’t come from the line. It comes from the discipline to ignore most of what the line does.
Price will touch VWAP dozens of times today. Perhaps two of those touches will be worth a position.
The skill being developed here isn’t pattern recognition, it’s selectivity, and selectivity is the one edge that compounds across every strategy you ever trade.
Risk Disclaimer: Trading involves risk. Past performance doesn't guarantee future results. Only trade with money you can afford to lose. PipTrend is a tool to assist your trading decisions, not financial advice.