Volume Profile Indicator Explained for Retail Traders
On this page
Why Volume Profile Confuses So Many Traders
Most indicators answer the question “what happened over time?” The volume profile indicator answers a different one: “what happened at each price?”
That single shift trips people up.
Standard volume bars sit under the chart and tell you how much traded during each five-minute or daily candle. Volume profile takes the exact same data and stacks it sideways, showing volume at price as a horizontal histogram.
Suddenly you can see that 40% of a session’s activity happened inside a 12-tick band, and almost nothing happened in the 30 ticks above it. That’s genuinely useful information about where the market found agreement.
Here’s where it goes wrong.
A trader spots a fat high-volume node, labels it support, and buys the touch. Or spots a thin low-volume node, assumes price will rocket through it, and chases.
Both trades treat a description of past activity as a prediction of future behavior.
It isn’t one.
A profile tells you where transactions occurred, not who was aggressive, and certainly not what happens next.
Volume profile is a map of where the market has been comfortable. Maps do not tell you which direction the traffic will move tomorrow.
This guide covers the mechanics properly: how the point of control (POC) is defined, how the value area gets calculated with the 70% rule, what value area high (VAH) and value area low (VAL) actually represent, and how to read nodes without pretending they are guaranteed turning points.
Then the part most tutorials skip.
Context and confirmation.
How to tell whether a level is being defended or simply passed through, why settings change everything, and how to build a repeatable process instead of collecting screenshots of the times it worked.
What Volume Profile Actually Measures
Four tools sit in the same family, and traders mix them up constantly. Volume profile, standard volume, market profile (TPO), and VWAP all describe activity, but they plot fundamentally different things on different axes.
The table below lays out what each one measures, how it’s oriented, and where it breaks down. Footprint charts are included because they solve the one problem volume profile cannot.
| Tool | What It Plots | Axis Orientation | Typical Use Case | Biggest Limitation |
|---|---|---|---|---|
| Standard volume bars | Total contracts or shares traded per time bar | Vertical bars along the time axis | Spotting participation spikes on breakouts, news, and session opens | Says nothing about which prices absorbed the volume |
| Volume profile | Traded volume accumulated at each price level | Horizontal histogram along the price axis | Locating POC, value area, and high/low-volume nodes as reference zones | Aggregates buyers and sellers together; no directional information |
| Market profile (TPO) | Count of time periods that touched each price | Horizontal letter blocks along the price axis | Reading how long the market accepted a price, session shape, and rotation | Ignores trade size entirely; one tick and 10000 contracts count the same |
| VWAP | Volume-weighted average price from a chosen anchor | Single dynamic line across the chart | Benchmarking execution and gauging whether price is rich or cheap intraday | Compresses the entire distribution into one number |
| Footprint chart | Bid volume vs ask volume inside each individual candle | Numbers inside each price cell of each bar | Reading aggression, absorption, and volume delta at a level | Data-heavy, requires quality feed, hard to scan across long histories |
Volume Profile vs Standard Time-Based Volume
They use identical raw data.
That’s the key point.
A standard volume bar tells you 82,000 contracts traded between 10:00 and 10:05. It does not tell you whether those contracts filled across a 40-tick range or piled into a two-tick shelf. Volume profile takes that same 82,000 and redistributes it across every price the market touched in that window.
Think of it like rainfall. Time-based volume tells you how much rain fell each hour. Volume profile tells you where the puddles formed.
For breakout traders, that difference matters. Rising volume on a breakout candle is encouraging, but a profile showing that volume actually clustering above the old high is far stronger evidence of acceptance.
Volume Profile vs Market Profile (TPO)
Market profile came first. Developed at the Chicago Board of Trade in the 1980s, it plots time price opportunity letters, one per half-hour bracket, at every price the market visits.
It measures duration, not size. If price spent six half-hour brackets at 4520, that price gets six letters regardless of whether 200 or 200,000 contracts changed hands.
Volume profile measures the transactions themselves. In practice the two often produce similar POC locations, because time spent and volume traded tend to correlate.
But they diverge sharply around news events, where a huge burst of volume hits a price the market only visited for 90 seconds.
That divergence is informative. A volume POC with no TPO support suggests a violent, fast transaction zone rather than genuine market acceptance.
Volume Profile vs VWAP and Footprint Charts
VWAP gives you the average.
Volume profile gives you the whole distribution.
Both are anchored calculations built from the same inputs, and VWAP will usually sit close to the POC in a balanced session. In a skewed, trending session they separate, because VWAP drags with price while the POC can stay pinned to an earlier congestion shelf.
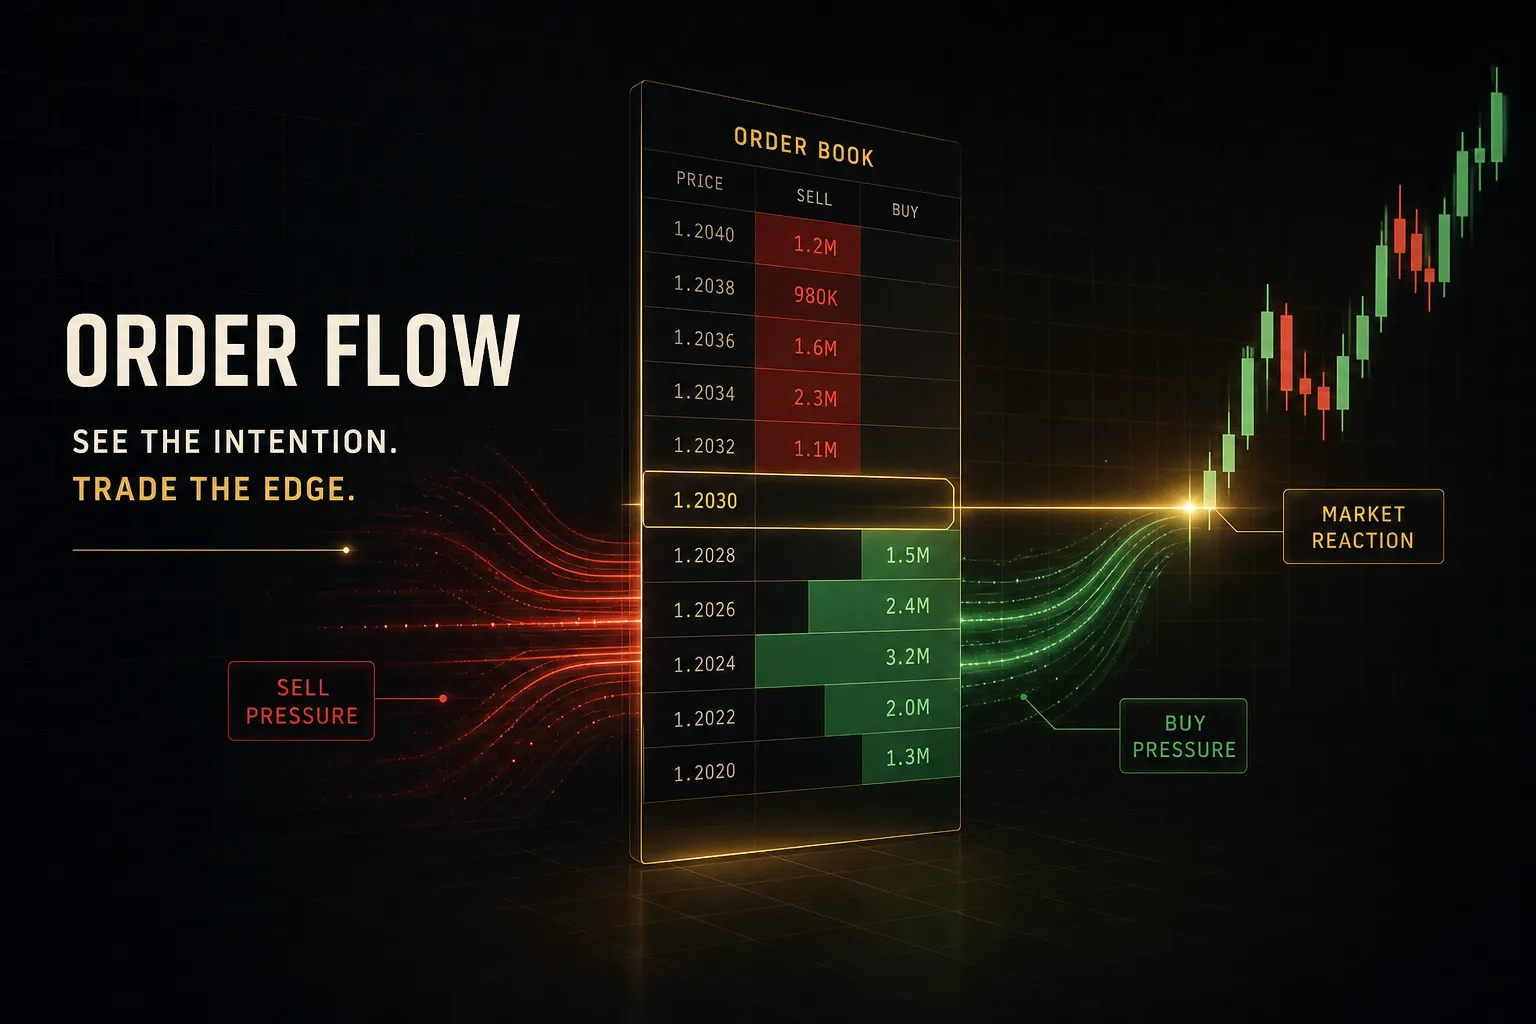
Footprint charts go the other direction. Instead of summarizing, they expand every candle into bid and ask volume at each price, exposing order flow detail that a profile deliberately aggregates away.
Volume profile tells you 30,000 contracts traded at 4518. Footprint tells you 21,000 hit the bid.
That distinction is the difference between “activity happened” and “sellers were aggressive and got absorbed.”
Decoding POC, Value Area, and Nodes
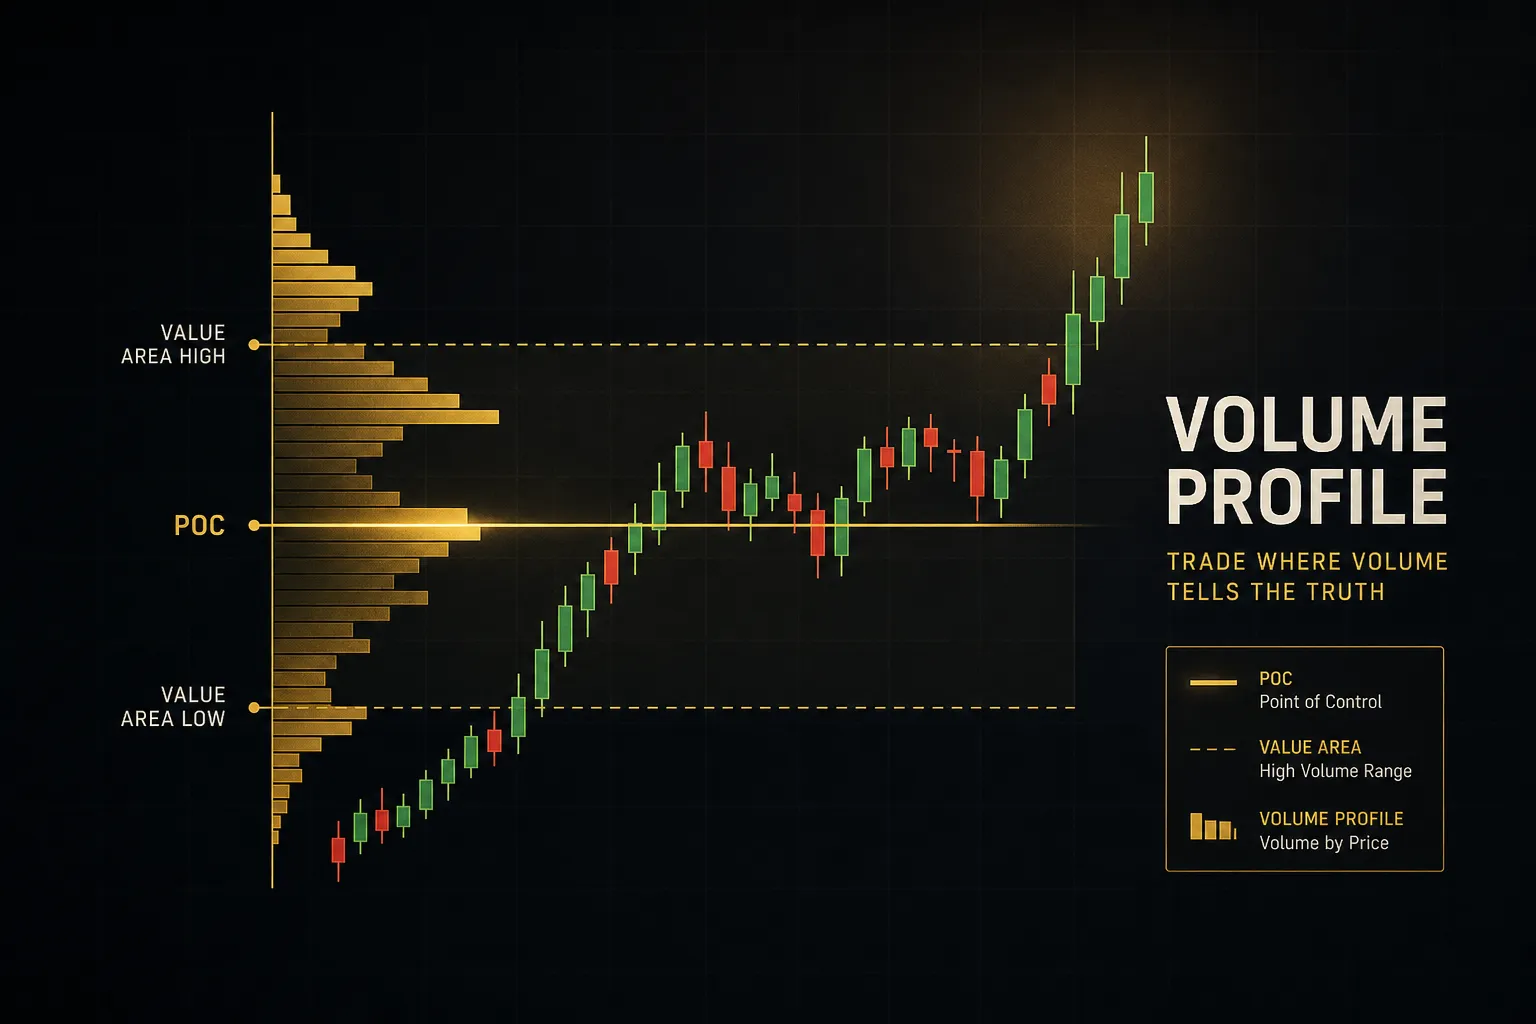
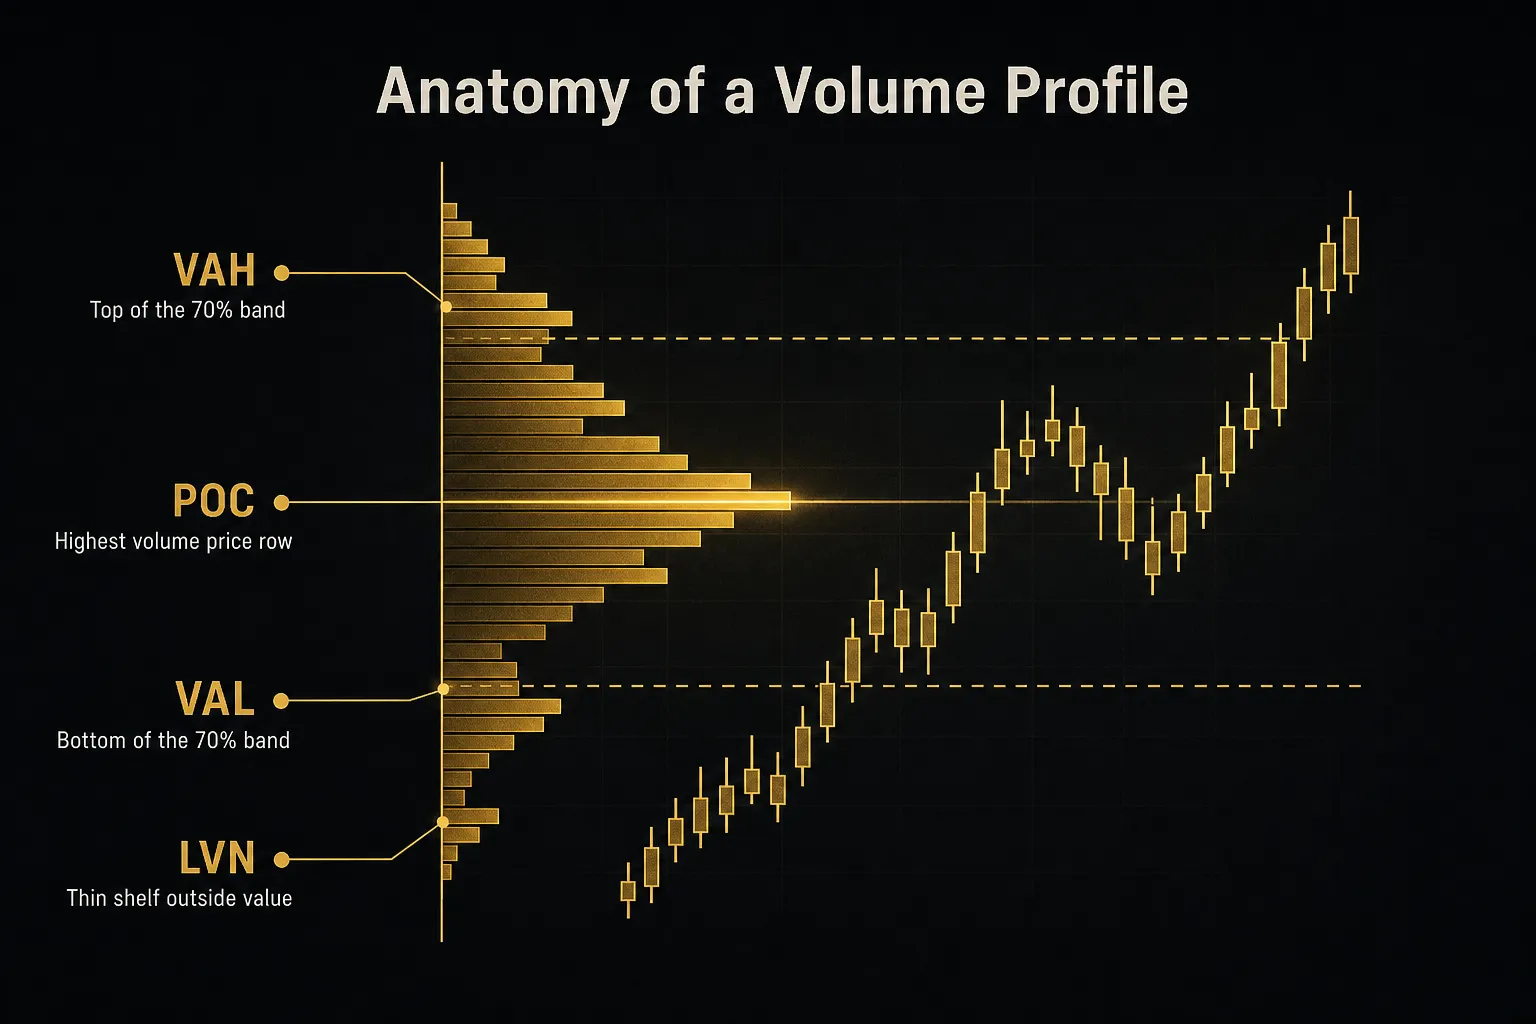
Every profile has one price where more volume traded than anywhere else. That’s the point of control, and it’s the anchor for everything else.
How the Value Area Is Calculated
The value area is the price range containing roughly 70% of the profile’s total volume. Most platforms use exactly 70%, borrowed from the one-standard-deviation convention in a normal distribution, though the setting is adjustable.
The calculation is mechanical:
- Start at the POC. Identify the single price row with the highest traded volume and add it to the value area.
- Compare the two rows above and the two rows below. Sum each pair.
- Add the larger pair. Whichever pair holds more volume gets absorbed into the value area.
- Repeat until you hit 70%. Keep expanding outward, pair by pair, until the enclosed volume crosses the threshold.
The highest price included becomes the value area high (VAH). The lowest becomes the value area low (VAL).
Everything outside is the remaining 30%, split between the tails.
That’s it.
No forecasting, no smoothing. Just an arithmetic description of where the bulk of business got done.
High-Volume and Low-Volume Nodes Explained
A high-volume node (HVN) is a price shelf where the histogram bulges out. Lots of contracts changed hands there, which means buyers and sellers repeatedly agreed that price was fair.
A low-volume node (LVN) is a pinch in the histogram. Price passed through quickly and few transactions occurred, which usually means one side rejected that area outright.
Now the part that gets skipped in most tutorials: neither is automatic support or resistance.
What HVNs and LVNs actually describe is the market’s past willingness to transact. The useful distinction is between market acceptance and market rejection.
Acceptance means price arrives at a level, stalls, builds range, and prints multiple bars there. Rejection means price arrives and leaves within a bar or two, often on a wick.
Here’s a failed level that plays out constantly.
A stock builds a fat HVN at $48.20 over three sessions, bouncing off it twice. On the fourth session, a sector downgrade hits. Price slices straight through $48.20 on triple average volume and closes 2% lower.
Did the level fail? No.
The level did exactly what a level does: it marked where prior agreement existed. The directional context changed, and a shelf built by two-sided balance offered no defense against one-sided aggression.
An HVN is not a floor. It is a record of a negotiation that has already concluded.
LVNs get the mirror-image treatment. Traders see a thin zone and assume price will accelerate through it.
Often it does.
But an LVN can equally act as a rejection shelf, where price approaches, fails to find any interest, and reverses without ever entering the gap.
Row Size, Timeframe, and Volume Data
Change your row size and your POC moves.
That should worry you more than it usually does.
Row size (or bin count) determines how finely volume is bucketed. On the E-mini S&P, a one-tick row size produces a jagged profile with dozens of micro-nodes. A five-point row size produces three smooth humps.
Same data, completely different levels.
Profile range does the same thing.
A session profile covering yesterday gives one POC. A composite profile covering the last three weeks gives another, often 40 or 50 points away.
Neither is wrong. They answer different questions.
Then there’s the data itself, which varies more than most retail traders realize:
- Exchange-reported volume is the gold standard. Futures and centrally listed equities report every matched trade to a single venue, so the profile reflects genuine transacted size.
- Tick volume counts price changes, not contracts. It’s a proxy, and it correlates reasonably well with real activity in liquid markets, but a single 500-lot and a single 1-lot both register as one tick.
- Base vs quote volume matters in crypto. A BTC/USDT profile can be built from BTC traded or USDT traded, and the two produce different node locations at different price levels.
- Broker-specific volume is what you get in spot forex. There is no central exchange, so your platform shows only the flow your broker saw.
That last point deserves emphasis.
Spot FX is OTC and fragmented across hundreds of liquidity providers, so there is no consolidated volume figure.
A EUR/USD profile from one broker will not match another’s. Many FX traders use CME futures volume as a cleaner reference instead.
Applying Profiles to Real Market Conditions
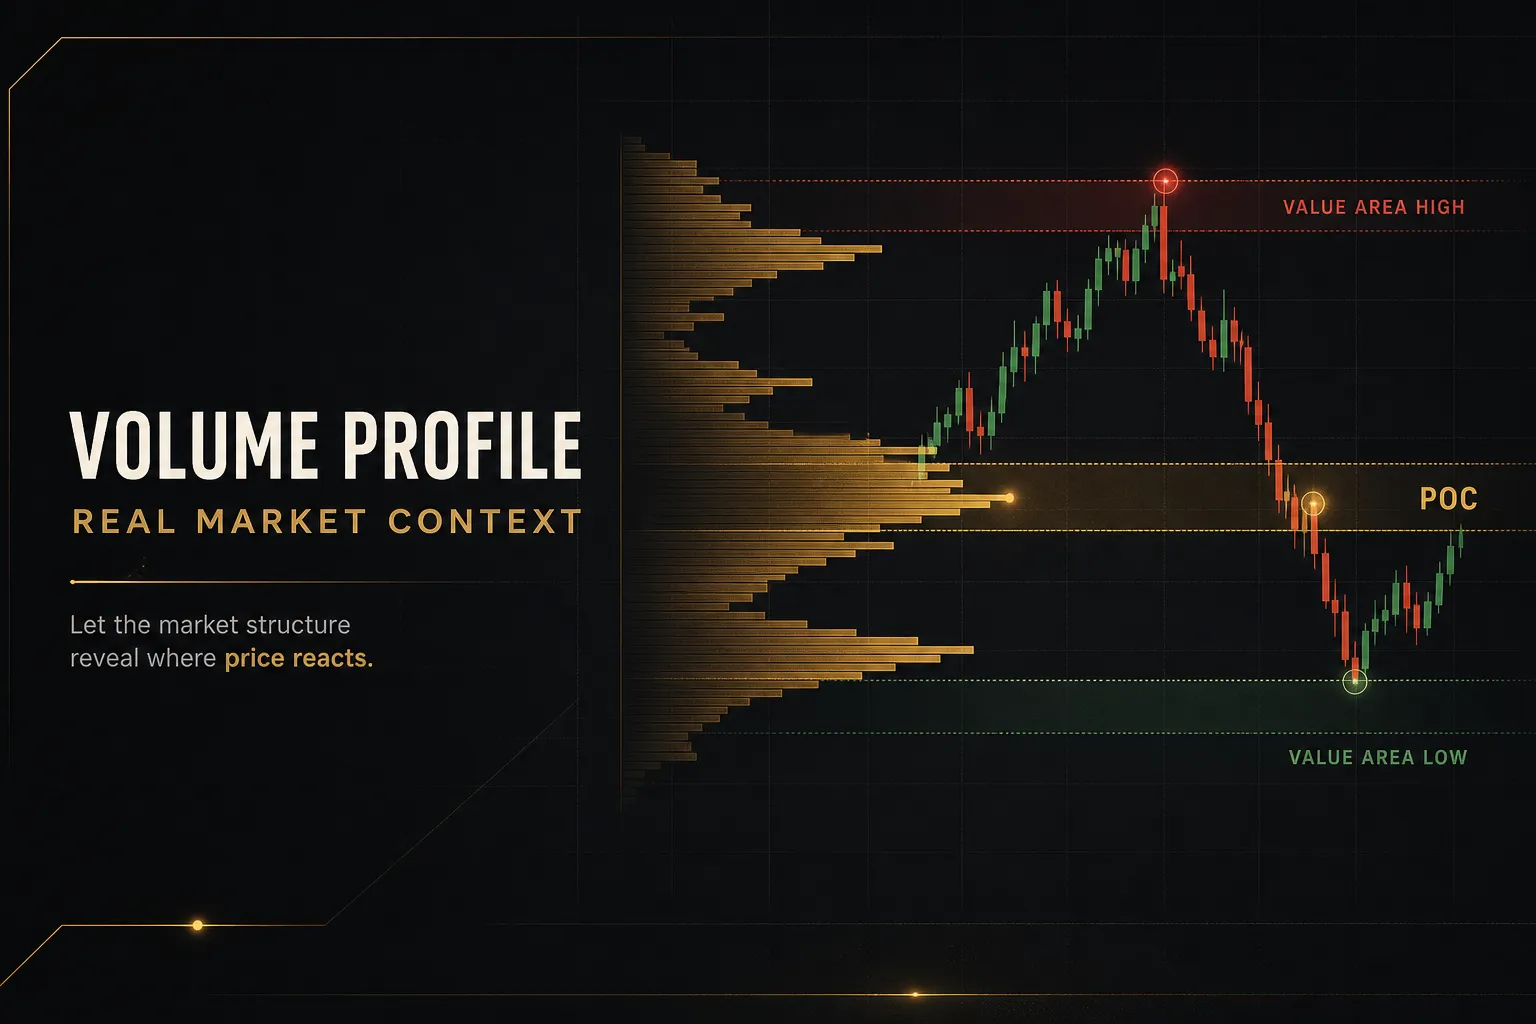
The same profile means different things depending on whether the market is balanced or trending. Read it wrong and you’ll fade a trend day at the VAH, over and over.
Support, Resistance, and the Acceptance Question
Balanced markets produce bell-shaped profiles. A fat middle, thin tails, POC sitting near the center of the range.
This is a market rotating around an agreed value, and it’s the environment where HVNs behave most like conventional support and resistance.
In balance, the logic holds up reasonably well. Price extends above VAH, finds no new buyers, rotates back toward the POC. Price probes below VAL, gets rejected, returns.
Roughly 70% of the session’s business happened inside that band for a reason.
Trending markets destroy that symmetry. The volume distribution skews into a P-shape or b-shape, sometimes stacking into multiple distributions as the market moves and re-balances at successively higher or lower prices.
In a trend, LVNs are air pockets, not reversal zones. They mark where price moved so fast that almost nothing traded, and a return to that zone often produces another fast move rather than a bounce.
The question to ask at every level is the same: is the market accepting this price or rejecting it? Acceptance looks like multiple closes inside the zone, contracting range, and volume building. Rejection looks like a spike through and an immediate return.
Breakouts, Rejections, and Trend Days
Four scenarios cover most of what you’ll encounter.
The gap into a prior LVN. An index gaps up 0.8% and opens directly inside yesterday’s thin zone above the value area. Because so little traded there, there’s minimal reference pricing, and the first 30 minutes often move violently in either direction.
This is a poor place to take a position on the open and a good place to wait for a shelf to form.
The clean breakout through VAH. Price pushes above yesterday’s VAH, and the developing profile starts building a new node above the old value area rather than immediately falling back. Volume expands, range expands.
That combination, a new node forming plus participation increasing, is what genuine breakout confirmation looks like.
The failed breakout. Price pokes above VAH on thin volume, prints two bars, then snaps back inside the value area and closes there.
Statistically this is one of the more reliable setups in profile trading, because a rejected extension often rotates all the way to the opposite side of value, giving a defined target and a workable risk-reward ratio.
The trend day. The profile is thin and elongated, value migrates in one direction all session, and there’s no meaningful rotation back to the POC.
On these days, fading the VAH is how accounts get damaged. Acceptance is one-directional, and each pullback to a developing node is a continuation opportunity rather than a reversal.
One warning that applies to all of them.
The developing POC and developing value area shift throughout the session. A POC at 10:30 is a provisional reading, not a fixed level, and it can migrate 20 points by the close.
Treat intraday profile levels as historical references only once the period has closed.
Choosing a Profile Type as a Beginner
Start with one profile.
Yesterday’s.
A fixed range volume profile covering the prior full session gives you three concrete numbers: POC, VAH, VAL. Mark them on today’s chart. Watch what happens when price reaches them.
That’s the entire exercise for the first month.
Once those levels feel intuitive, add layers in this order:
- Composite profiles spanning a week, a month, or a full consolidation range. These reveal larger structural shelves that intraday profiles miss entirely, and they’re where longer-horizon HVNs live.
- Anchored volume profile starting from a specific event: an earnings release, a central bank decision, a swing high. This isolates the volume distribution formed since the market repriced, which is often more relevant than an arbitrary calendar window.
- Visible range volume profile, which recalculates for whatever is on screen. Convenient for exploration, but dangerous as a decision tool, because scrolling changes your levels.
Resist the urge to display all four at once. A chart with fifteen horizontal lines guarantees that price will touch one of them, which feels like confirmation and is actually noise.
Confirming Levels Instead of Guessing
A profile level is a hypothesis. What you do next determines whether it becomes a trade or a donation.
Common Mistakes That Undermine Profile-Based Trades
These errors show up repeatedly, and each one is avoidable:
- Profiling thin instruments. On a stock trading 80,000 shares a day or an illiquid crypto pair, a single large order creates a node. The profile describes one participant’s activity, not market consensus, and the levels are effectively random.
- Treating news spikes as structure. A CPI release can dump enormous volume into a two-tick band in under a minute. That creates a visually impressive HVN that reflects panic execution, not negotiated value, and it rarely holds on retest.
- Over-optimizing row size. Adjusting bin count until the nodes line up with past reversals is curve-fitting with extra steps. If a level only appears at a row size of 37, it isn’t a level.
- Skipping invalidation. “I’ll buy the POC” is not a plan. Where is the stop? What price proves the level failed? Without that defined before entry, a losing trade becomes an open-ended position.
- Ignoring the wider trend. Buying VAL in a market making lower highs and lower lows across every higher timeframe is fading structure with a support level as an excuse.
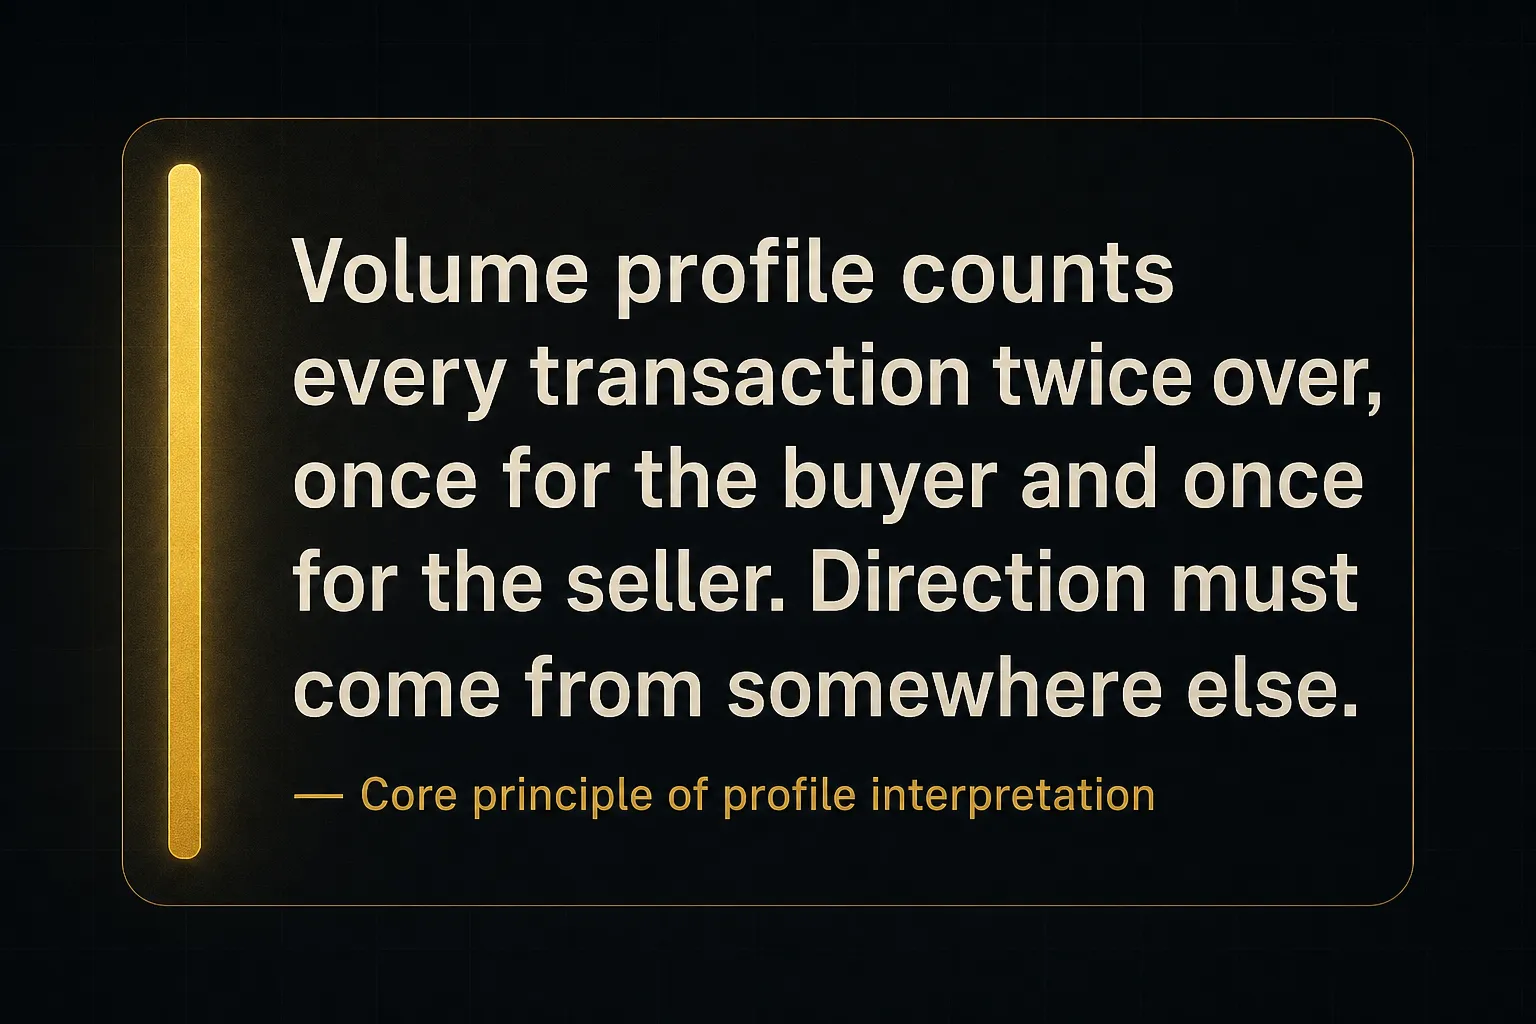
The underlying issue links all five. A profile shows where activity occurred.
It does not show which side was aggressive, because every contract has a buyer and a seller, and the histogram counts both identically.
To get direction, you need something else: market structure, a trend read, order flow tools like volume delta, or an independent directional signal.
Turning Levels Into a Repeatable Process
One convincing screenshot proves nothing.
A hundred logged outcomes prove something.
The workflow that separates a system from a hunch looks like this:
- Replay-test the level type. Use bar replay on historical data and record how price behaved at prior-session VAL across 50 instances on your chosen instrument. No forward-looking bias, no scrolling ahead.
- Define the rule precisely. “Long at VAL” is untestable. “Long on the first bar closing back above VAL after a probe below, stop 0.3 ATR under the low” is testable.
- Forward-test small. Run the rule in simulation or minimum size for at least 30 trades. Backtesting catches logic errors; forward testing catches execution and psychology errors.
- Journal every outcome. Record the level, the profile type, the row size, the wider trend direction, the result, and the maximum adverse excursion.
- Measure expectancy, not win rate. Average win times win rate minus average loss times loss rate. A 38% win rate with a 3:1 payoff beats a 70% win rate with a 0.3:1 payoff.
Many traders add a separate confirmation layer rather than trading profile levels in isolation. Tools like PipTrend’s multi-timeframe trend table and marked entry levels serve that role, letting you check whether a POC or VAH aligns with the broader directional bias before committing capital.
The division of labor matters here. PipTrend’s signal marks direction only. The entry still comes from a defined price level, which is exactly what a profile provides.
Direction from one source, location from another.
Volume Profile FAQ
Is volume profile a good indicator?
Volume profile is a strong contextual tool and a weak standalone signal. It reliably identifies where meaningful transaction activity has occurred, which makes it excellent for locating reference zones, planning targets, and understanding market structure.
What it cannot do is tell you direction, because it counts buyers and sellers identically. Traders who use it as an entry trigger on its own generally underperform those who pair it with a trend read or order flow confirmation.
What is the best setting for a volume profile indicator?
There is no universal best setting, and any template promising one should be treated with suspicion. Row size, lookback period, and value area percentage all need testing per instrument, session, and timeframe.
A practical starting point: use a row size roughly equal to the instrument’s average 5-minute range divided by four, keep the value area at the standard 70%, and begin with prior-session profiles before adding composites.
Then test.
If a level only exists at one specific bin count, you’ve curve-fit rather than found structure.
How do you read a volume profile chart?
Read it from widest to narrowest. Find the longest horizontal bar, which is the point of control, then identify the value area high and value area low that bracket roughly 70% of volume around it.
Next, look for bulges (high-volume nodes, where the market agreed on price) and pinches (low-volume nodes, where it rejected price quickly). Finally, ask the acceptance question at each zone: is price stalling and building range here, or passing through in one or two bars?
What is the difference between volume profile and volume?
Volume profile plots volume by price, while standard volume plots volume by time. Both use identical raw transaction data, just organized on different axes.
A standard volume bar tells you 50,000 shares traded during the 9:45 candle. A volume profile tells you 31,000 of those shares traded between $102.40 and $102.60. The first shows participation intensity, the second shows where that participation concentrated.
What is the difference between volume profile and market profile?
Volume profile measures how much traded at each price; market profile (TPO) measures how much time was spent at each price. Market profile assigns a letter to each price for every half-hour bracket the market visits, regardless of size traded.
The two usually produce similar shapes, because time and volume correlate in normal conditions. They diverge around news events, where huge volume hits a price the market barely visited, and that divergence itself is a useful signal about whether a level reflects genuine acceptance.
How do traders use POC, VAH, and VAL?
Traders use POC, VAH, and VAL as reference zones for entries, targets, and confirmation, not as standalone triggers. The POC often acts as a magnet in balanced conditions and a common profit target for mean-reversion trades.
VAH and VAL define the edges of accepted value, so extensions beyond them are watched for either acceptance (continuation) or rejection (rotation back toward the POC). The decision comes from how price behaves at the level, combined with the wider trend, not from the level being touched.
Treat Levels as Context, Not Verdicts
The whole framework collapses into one decision rule.
If price reaches a level and momentum slows, range contracts, and bars start stacking there, treat it as a possible reaction zone. That’s acceptance, and acceptance is where profile levels earn their keep.
If price cuts through with expanding range and expanding volume, the level was passed, not defended.
Nothing failed.
The market simply repriced, and your job is to update rather than argue.
One action for the next session.
Pull up your primary instrument, apply a fixed-range profile to the prior day, and mark three lines: POC, VAH, VAL.
Then watch.
Don’t trade them yet.
Note how price behaves on the first touch of each, and whether the reaction lines up with what the higher-timeframe trend was already telling you. Ideally, check that against an independent trend or entry signal before you risk a cent.
Do that for ten sessions and you’ll understand volume profile better than most people who’ve had it on their charts for years.
Sources
Risk Disclaimer: Trading involves risk. Past performance doesn't guarantee future results. Only trade with money you can afford to lose. PipTrend is a tool to assist your trading decisions, not financial advice.