Order Flow Trading Explained: A Trader's Practical Guide
On this page
Why Order Flow Confuses So Many Traders
Most traders open a footprint chart for the first time, see a grid of colored numbers, and quietly close it again.
The data is right there.
The meaning isn’t.
Order flow trading is the practice of reading executed trades and resting orders to judge who is currently more aggressive, buyers or sellers, in real time.
That’s the whole idea in one sentence.
The confusion starts because order flow is not one tool. It’s a family of them, each showing a different slice of market microstructure.
This guide walks through them in order: the depth of market (DOM), the footprint chart, volume delta, volume profile, and the time and sales tape. Then it covers the part almost nobody teaches properly, which is how to combine those readings with market structure and hard risk rules.
There’s one distinction that gets skipped constantly, and it causes more losses than any bad entry.
Displayed liquidity in the order book is not the same thing as executed trades.
A 500-lot bid sitting on the DOM is an intention, not a transaction. It can be pulled in milliseconds.
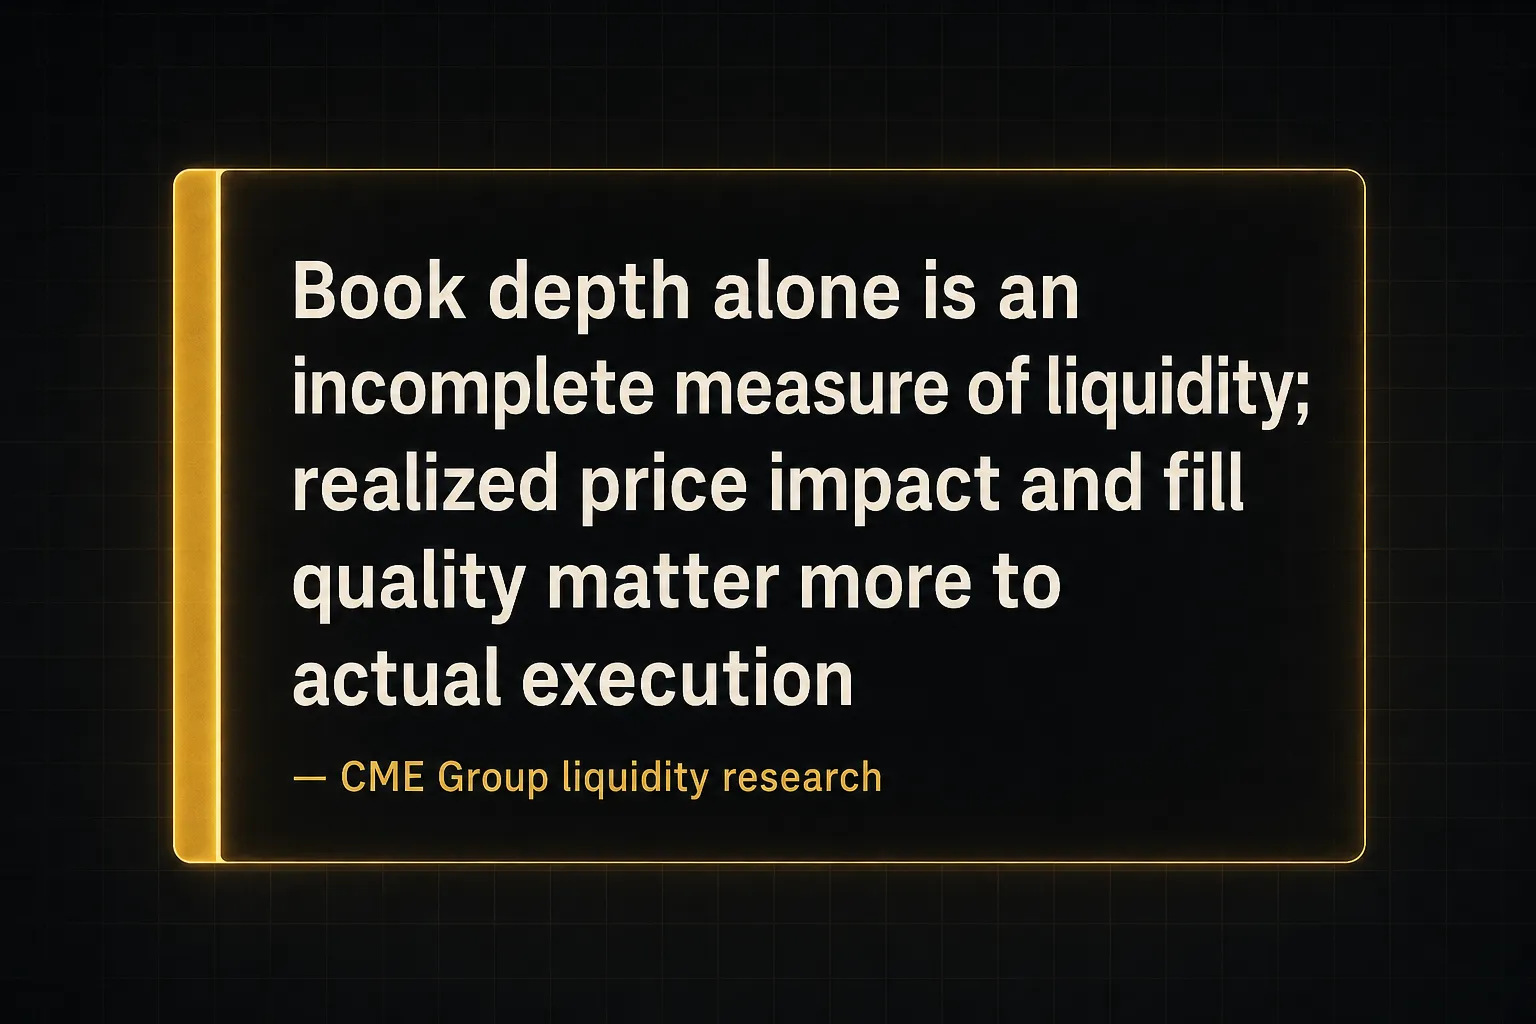
The CME Group’s own liquidity research makes this point about its markets: book depth alone is an incomplete measure of true liquidity, because what matters to a trader is the cost and quality of actual fills, not the size on screen. Depth, spread, and realized price impact tell three different stories.
Size on the screen is a promise. Size on the tape is a fact. Trade the facts.
So here is the honest framing this guide uses throughout: order flow works as confirmation over short horizons, usually seconds to minutes, not as a standalone prediction engine.
It tells you whether the aggressive side is getting paid at a level you already care about. It does not tell you which level to care about in the first place.
If you’re expecting a footprint pattern that reverses the market on command, this will disappoint you. If you want a way to time entries at levels your existing plan already identified, keep reading.
How Orders Create Price Movement
Price doesn’t move because of sentiment or news headlines. It moves because someone crossed the bid-ask spread and consumed every available contract at a price level, forcing the next trade higher or lower.
Market Orders vs Resting Limit Orders
Every trade in a central limit order book has two sides with opposite intentions.
One side is impatient.
The other is paid to wait.
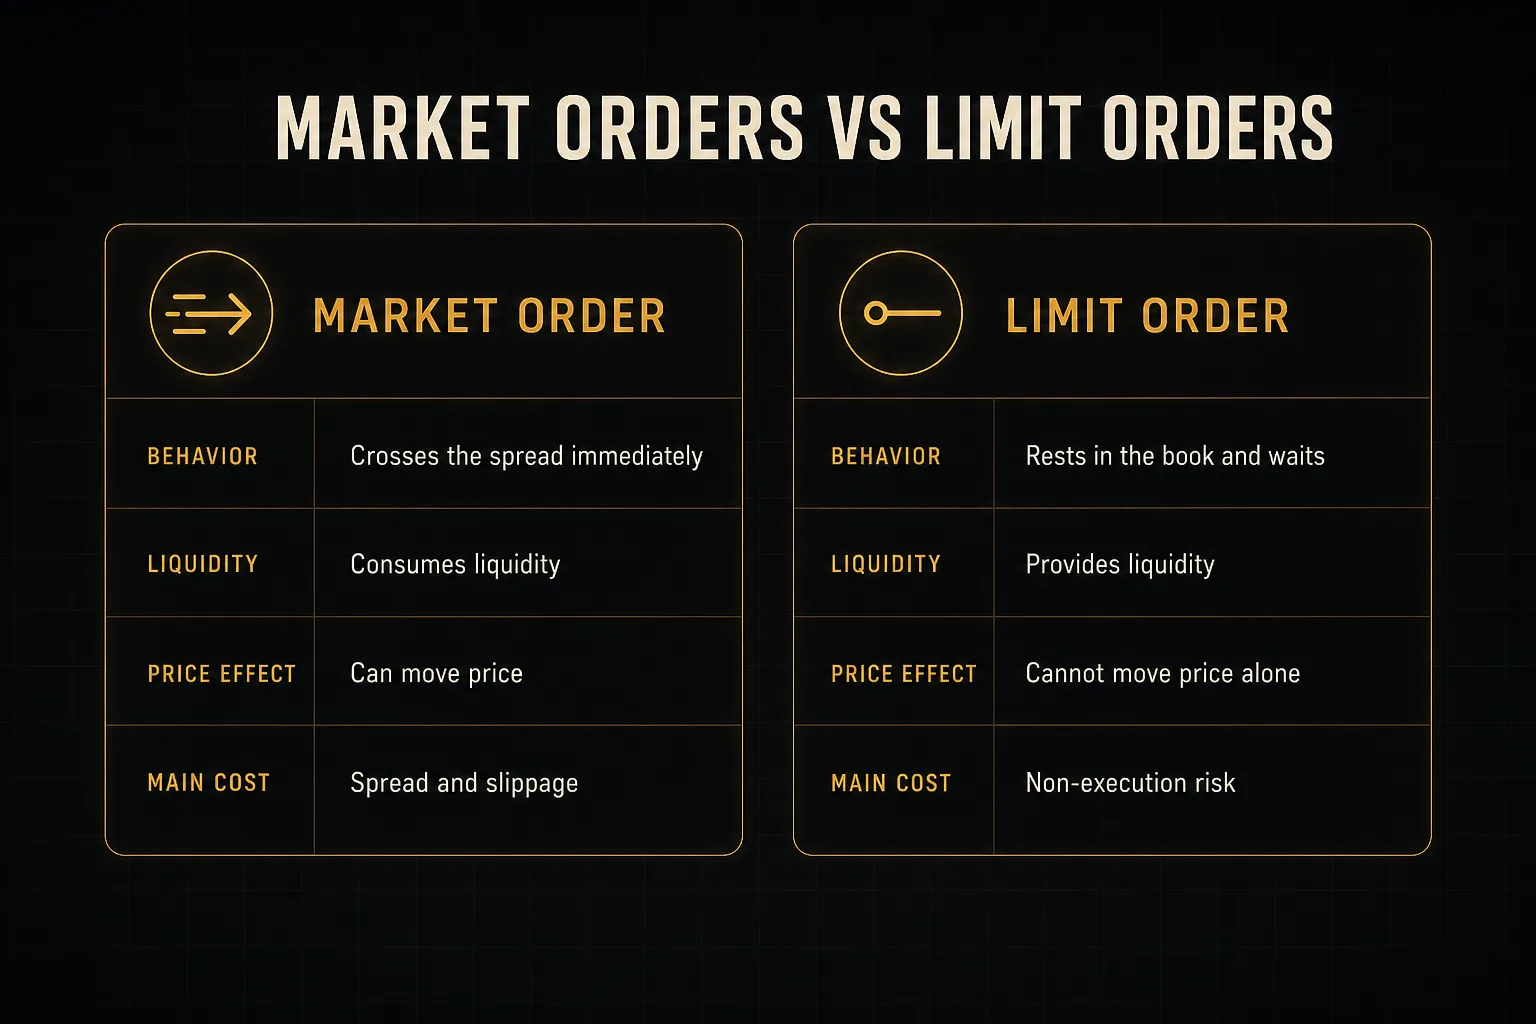
Market orders are aggressive. They hit whatever liquidity is available immediately, accept the spread as a cost, and are the only orders that can actually move price.
Limit orders are passive. They rest in the book at a chosen price, provide passive liquidity to the impatient side, and get filled only when someone comes to them.
The entire logic of order flow rests on that split.
Aggressive buyers lift the offer. Aggressive sellers hit the bid.
Everything else is bookkeeping.
What the DOM Really Represents
Here’s where new traders get burned.
Volume printed at the bid is not automatically “selling,” and volume at the ask is not automatically “buying.”
Footprint and delta tools classify volume by aggressor side. Volume printed on the bid means a market seller hit a resting buy limit order. So that print involves a seller and a buyer, and the tool records it as aggressive selling absorbed by passive buying.
Raw volume without that context is close to meaningless.
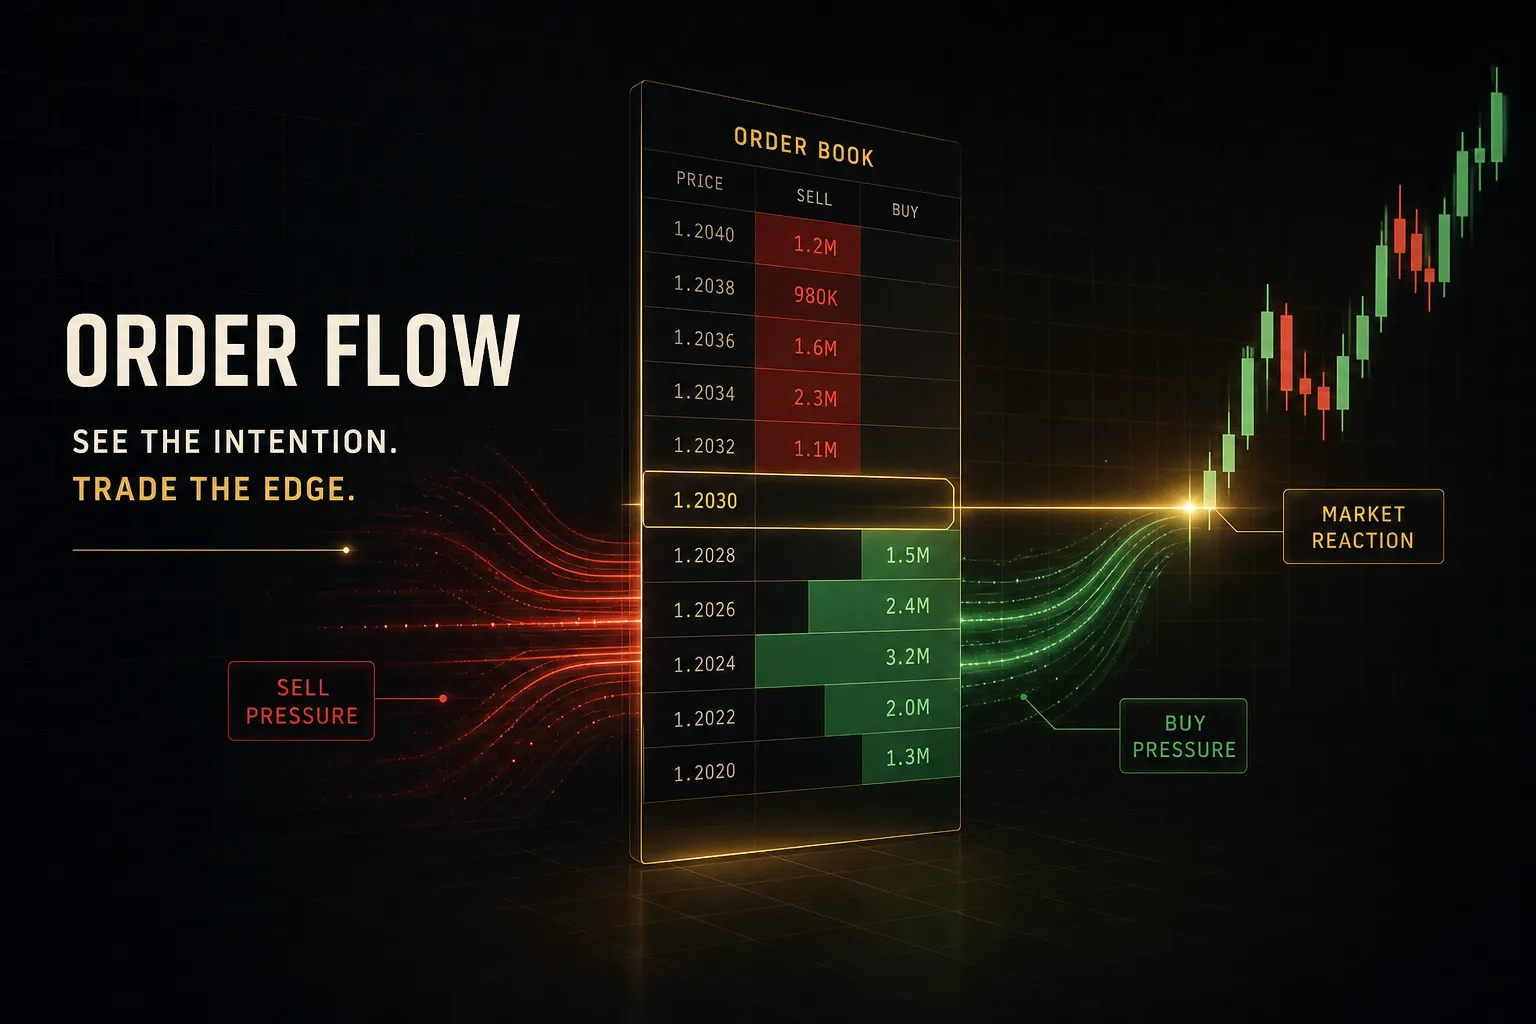
The depth of market display, or DOM, shows resting limit orders stacked at each price. It looks like a map of support and resistance.
It usually isn’t.
A large resting order is unreliable as support for four practical reasons.
Orders get cancelled the instant conditions change. Some displayed size is deliberate misdirection, which regulators call spoofing and which carries real enforcement history in the futures markets. Queue position means your own limit order may sit behind thousands of contracts and never fill. And in fast markets, liquidity simply evaporates before the price ever arrives.
Treat the DOM as a snapshot of current intentions with a shelf life measured in seconds.
Order Flow vs Volume Profile vs Price Action
Three tools, three questions.
Confusing them is why traders end up with five indicators saying the same thing.
Volume tells you how much traded. Price action tells you where price went and what shape it made getting there.
Order flow tells you who was aggressive, where passive liquidity sat, and whether that aggression got rewarded.
A 5,000-contract bar means nothing on its own. A 5,000-contract bar where aggressive buyers bought 4,000 of it and price finished two ticks lower means something specific: buyers paid up and got absorbed.
That’s the difference order flow buys you.
The Core Order Flow Tools
Five tools cover roughly 95% of practical order flow work. Each one answers a narrow question, and each one has a limitation that will cost you money if you ignore it.
| Tool | What it shows | Data source | Main limitation |
|---|---|---|---|
| DOM (market depth) | Resting limit order size at each price, above and below the market | Live order book updates from the exchange (Level 2 / MBP data) | Displayed intent only; orders cancel, spoofing exists, queue position is invisible |
| Time and Sales (tape) | Every executed trade with price, size, timestamp and aggressor side | Executed trade feed | Extremely fast and unfiltered; unreadable in high-volume markets without size filters |
| Footprint chart | Bid volume vs ask volume at every price level inside every candle | Executed trades, aggregated into the bar and price grid | Static after the fact; cell colors mean nothing without location context |
| Delta and cumulative delta | Net aggression (aggressive buys minus aggressive sells) per bar and per session | Aggressor-classified executed volume | Classification is approximate on some feeds; diverges from price constantly |
| Volume profile | Where volume concentrated by price: point of control, value area, volume nodes | Executed volume distributed by price over a chosen period | Backward-looking; tells you where the auction was, not where it’s going |
The DOM and the Tape
The DOM and the tape are the two halves of the same coin. One shows what traders say they’ll do, the other shows what they actually did.
Professionals watching the DOM aren’t reading absolute size. They’re reading change: bids refreshing aggressively as price drops, offers pulling ahead of a move up, size appearing and vanishing in a pattern.
Combined with the time and sales tape, you get sequence. Did 300 contracts trade into that 800-lot bid, or did the bid disappear before anything hit it?
The tape rewards filtering.
Set a size filter that isolates the top 5% of trade sizes in your instrument and the noise drops away fast.
Footprint Charts
A footprint chart takes each candle and splits it into rows, one per price level (or tick cluster). Each row shows two numbers: aggressive sell volume on the bid side and aggressive buy volume on the ask side.
What you’re hunting is clustering. When several consecutive price levels all show heavy aggression in the same direction, that’s a stacked imbalance, and it marks a zone where one side genuinely pressed.
Isolated single-cell imbalances are usually just noise.
But raw cell colors mean very little on their own. A wall of green ask-side volume at the top of an extended rally is a completely different message than the same wall at a session low.
Location first, cells second.
Always.
Delta and Volume Profile
Volume delta is simple arithmetic: aggressive buy volume minus aggressive sell volume within a bar.
Positive delta means market buyers dominated that bar. Negative means market sellers did.
Cumulative volume delta (CVD) runs that total forward across the session. The difference matters.
Delta is a snapshot of one bar’s aggression, while CVD is the running trend of who has been paying up all day.
A single negative delta bar inside a strongly rising CVD is noise. A CVD that flattens after four hours of climbing is information.
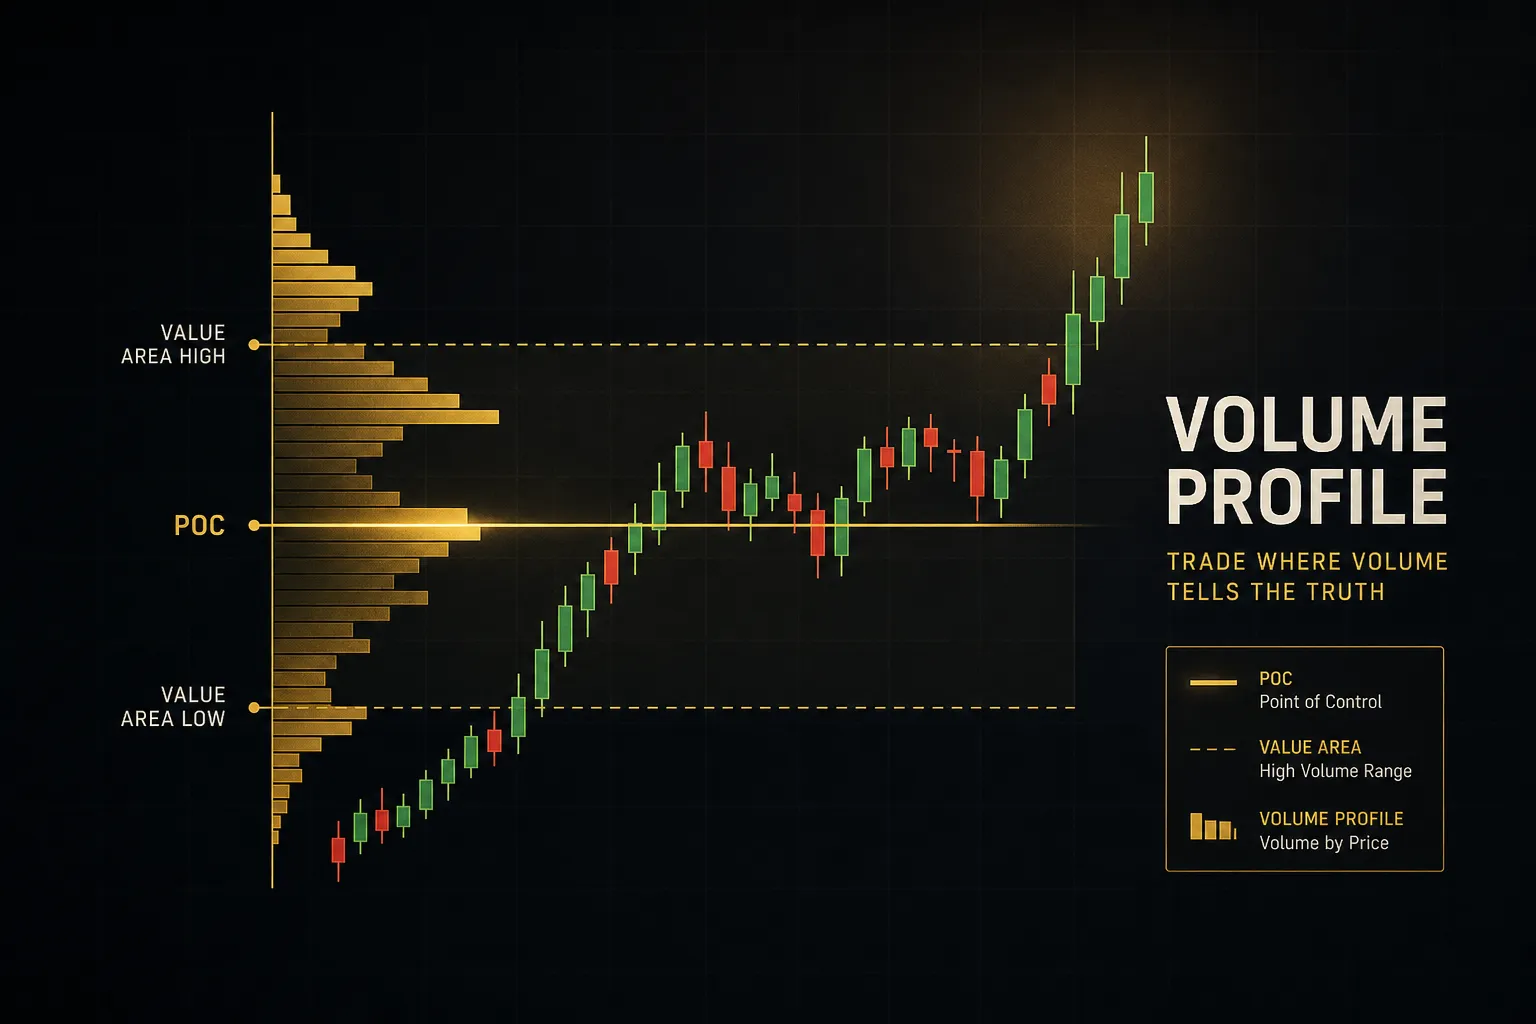
Volume profile then frames everything geographically. It shows the point of control (the highest-volume price of the session), the value area (typically the range containing 70% of volume), high-volume nodes where the auction found agreement, and low-volume nodes where price moved through fast.
This is straight auction market theory.
Order flow signals carry far more weight at value area edges and low-volume nodes than they do in the middle of a high-volume node, where price is happy to chop for hours.
Reading Signals Without Overreacting
The fastest way to lose money with order flow is to treat every imbalance as a trade.
Most of them are nothing.
The discipline is in defining what counts.
Defining an Imbalance Objectively
An order book imbalance should be a number, not a vibe.
The standard objective definition compares diagonal cells in the footprint: aggressive buy volume at one price against aggressive sell volume at the price below it.
Most platforms default to a 3:1 ratio threshold with a minimum volume filter, for example at least 30 contracts on the dominant side. That gives you a rule you can backtest.
Either the ratio was met or it wasn’t.
Then add a second, stricter filter: require at least three consecutive price levels to qualify before you call it a stacked imbalance. In my experience reviewing session replays, that single requirement removes the large majority of false signals without costing you the meaningful ones.
Subjective color-reading cannot be tested, tracked, or improved.
A ratio can.
Absorption and Exhaustion Patterns
Absorption is heavy aggressive volume met with almost no price progress. The observable criteria: unusually high volume at one or two price levels, sustained aggression in one direction, and price failing to advance more than a tick or two beyond that level over several bars.
Someone large is sitting there filling passively.
Exhaustion is the opposite shape. Price makes a strong push, then the aggressive volume driving it dries up sharply, often with delta shrinking bar over bar while price stalls at the extreme.
The push ran out of participants, not out of conviction.
Both patterns create trapped traders, the people who entered on the last leg of a move that immediately stopped working. Their eventual exits become the fuel for the move against them.
Why Delta and Price Can Diverge
New traders find this maddening: delta is strongly positive and price is falling.
It looks broken.
It isn’t.
Positive delta with falling price means aggressive buyers are buying heavily and being absorbed by larger passive sell limit orders. The buyers are the ones providing exit liquidity to a seller who never has to cross the spread.
Negative delta with rising price is the same mechanic in reverse.
Divergence between delta and price is often the highest-quality order flow read available, because it identifies which side is paying the spread and losing.
But only at a location that matters.
None of these three signals, imbalance, absorption or exhaustion, is an automatic reversal trigger. Three things decide whether the signal has value: the immediate price response after the signal, the location relative to structure, VWAP and volume nodes, and whether follow-through actually appears within the next few bars.
No follow-through means no trade.
Turning Order Flow Into a Strategy
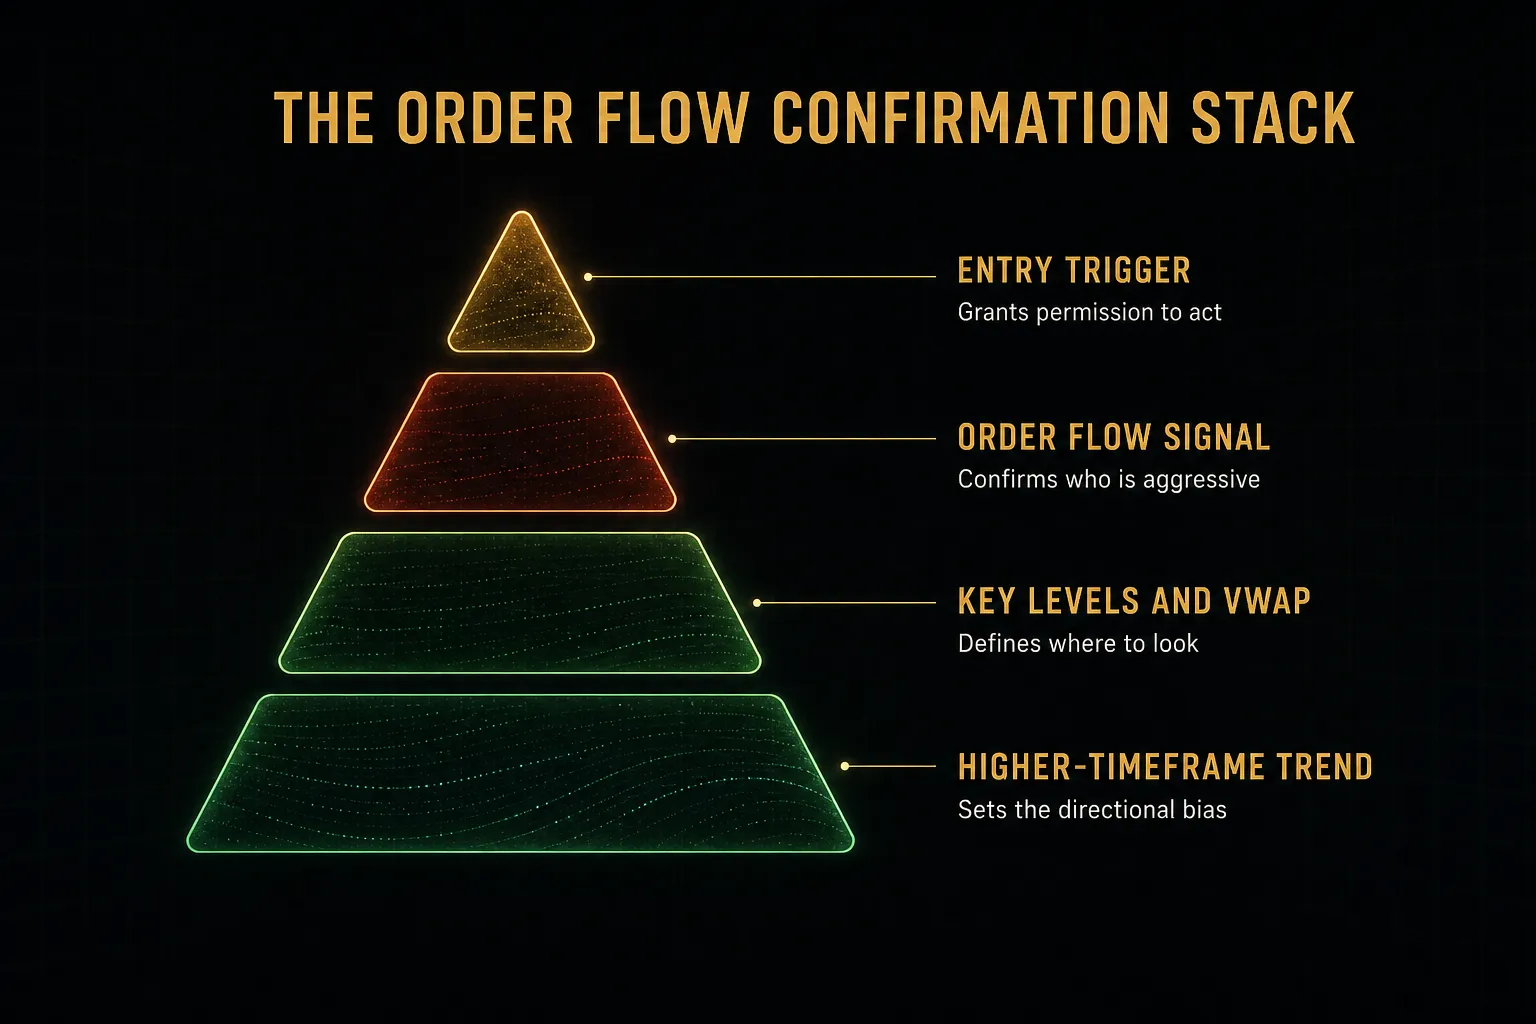
Order flow is the last step in a decision process, never the first.
Traders who invert that order end up scalping random imbalances in the middle of nowhere and wondering why their win rate collapsed.
A Repeatable Confirmation Checklist
Work top-down, every session, in the same sequence.
- Establish higher-timeframe direction first. Determine trend and bias on the daily and hourly before you look at a single footprint cell. If the higher timeframes conflict, reduce size or stand aside.
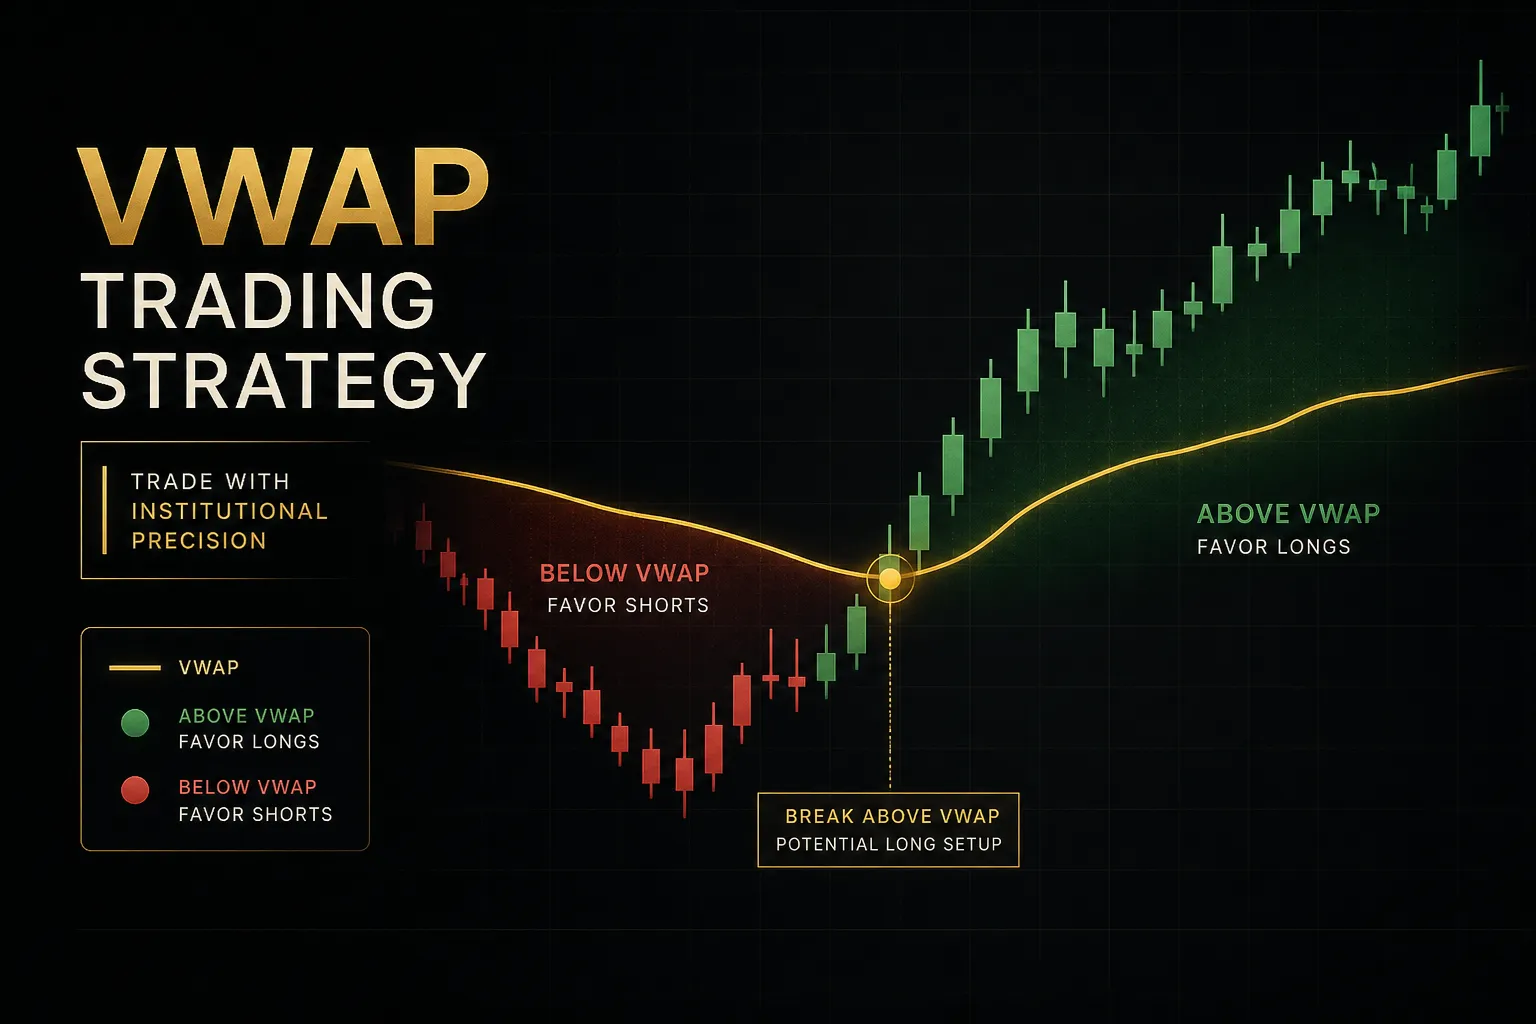
- Mark your levels before the session opens. Prior session high and low, overnight range, VWAP, point of control, value area edges, and any supply or demand zone. A directional framework such as PipTrend’s multi-timeframe trend table and marked level set does this job well, because it tells you where to look for confirmation instead of leaving footprint signals to act as a standalone entry system.
- Wait for price to reach a marked level. No level, no setup. This rule alone eliminates most impulsive trades.
- Demand order flow confirmation at that level. Look for one of your three defined signals: a stacked imbalance in the direction of your bias, absorption against the approaching move, or exhaustion of the move into the level.
- Require an entry trigger, not just a signal. A close back above the level, a failed auction attempt, or delta flipping in your direction. The signal is the reason; the trigger is the permission.
Risk, Invalidation, and Slippage
Order flow tightens entries, which tempts traders into stops that are too small.
That’s how a good read turns into a stopped-out loser.
- Place stops beyond the invalidation point, not beyond your comfort zone. If your thesis is absorption at a session low, the stop belongs below the low where the absorption clearly failed, plus a buffer for noise.
- Budget for slippage and spread widening. Around scheduled news and the cash open, spreads widen and fills degrade materially. Assume worse-than-normal trade execution in those windows or don’t trade them.
- Scale out when absorption stops holding. If the passive side that justified your entry gets consumed, take partial profit or exit. The reason left the trade before your stop did.
- Cap risk per trade at a fixed percentage. Most professionals working intraday keep it between 0.25% and 1% of account equity. Risk management is the only variable you fully control.
- Reduce size in distorted conditions. Thin overnight liquidity, the first minute of a session, and futures contract rollover periods all skew delta and footprint readings because volume splits or dries up.
Futures, Forex, and What’s Observable
This is the part vendors rarely say out loud: true order flow data requires a centralized order book, and forex doesn’t have one.
- Futures give you the real thing. Instruments like ES, NQ, CL and ZN trade on a single central limit order book at one exchange, so depth, tape and aggressor classification reflect the entire market.
- Spot forex and CFDs do not. Forex is decentralized across banks, ECNs and brokers, so any “depth” you see is one venue’s slice, and CFD feeds are broker-specific. Tick volume counts price updates, not contracts.
- Forex traders have a workable substitute. Use tick volume for relative activity, session highs and lows, VWAP, and structure-based confirmation such as failed breaks and clean rejections. You lose depth of market; you keep location and reaction.
- Or trade the correlated future. Reading order flow in the 6E euro future to inform EUR/USD decisions is a common and legitimate workaround.
- Practice with structure, not screen time. Replay sessions in a simulator, screenshot and annotate every setup, tag each one by type, and collect at least 30 to 50 samples of a single setup before judging it. Track expectancy, maximum adverse excursion and maximum favorable excursion. MAE tells you if your stops are too tight; MFE tells you if you’re exiting too early.
Order Flow Trading FAQ
What is order flow trading for beginners?
Order flow trading is reading executed trades and resting limit orders to see who is currently more aggressive, buyers or sellers. Beginners should start with just two tools: a footprint chart and volume profile, on one instrument.
The goal early on is not to predict, it’s to recognize when aggressive volume at a level fails to move price.
How do you read order flow in trading?
You read it top-down, in a fixed sequence. Establish higher-timeframe direction, mark your key levels including VWAP and value area edges, wait for price to reach one, then look for a defined signal such as a stacked imbalance, absorption or exhaustion.
Confirmation only counts at a level you marked in advance, and only if follow-through appears within the next few bars.
What is the best indicator for order flow?
The footprint chart is the single most informative order flow tool, because it shows aggressive buy and sell volume at every price level rather than just a net figure. Cumulative volume delta is the strongest complement, since it tracks whether the aggressive side is sustaining pressure across the session.
Neither works well without volume profile providing location context.
What is the difference between order flow and volume profile?
Volume profile shows where volume concentrated by price, while order flow shows who was aggressive in creating it. Profile gives you the point of control, value area, and high and low volume nodes, which are essentially a map of where the auction found agreement.
Order flow tools like footprint and delta tell you what happened when price arrived there.
Can you use order flow trading in forex?
Not in its true form, because spot forex is decentralized and has no central limit order book. Any market depth your broker displays represents one venue’s liquidity, and tick volume counts price updates rather than actual contracts traded.
The practical alternatives are trading the correlated currency future, which does have real depth data, or relying on session levels, VWAP and structure-based confirmation instead.
Is order flow trading profitable?
Order flow can be profitable as a confirmation layer, but it is not profitable as a standalone signal system. Its edge comes from improving entry timing and reducing losses on trades your existing structure-based plan already identified, which shows up as better expectancy rather than a higher win rate.
Traders who skip risk management and treat every imbalance as a trade lose money faster with order flow, not slower.
The Bottom Line on Order Flow
One takeaway matters more than everything else here.
Treat every order flow signal as a confirmation layer stacked on top of structure and trend direction, never as a standalone trigger.
The tools are genuinely powerful. Footprint charts, delta, and the tape show you something price alone cannot: who paid the spread, who provided the liquidity, and which side got trapped.
But they show it over seconds and minutes, which means they answer “is this level holding right now” and nothing larger.
So here’s your next action, and it’s deliberately narrow.
Pick one level type: VWAP, the session high and low, or a single supply and demand zone. For the next two weeks, read order flow reactions only at that level.
Screenshot every instance, tag it, and note whether follow-through appeared.
Nothing else.
Two weeks of that will teach you more than two years of watching every colored cell on the screen.
Because the edge in order flow was never in seeing more data. It’s in reading a few variables the same disciplined way, session after session, until the pattern becomes obvious to you and invisible to everyone else.
Sources
- CME Group: Assessing liquidity - Revisiting whether book depth is a sufficiently representative measure of market liquidity
- Investor.gov: Types of Orders
- CME Group: A Trader's Guide to Futures
- Wiley: Deep order flow imbalance: Extracting alpha at multiple horizons from the limit order book
- TradingView: Volume footprint charts: a complete guide
Risk Disclaimer: Trading involves risk. Past performance doesn't guarantee future results. Only trade with money you can afford to lose. PipTrend is a tool to assist your trading decisions, not financial advice.