ICT Trading Explained: A Beginner's Framework Guide

On this page
What Is ICT Trading, Really?
Search “ICT trading” on YouTube and you’ll find thousands of charts where price sweeps a low, taps a gap, and rockets to target. Every example looks perfect.
Almost none of them were called in advance.
ICT trading is a price-delivery framework that studies how institutional order flow moves price toward pools of resting orders, known as liquidity. It is not a single mechanical system with one entry rule.
It’s a vocabulary for reading market structure, timing, and imbalance, which traders assemble into their own rules.
That distinction creates the core tension of this entire topic.
Hindsight examples are easy. A repeatable, rules-based process that survives 50 logged trades is hard.
This guide is built around that gap.
We’ll separate ICT terminology from what proven market-microstructure research actually supports, and we’ll be honest about where the framework relies on narrative rather than evidence. We’ll also show where an indicator system like PipTrend can support the analysis, confirming higher-timeframe bias and marking session liquidity, without replacing your own structure reading.
Here’s what you’ll walk away with:
First, plain-English definitions of the core vocabulary: liquidity sweeps, Fair Value Gaps, order blocks, and structure shifts. Second, a top-down workflow that turns those concepts into an actual trade plan with entry, stop, and target.
Third, the beginner mistakes that quietly destroy accounts. And finally, a backtesting protocol that stops you from fooling yourself with cherry-picked screenshots.
Treat ICT as a decision-making framework with objective invalidation rules, not a collection of patterns that “always work.” That single mindset shift separates traders who test from traders who hope.
Where ICT Trading Comes From
Who Created ICT and Why It Spread
ICT stands for Inner Circle Trader, the online handle of Michael J. Huddleston. He began teaching his approach in forex forums in the early 2010s, then released hundreds of hours of free mentorship content on YouTube.
That free distribution model is why the terminology spread globally. No paywall, no course to buy, just long-form lectures covering liquidity, time-based trading, and institutional order flow. By the mid-2020s, terms like “kill zone” and “Fair Value Gap” had become standard vocabulary across retail trading communities, even among traders who had never watched a Huddleston video.
The 2022 mentorship series in particular produced what’s now called the 2022 ICT model, arguably the most-taught retail day trading template of the past few years.
ICT vs Smart Money Concepts
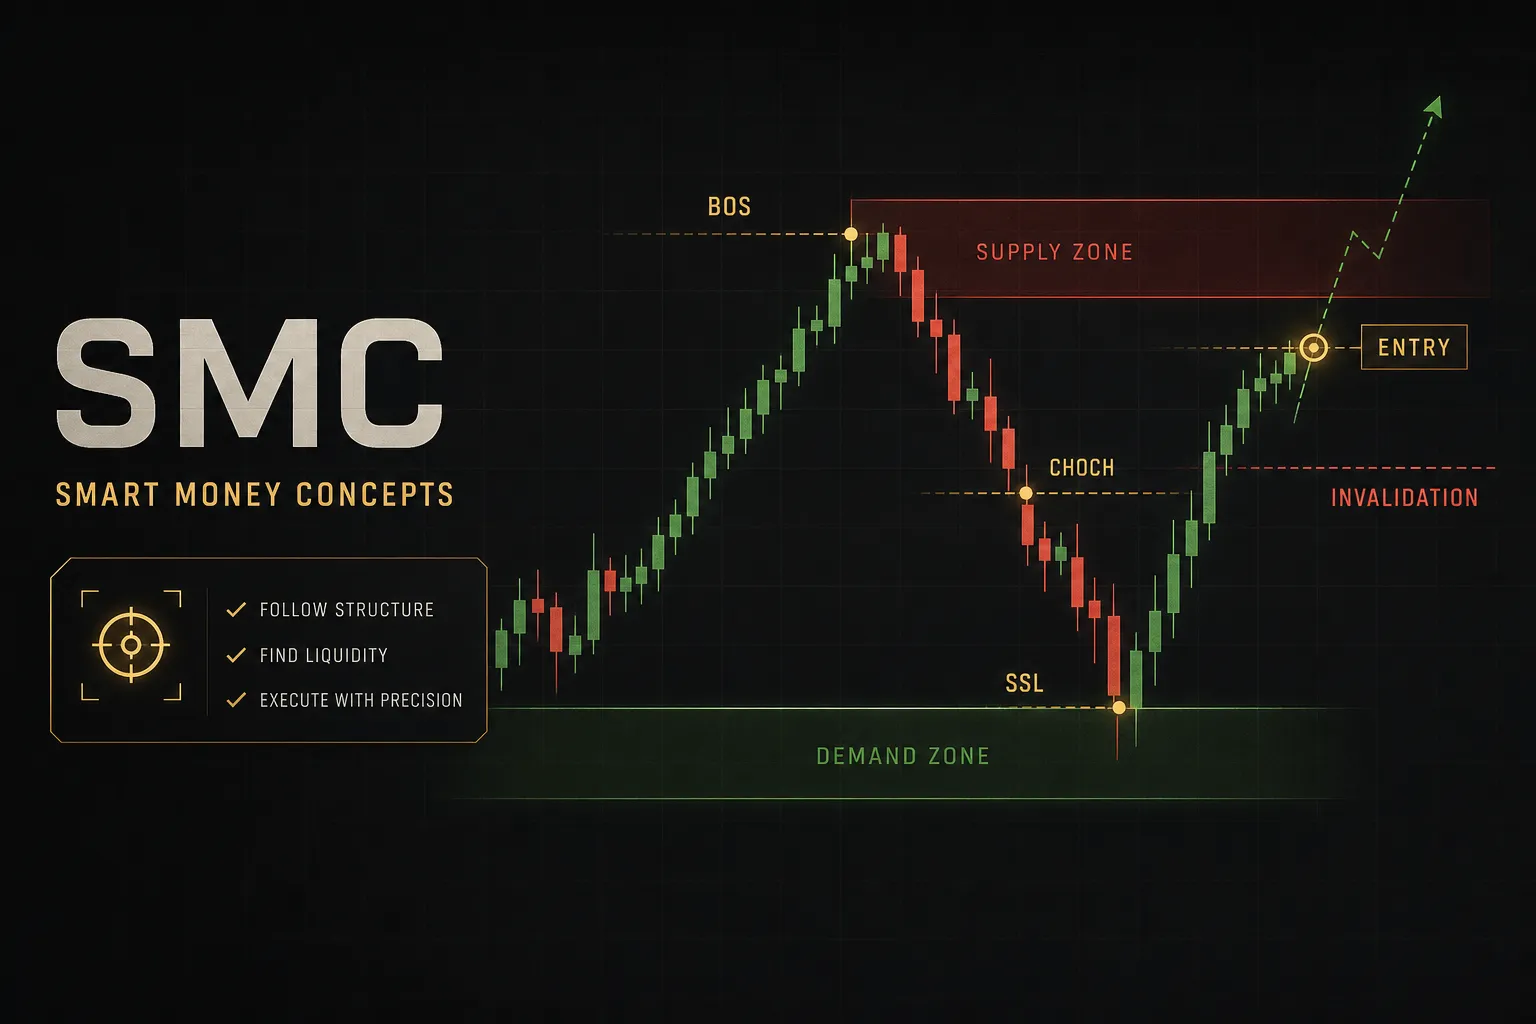
Here’s a point that confuses nearly every beginner: Smart Money Concepts (SMC) is not the same thing as ICT. It’s a related offshoot built by other educators who borrowed and simplified Huddleston’s vocabulary.
SMC content tends to focus on a compact toolkit: break of structure, change of character, order blocks, and liquidity. ICT’s original material is broader and heavily time-based, covering session timing, weekly profiles, and concepts like the Judas swing and Power of Three.
The vocabulary overlaps maybe 70 percent, but definitions drift between educators.
Practically, this means two traders can both say “order block” and mean slightly different things.
Whatever definitions you adopt, write them down and keep them fixed. Consistency in your own rulebook matters more than which camp you learn from.
A Framework, Not One Strategy
One more dose of honesty: neither ICT nor SMC terminology is peer-reviewed market-microstructure theory. Academic order-flow research studies things like limit order book dynamics, quote imbalance, and dealer inventory. It does not use terms like “smart money reaching for stops.”
That doesn’t make ICT useless.
Many ICT concepts describe real, observable behavior: price frequently does trade through obvious swing levels before reversing, and stop clusters at those levels are a plausible mechanical reason. But the narrative layered on top, that an algorithm deliberately hunts retail traders, is storytelling, not proven mechanism.
This is why ICT is best understood as a broad collection of concepts, covering liquidity, structure, and time, that each trader assembles into a personal, testable strategy. There is no single “ICT strategy” with universal rules.
Anyone selling you one has made their own variant. You’ll need to build and validate yours the same way.
The Core ICT Vocabulary Decoded
ICT has a reputation for jargon overload, and honestly… it’s earned.
But the working vocabulary you need as a beginner comes down to about ten terms. Here they are with objective, testable definitions.
Liquidity and Liquidity Sweeps
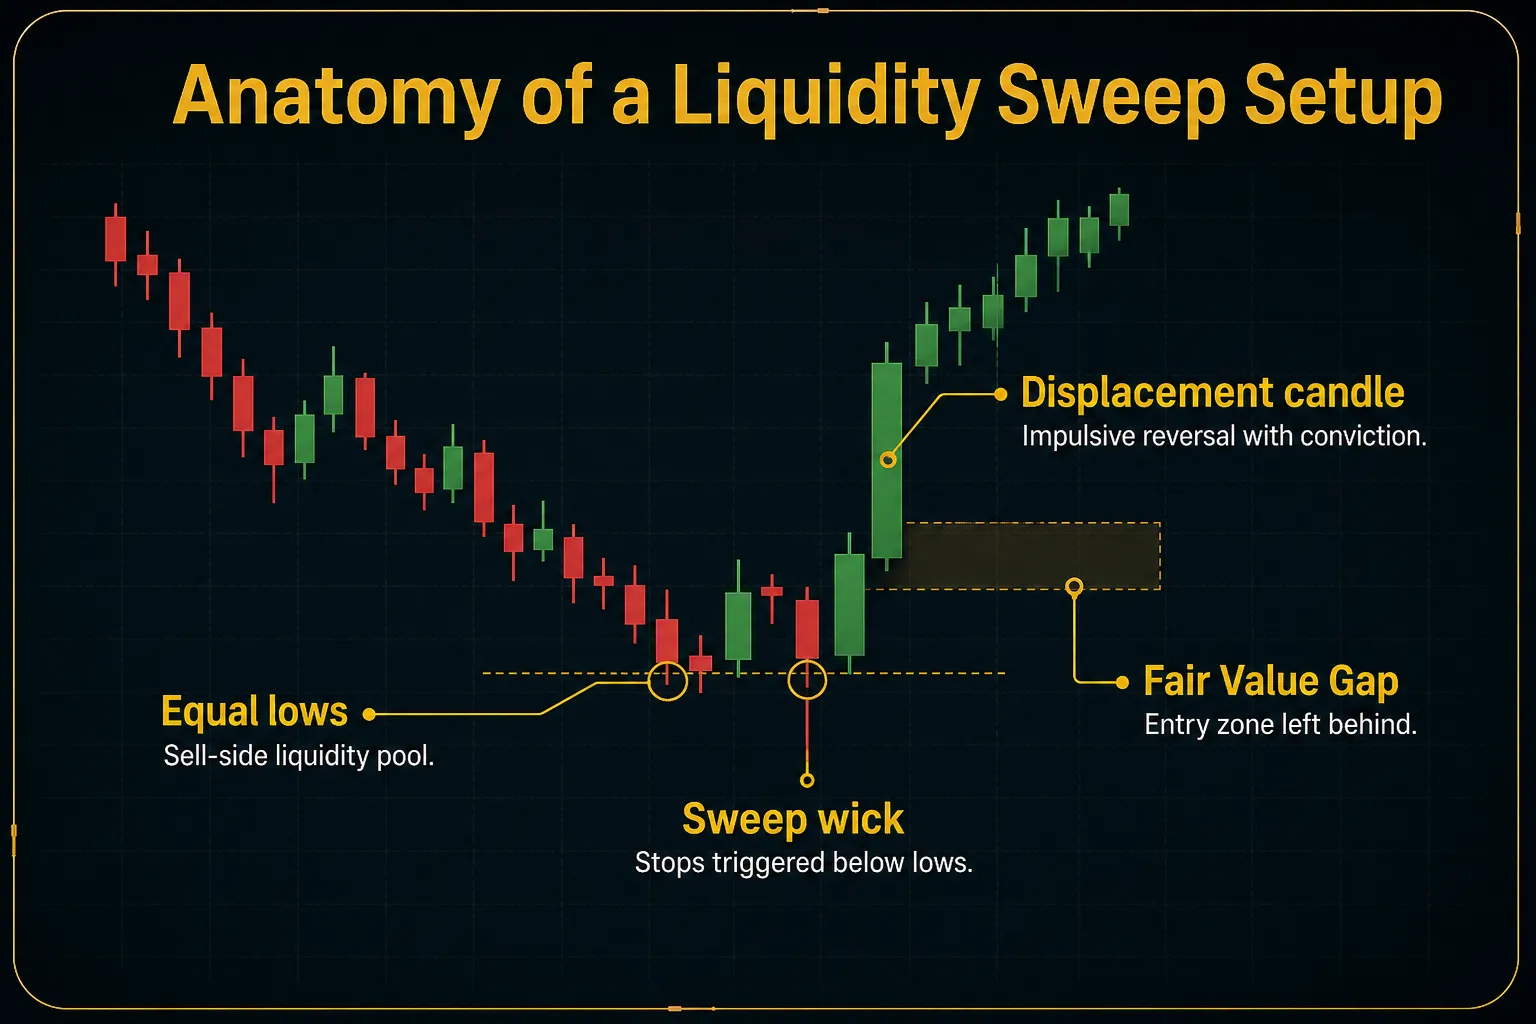
- Liquidity pools are price levels where resting orders cluster. The classic examples are equal highs, equal lows, session extremes (yesterday’s high, the London session low), and obvious swing points. Stops from one group and entry orders from another sit at the same prices.
- Buy-side liquidity sits above old highs (buy stops from short sellers plus breakout buy orders). Sell-side liquidity sits below old lows. Price is drawn toward these pools because that’s where orders can actually be filled in size.
- A liquidity sweep occurs when price briefly trades through one of these levels, triggers the resting orders, then reverses. On a candle chart it appears as a wick beyond the level with a close back inside the prior range.
- Alternative explanations matter. Not every sweep is a deliberate stop hunt. Order-flow imbalance (a burst of market orders exhausting one side of the book) and normal volatility expansion produce identical patterns. You cannot know intent from a chart, and you don’t need to. You only need the pattern to have a positive expectancy under your rules.
- Rank your pools. On any chart there are five or more candidate liquidity levels. Rank them: higher-timeframe levels beat lower-timeframe ones, untouched levels beat retested ones, and levels aligned with your directional bias beat those against it. The highest-ranked pool becomes your draw on liquidity, the level price is most likely reaching for. Assuming every sweep is tradable is how beginners overtrade.
Fair Value Gaps and Order Blocks
- A Fair Value Gap (FVG) is a three-candle imbalance: the gap between candle one’s high and candle three’s low (in a bullish move) where candle two’s range never overlapped. It represents a price zone that traded in only one direction, sometimes called a liquidity void.
- Add a size filter. Tiny gaps are noise. A workable objective rule: only mark FVGs at least 25 to 50 percent of the average candle range on your timeframe (measured over the last 14 to 20 candles). This one filter removes most junk setups.
- An order block is the last opposing candle before a strong impulsive move. A bullish order block is the final down candle before displacement higher. The theory says institutions accumulated positions there; the practical version is simpler: it marks the origin of a strong move, and origins often get defended on retest.
- Invalidation must be defined in advance. An FVG is invalidated when price fully fills the gap and closes through it. An order block is invalidated when price closes beyond its far edge. Without written invalidation rules, every failed zone becomes “it just needed a deeper retest,” and you can never be wrong, which means you can never learn.
- Related terms you’ll encounter: a breaker block is a failed order block that price traded through and then respects from the other side. A mitigation block is similar but forms without a full liquidity sweep. Beginners should shelve both until FVGs and standard order blocks are second nature.
- Premium and discount zones come from splitting the current dealing range (swing low to swing high) at its 50 percent midpoint. Buy setups in the discount half, sell setups in the premium half. It’s a simple filter that stops you buying the top of a range.
Structure Shifts and Kill Zones
- A Break of Structure (BOS) is a close beyond the most recent swing high in an uptrend (or swing low in a downtrend). It signals continuation of the existing trend.
- A Change of Character (CHoCH) is the first break against the prevailing trend, for example price in an uptrend closing below its most recent higher low. It’s an early warning, not confirmation.
- A Market Structure Shift (MSS) is the confirmed version: a decisive break of a significant swing level against the prior trend, ideally following a liquidity sweep. CHoCH says “pay attention.” MSS says “the trend may have actually changed.”
- Displacement is what validates the shift: a strong, impulsive move with large-bodied candles that typically leaves an FVG behind. A structure break on weak, overlapping candles is suspect. A break with displacement carries conviction. No displacement, no trade.
- Kill zones are the time windows where ICT traders hunt setups, because volatility and volume concentrate there. The London kill zone runs roughly 2:00 to 5:00 AM New York time and often produces the day’s high or low in forex. The New York kill zone runs roughly 7:00 to 10:00 AM New York time and catches the US open, frequently reversing or extending London’s move. Trading outside these windows means trading thin, directionless price action.
From Concepts to a Trade
Vocabulary without sequence is trivia.
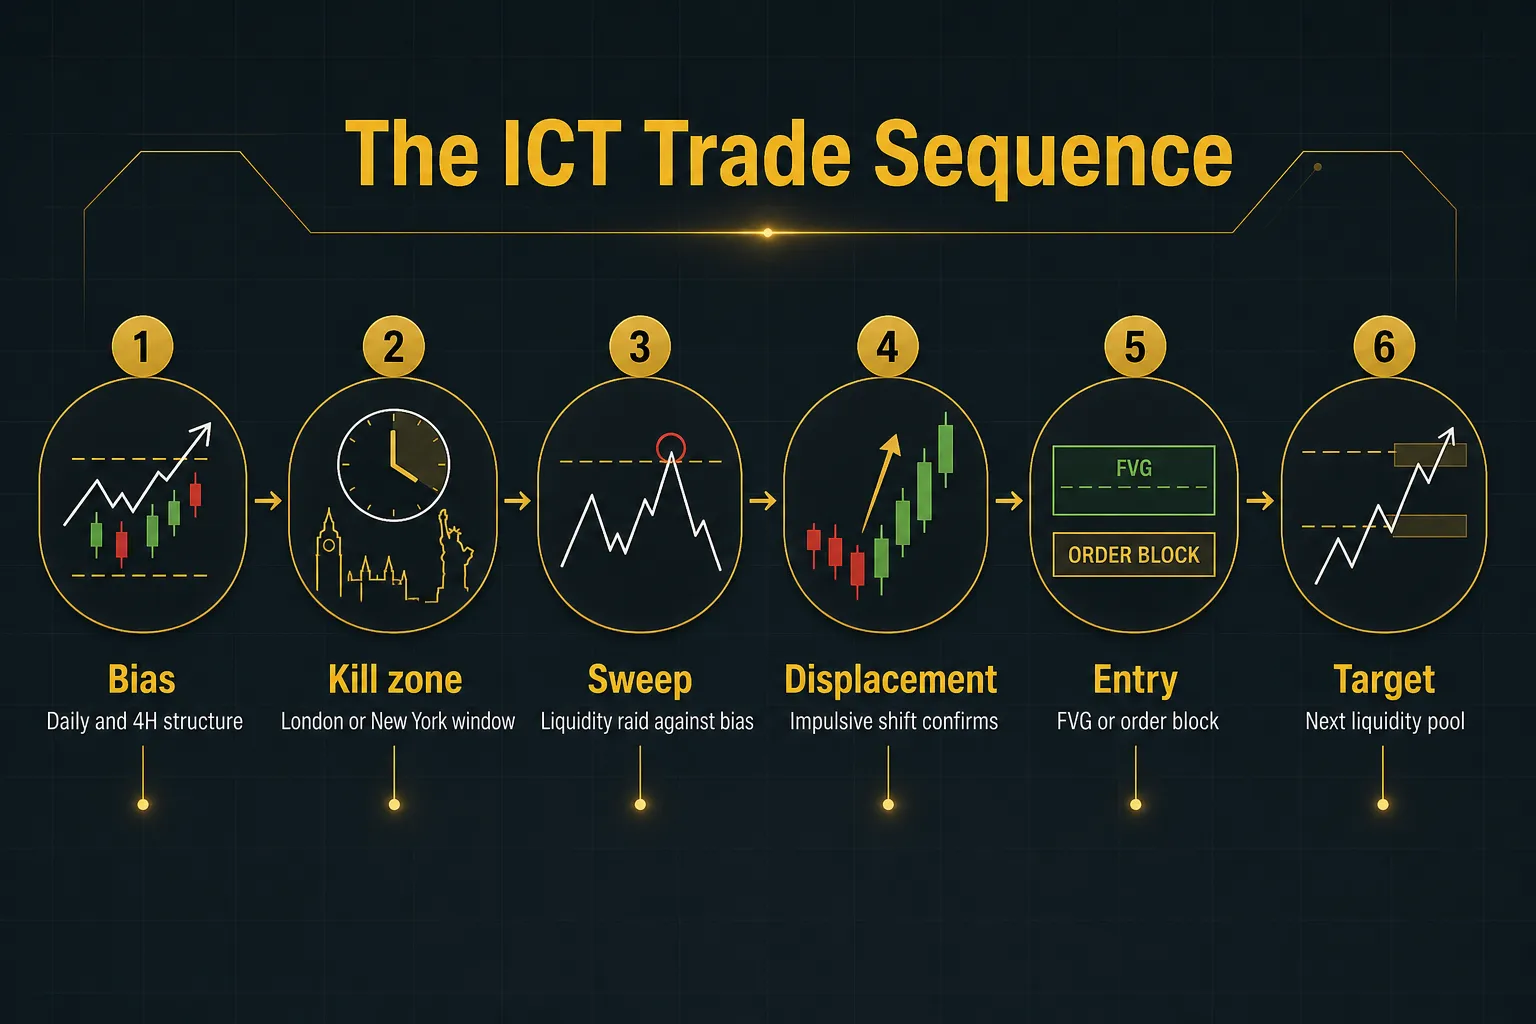
Here is the top-down workflow that turns ICT concepts into a plannable trade, in the order professional practitioners actually run it.
- Establish higher-timeframe bias. On the daily and 4-hour charts, identify the trend via market structure (higher highs and higher lows, or the reverse) and note where price sits in the dealing range. Your bias filters every decision below; without it you’re guessing.
- Wait for a kill zone. Only hunt setups during the London or New York window. If your kill zone passes without a setup, the answer is no trade today, not a worse trade later.
- Identify the draw on liquidity. Mark the ranked liquidity pools in your bias direction: old highs for longs, old lows for shorts. The strongest untouched pool aligned with your bias is your target zone.
- Wait for the sweep. Before entering, you want price to raid a liquidity pool against your bias, sweeping sell-side liquidity below a low before you buy. This is the “trap” phase, sometimes called the Judas swing in ICT language.
- Confirm displacement and a market structure shift. After the sweep, demand an impulsive move back in your bias direction that breaks a lower-timeframe structure level with strong-bodied candles. This confirmation step is what separates a sweep from a breakout that keeps running against you.
- Mark the FVG or order block. The displacement leg should leave a Fair Value Gap or originate from an identifiable order block. Apply your size filter; skip gaps smaller than your minimum.
- Set the entry. Place a limit order inside the FVG (many traders use the midpoint, sometimes called consequent encroachment) or at the order block’s edge. This retracement entry is the ICT version of an optimal trade entry.
- Place the stop beyond the swept level, plus real costs. Your stop goes past the sweep’s extreme wick. Then add the spread, and account for slippage: on a EUR/USD trade the spread might be 0.5 to 1 pip, but on indices or crypto it can be several points. Never plan risk on theoretical mid-price alone; commission and slippage can turn a 1:2 risk-to-reward ratio into 1:1.6 on small stops.
- Set the target at the next liquidity pool. Your draw on liquidity from step three is the logical target, since that’s where opposing orders will fill your exit. If the distance from entry to target is less than twice your stop after costs, skip the trade. Position sizing stays fixed, typically 0.5 to 1 percent of account per trade.
Using the ICT 2022 Model as a Template
The sequence above is essentially the 2022 ICT model, the template Huddleston popularized in his 2022 mentorship: sweep, displacement, market structure shift, FVG entry, opposing liquidity target. It’s the cleanest packaged version of the framework and a sensible starting point for beginners.
But understand what it is: one variant among many, not the definitive ICT method. Huddleston himself teaches numerous models across different sessions and timeframes.
The 2022 model’s value is that it forces sequence and confirmation, which is exactly what impulsive beginners lack.
Multi-timeframe confirmation is where a dashboard tool earns its place. PipTrend’s 12-timeframe table lets you verify at a glance that your 5-minute entry agrees with the 1-hour and 4-hour direction, its session liquidity markers plot the London and New York extremes automatically, and its confidence band helps narrow the entry zone.
Used this way, it verifies alignment and saves marking time. It does not read structure for you, and it shouldn’t.
Your bias call and your risk decision remain yours.
Markets, Mistakes, and Testing It Yourself
Where ICT Works Across Markets
A clean EUR/USD setup does not automatically translate to Nasdaq futures or Bitcoin. This surprises almost every beginner who tries to port their forex rules across markets.
ICT was developed primarily on forex majors and index futures, and that’s where its session logic fits best. EUR/USD and GBP/USD have deep liquidity, tight spreads, and reliable session rhythms, so kill zones and session extremes carry real meaning.
Sweeps of the London low ahead of the New York open are a genuinely recurring pattern there.
Volatile indices like the Nasdaq respect the same concepts but with much larger displacement legs, meaning wider stops and different position sizing.
Futures add overnight sessions where structure forms on thin volume and gets ignored the next day.
Crypto trades 24/7 with no session close at all, so “kill zones” weaken; liquidity pools and sweeps still appear, but weekend liquidity is thin enough that sweeps overshoot dramatically. And in forex specifically, overnight financing (swap) quietly eats into trades held across the 5 PM New York rollover.
The rule: retest every concept per market.
An edge validated on EUR/USD is a EUR/USD edge, nothing more.
Mistakes That Sink Beginners
Knowing when not to trade matters as much as the entry model. Skip choppy ranges where structure breaks in both directions within hours. Skip the 30 minutes around major news releases (CPI, NFP, central bank decisions), where spreads widen 3 to 10 times and sweeps mean nothing. Skip thin overnight sessions. And skip any setup where the risk-to-reward ratio drops below 1:2 after costs.
Four filters, most of your worst trades gone.
Also, ICT does not replace classical price action trading tools. Trendlines, support and resistance, volume, and moving averages describe the same market from different angles. An order block sitting on a daily support level with a rising 200-period moving average is a stronger zone than any single method alone would suggest.
Treating ICT as a religion that forbids other tools is a beginner tell, not a badge of purity.
The recurring mistakes are remarkably consistent:
Chasing every kill zone every day, when two or three quality setups per week is realistic. Ignoring higher-timeframe bias and buying 5-minute FVGs into a daily downtrend.
Forcing FVG entries inside a range where there’s no displacement to validate anything. Treating one pattern as guaranteed after three wins, then doubling size into the fourth trade. And studying breaker blocks, mitigation blocks, and Power of Three simultaneously while never mastering one setup.
The fix is brutally narrow: one market, one session, one setup, fixed risk. Boring is the point. Boring is what produces data you can actually evaluate.
Backtesting Without Fooling Yourself
Here’s the uncomfortable truth about ICT specifically: because the framework has many concepts and flexible definitions, it is unusually easy to “find” perfect setups in hindsight. Every reversal has some gap or block behind it if you look hard enough.
Your testing protocol has to defend against that.
Use bar-replay mode or forward-test on a demo account, and follow four rules. First, write the prediction before the candle closes: entry level, stop, target, and the exact invalidation condition.
If you can’t write it in advance, it isn’t a rule, it’s a rationalization.
Second, log execution quality: did you enter at your planned price, and what did spread and slippage actually cost?
Third, record every outcome. Losses, break-evens, and skipped setups go in the journal alongside wins.
A folder of winning screenshots is marketing material, not research.
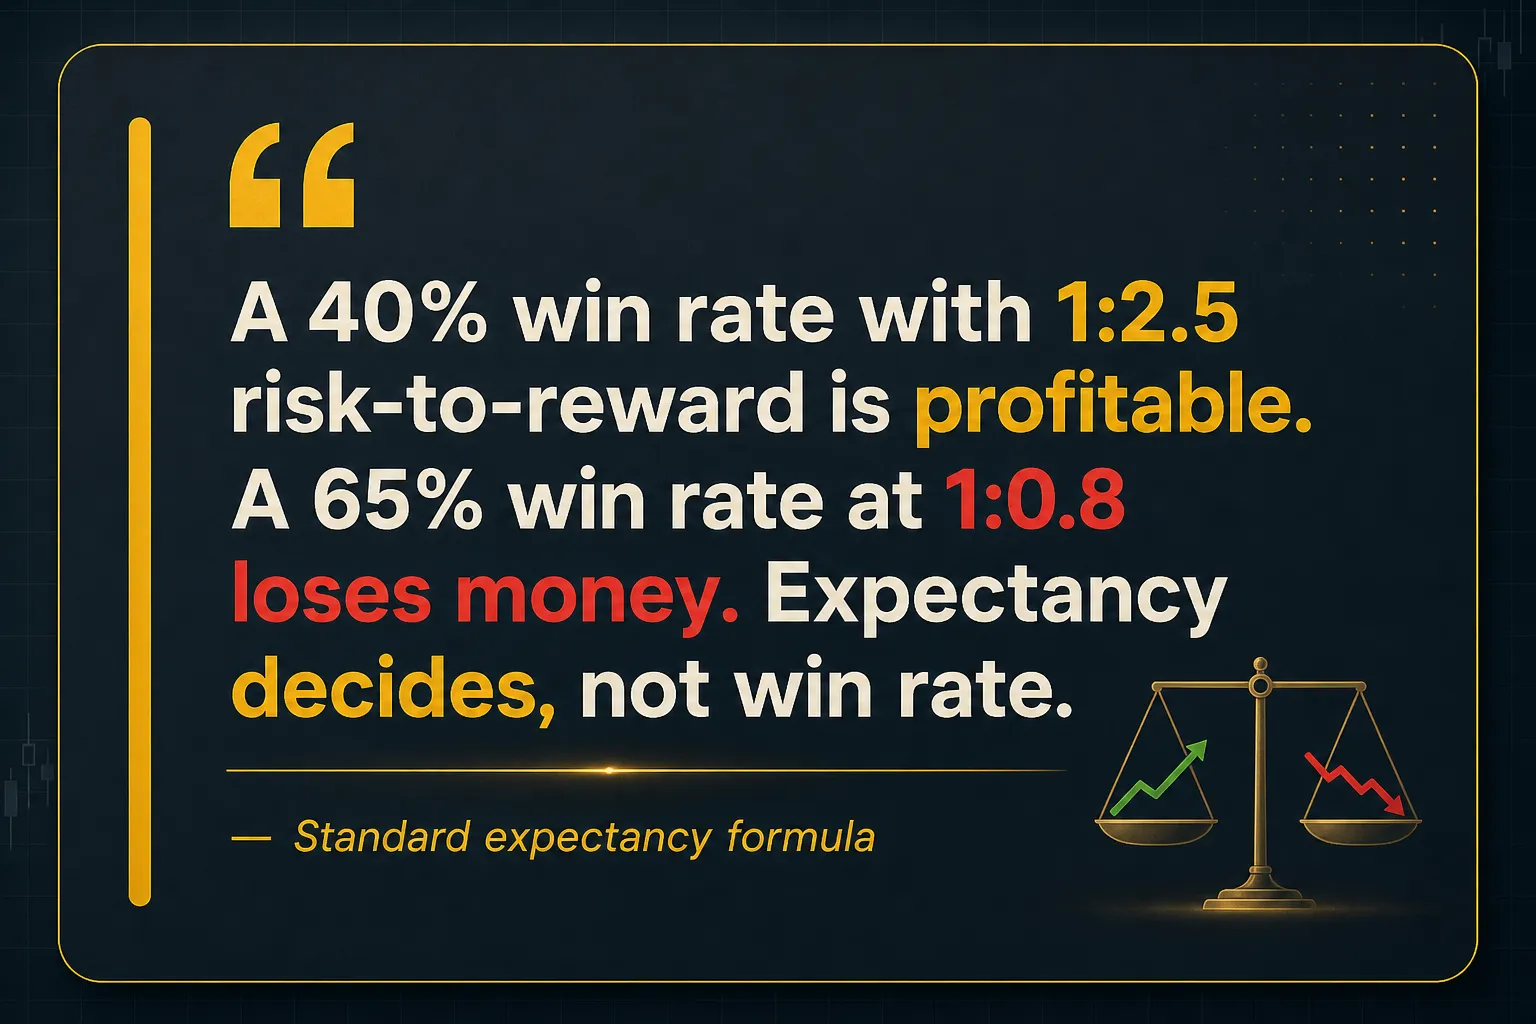
Fourth, calculate expectancy: (win rate × average win) minus (loss rate × average loss). A 40 percent win rate with 1:2.5 average risk-to-reward is a profitable system; a 65 percent win rate with 1:0.8 is a slow bleed.
Only expectancy tells you which one you have.
Run a minimum of 30 to 50 logged instances of one setup before drawing any conclusion. Fewer than that and variance will lie to you in both directions.
Frequently Asked Questions
What is ICT trading in simple terms?
ICT trading is a price action framework, created by Michael J. Huddleston (the Inner Circle Trader), that reads charts through liquidity and market structure. The core idea is that price moves toward pools of resting orders, sweeps them, and then reverses or continues, leaving footprints like Fair Value Gaps and order blocks.
In practice, ICT traders wait for a liquidity sweep during a kill zone, confirm a market structure shift with displacement, and enter on the retracement. It’s a vocabulary and a process, not a single indicator or signal.
Is ICT trading actually profitable?
ICT trading can be profitable, but the framework alone guarantees nothing; profitability depends on the trader’s execution, risk management, and testing. There is no independent, audited data proving ICT outperforms other price action approaches, and its concepts are not peer-reviewed theory.
What the framework does provide is structure: defined entries, objective invalidation, and logical targets. Traders who backtest one model over 30 to 50 instances, size positions at fixed risk, and journal honestly can build positive expectancy.
Traders who chase every sweep will lose money with ICT just as fast as with anything else.
What are the 7 concepts of ICT trading?
A commonly cited 7-concept starter set is: liquidity (buy-side and sell-side pools), market structure (BOS, CHoCH, MSS), Fair Value Gaps, order blocks, displacement, kill zones, and the draw on liquidity. This list varies by educator, since ICT’s full body of work covers far more, including premium and discount zones, breaker blocks, and the Power of Three.
For a beginner, those seven are enough to run the complete 2022 model workflow from bias to target.
What is the best ICT strategy for beginners?
The best beginner starting point is the 2022 ICT model applied narrowly: one currency pair, one kill zone, one entry type. A concrete example: EUR/USD, New York kill zone only, entering on an FVG after a sweep of session lows with a confirmed market structure shift, targeting the opposing liquidity pool at a minimum 1:2 risk-to-reward.
Track it in a trade journal for a defined testing period, at least 30 setups on demo, before risking live capital. Depth beats breadth at this stage.
Is ICT better than Smart Money Concepts?
Neither is objectively better; SMC is a simplified offshoot of ICT built by other educators using overlapping vocabulary. ICT’s original material is broader and more time-based, while SMC condenses the ideas into a compact structure-and-order-block toolkit that’s faster to learn but less nuanced.
Since definitions drift between camps, the deciding factor is consistency: pick one set of definitions, write them down, and test them. Your rulebook matters more than the brand name on it.
How long does it take to learn ICT trading?
Expect 3 to 6 months to learn the core vocabulary and complete a meaningful backtest, and typically 1 to 2 years to trade a model with consistent live execution. The vocabulary itself takes weeks; the discipline to trade one setup in one session without deviation takes far longer.
As of 2026, the free content library is enormous, so information isn’t the bottleneck. Screen time, journaling, and honest review of losses are.
Making ICT Concepts Repeatable
The single most important shift this guide can give you is this: treat ICT as a decision-making framework with objective invalidation rules, not a set of guaranteed patterns. A Fair Value Gap is a hypothesis with a defined failure condition.
So is an order block, a sweep, a structure shift.
The moment every concept has a written “this is wrong when…” clause, you stop collecting screenshots and start collecting evidence.
Your next action is deliberately small. Pick one instrument and one session.
Write your entry, stop, and target rules on a single page. Then backtest 30 to 50 instances, logging every outcome, before a single dollar of live capital goes at risk.
Tools can support the consistency part. PipTrend’s multi-timeframe confirmation and session liquidity markers reduce marking errors and keep your bias honest across timeframes.
But no dashboard reads market structure for you, and none should.
The structure call, the risk decision, and the discipline to skip bad days remain yours.
That’s the real edge ICT offers. Not secret institutional knowledge… just a repeatable process, tested properly, executed the same way every time.
Risk Disclaimer: Trading involves risk. Past performance doesn't guarantee future results. Only trade with money you can afford to lose. PipTrend is a tool to assist your trading decisions, not financial advice.