TradingView Nifty: The Symbol Guide Traders Need
On this page
Why Your Nifty Chart Keeps Confusing You
Type “Nifty” into TradingView’s search bar and you get a wall of results.
Spot index.
Current-month futures.
A continuous contract.
Then dozens, sometimes hundreds, of option strikes stacked on top of each other.
Three of those symbols will show three different prices at the exact same moment.
That is not a bug, and your data feed is probably fine.
The Nifty 50 index is a calculated value. It has no bid, no ask, and no order book.
NSE:NIFTY is the spot symbol most traders land on first, and it is the one symbol on that list you cannot actually trade.
Execution happens in futures, options, or an index ETF, each of which carries its own price because of basis, carry cost, and time to expiry.
So a trader draws support at 24,180 on the spot chart, then places an order in the futures contract trading 60 points higher, and wonders why the stop got hit “early.”
The chart was right.
The instrument was wrong.
This guide fixes symbol selection first. Get that wrong and every indicator sitting on top of it inherits the error.
After that, we build the part most tutorials skip: a repeatable process. Not a hunt for the one indicator that prints money, but a workflow that starts with higher-timeframe bias, refines entries on lower timeframes, and confirms with a single tool instead of five contradictory ones.
Data quality, confirmation discipline, and risk control decide outcomes far more often than indicator choice does.
Expect specifics.
Which symbol does what, how to verify whether your NSE market data is live or delayed, why a clean index backtest tells you almost nothing about option premium performance, and what to actually track when reviewing your trades.
Finding the Right Nifty Symbol
Every Nifty instrument on TradingView traces back to the same underlying calculation, yet they rarely print the same number. Understanding why takes about two minutes and saves months of confusion.
Spot, Futures, and Options Compared
The table below covers the four symbol types you will encounter. Note the tradability column carefully, because that single distinction causes most of the friction beginners run into.
| Symbol Type | Typical TradingView Format | Directly Tradable? | Best Used For | Why Price Differs From Spot |
|---|---|---|---|---|
| Spot index | NSE:NIFTY | No | Directional bias, clean market structure, long-term support and resistance levels | Baseline reference. No basis, no expiry, no carry cost built in. |
| Current-month futures | NSE:NIFTY[expiry code] | Yes, with futures approval and margin | Intraday and swing execution, genuine volume and open interest data | Trades at a premium or discount to spot based on interest rates, dividends, and days to expiry. Basis narrows toward zero at settlement. |
| Continuous futures | NIFTY1! (front month) and NIFTY2! (next month) | No, it is a stitched series | Multi-year backtesting and forward testing, uninterrupted candlestick chart history | Splices consecutive contracts together, creating artificial gaps at each rollover point where old and new contract prices differ. |
| Individual option contract | Symbol plus expiry date, strike, and CE or PE | Yes, subject to broker permissions | Defined-risk directional trades, spreads, premium selling | Price reflects intrinsic value plus time value, driven by implied volatility and theta decay rather than spot movement alone. |
The continuous contract deserves a warning.
NIFTY1! is excellent for studying long-term behaviour, but those rollover seams are synthetic.
A backtest that assumes you could have held through a rollover gap is measuring something that never happened.
And the option row is where most losses originate.
A trader gets the index direction right, holds through a slow afternoon, and still loses money because time value bled out faster than the underlying moved.
The chart was correct.
The instrument had a clock attached.
Searching Nifty Correctly on TradingView
The search bar is doing more work than you think. Follow this sequence and the ambiguity disappears.
- Open the symbol search from the top-left ticker field. Click the current symbol name or press the forward slash key to jump straight into search from any chart.
- Type the instrument name, not just “Nifty.” A bare search returns index listings, CFD proxies, and international derivative products from exchanges that have nothing to do with the NSE.
- Filter by exchange before anything else. Use the exchange dropdown and select NSE. This single step eliminates CBOE listings, offshore contracts, and third-party synthetic instruments that track Nifty loosely at best.
- Filter by asset class next. TradingView separates indices, futures, and options into distinct category tabs. Choosing the right tab cuts a hundred results down to a handful.
- Confirm the expiry before you commit the symbol to a layout. Futures and options carry an expiry date in the description field. A contract in its final week behaves very differently from one with 25 sessions remaining.
- Check the top-right of the chart for the exchange and currency label. If it does not read NSE and INR, you loaded the wrong listing.
Multiple Nifty entries appear for a straightforward reason: the NSE lists weekly and monthly expiry cycles across index derivatives, and TradingView surfaces each active series separately. Contract specifications, lot sizes, and expiry schedules have all been revised more than once in recent years.
Verify the current active contract on the exchange’s own contract specification page.
Never copy a symbol string from a tutorial written two years ago.
Decoding a Nifty Option Ticker
An option ticker is a compressed sentence. Read it left to right and it tells you the underlying, the expiry, the strike, and the right being traded.
- Underlying identifier: The base name, NIFTY, confirming the contract references the Nifty 50 index rather than Bank Nifty, Fin Nifty, or a stock option.
- Expiry component: A date or coded reference to the settlement day. This is the single most important field, because it determines how much time value remains and how violently the premium will move on the final session.
- Strike price: The level at which the option can be exercised, listed in index points. Strikes are spaced at fixed intervals across the Nifty options chain.
- CE or PE suffix: CE denotes a call option, PE denotes a put. CE gains value as the index rises; PE gains as it falls, all else equal.
Here is the part that trips people up.
Expiry day conventions, weekly cycles, and strike intervals are set by the exchange and have been changed.
Confirm them on the official NSE contract page rather than assuming last year’s schedule still applies in 2026.
And one more time, because it matters: NSE:NIFTY cannot be traded.
It is a reference series for analysis.
Execution requires a futures contract, an option contract, an index ETF, or an index fund, routed through a broker account with the relevant segment activated.
Is Your Nifty Data Real-Time?
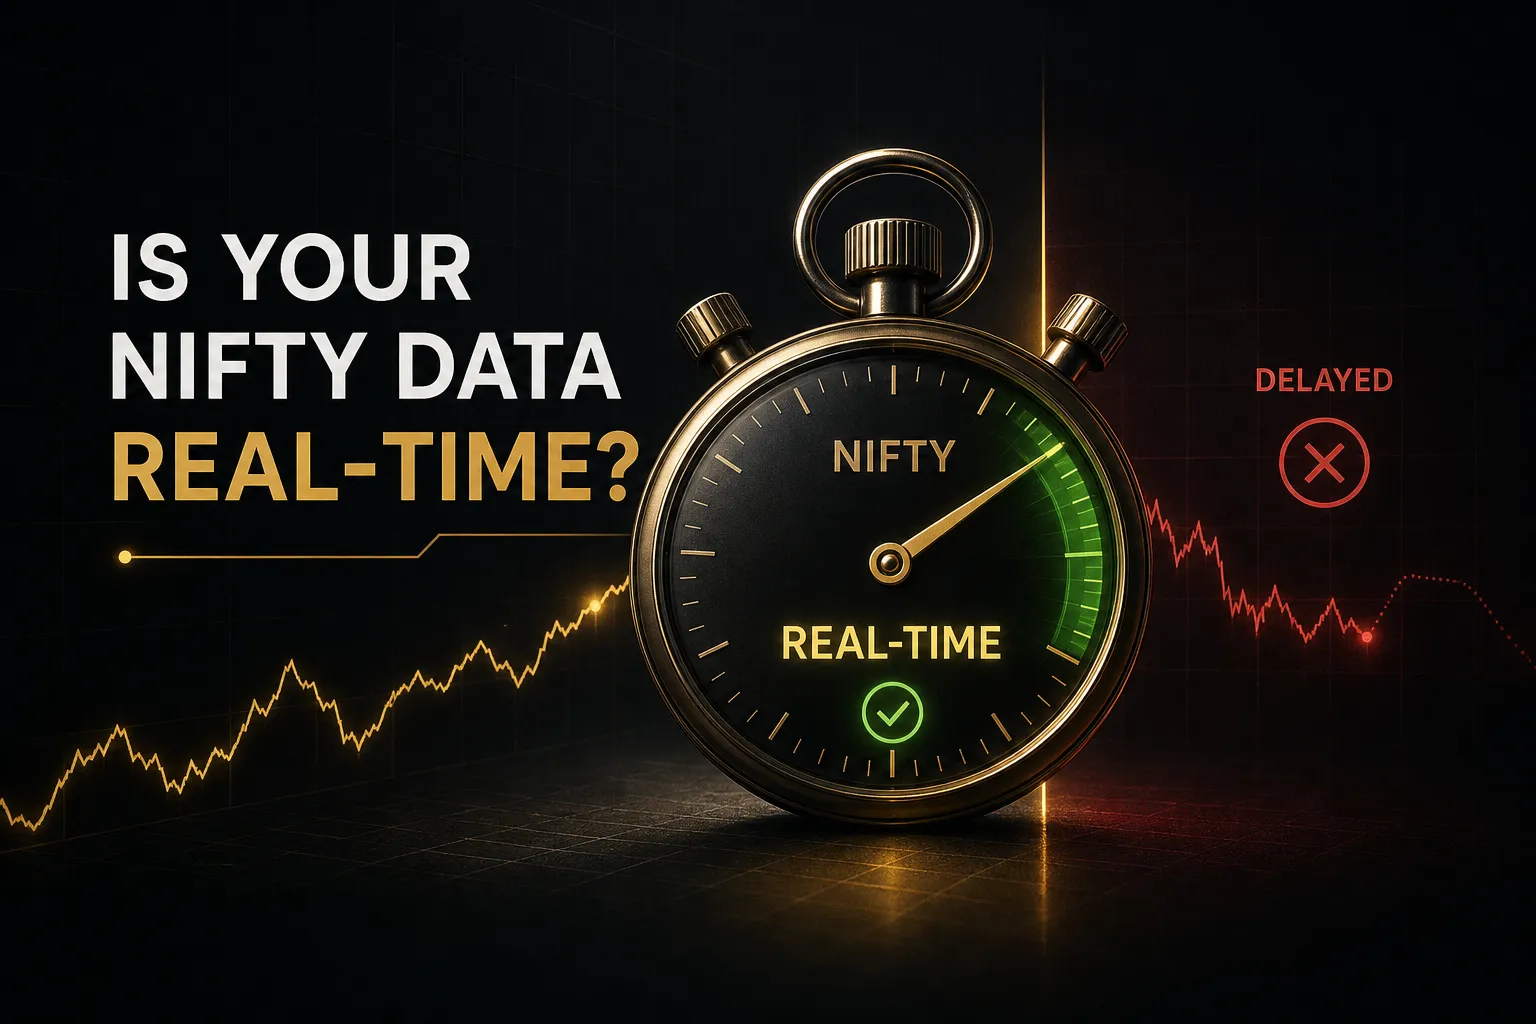
Assume your feed is delayed until you have proof otherwise.
That assumption will cost you nothing.
The opposite assumption can cost you a trade.
TradingView pulls Indian market data through three different pathways, and they are not equivalent.
Exchange-supplied real-time data comes directly from the NSE and requires an active market data subscription tied to your account.
Broker-supplied data arrives when you connect a supported Indian broker to TradingView, in which case the feed follows your broker’s own entitlement.
And the default for most new accounts is a delayed feed, typically running behind live prices by a fixed interval.
Fifteen minutes of lag is irrelevant for a weekly swing thesis.
On a 5-minute Nifty futures chart, it is fatal.
Checking takes seconds.
Look at the top-right corner of the chart near the symbol name, where TradingView displays a data status badge. A delayed feed carries an explicit “D” or delayed label with the lag duration.
Click it and the panel tells you exactly what entitlement you hold and what upgrading would provide.
Cross-check with the Data Window panel and the last-update timestamp during active market hours.
If the last bar has not refreshed while the market is clearly moving, you are watching history.
Now the correction that saves people money.
A paid TradingView subscription does not automatically include real-time NSE data.
Plan tiers govern features: indicator count per chart, alert limits, saved layouts, server-side alerts.
Exchange market data is a separate commercial arrangement, priced by the exchange and often requiring a signed non-professional or professional agreement.
Traders upgrade to a premium tier, see a delayed badge remain, and assume something broke.
Nothing broke.
Those are two different purchases.
Feature access and market data access are separate products. Upgrading one does not upgrade the other.
Even with a verified live feed, spot and futures will still print different numbers.
That divergence is structural, not technical.
Futures embed the cost of carry, so they trade at a premium or discount that compresses as expiry approaches.
Liquidity shifts between contracts during rollover week, meaning the front-month series can thin out while volume migrates to the next expiry.
And the final settlement session forces convergence, which produces price behaviour that looks erratic on a chart but is entirely mechanical.
Before blaming your feed, ask which contract you are looking at and how many sessions remain until it expires.
That question answers most divergence complaints.
Building a Repeatable Analysis Process
Most traders do not lose because their indicator was wrong.
They lose because they had no fixed sequence, so every chart got interpreted differently depending on mood, recent P&L, and whatever they read that morning.
A process fixes the sequence.
Here is how to build one.
Choosing the Right Timeframe
Timeframes are not interchangeable views of the same information. Each one recalculates every indicator on your chart from scratch, which is why a 20-period exponential moving average on the Daily and on the 5-minute are measuring two completely unrelated things.
- Daily chart sets the primary bias. This is where trend direction, major support and resistance, and multi-week market structure become legible. Decide “long bias, short bias, or stand aside” here, and nowhere else.
- H8 or H4 acts as the bridge. It shows whether the current pullback is a routine retracement within the daily trend or the start of a structural break. Skip this layer and you will repeatedly take counter-trend entries that feel obvious on the 5-minute.
- 15-minute chart defines the intraday plan. Session ranges, opening drives, and the levels that will matter for the next few hours. This is where you write down entry, stop, and target before the trade exists.
- 5-minute chart is for execution only. Trigger refinement, nothing more. It should never change your bias. If a 5-minute candle makes you abandon a daily thesis, the thesis was never real.
- VWAP resets with the session, not the timeframe. Volume-weighted average price anchors to the trading day, which is why it is a genuine intraday reference and near-meaningless on a Daily chart.
The rule: direction flows down from the higher timeframe, timing flows up from the lower one.
Never the reverse.
Indicators and Their Blind Spots
Every indicator was built for one market condition and fails predictably outside it. Knowing when to ignore a signal is more valuable than knowing when to take it.
- RSI is a range tool. It measures momentum extremes and works well when Nifty is chopping between defined boundaries. In a strong trend it pins above 70 or below 30 for days, and every “overbought” reading is a losing short. Ignore RSI reversal signals when the daily structure is making clean higher highs.
- MACD is a trend tool. It confirms momentum shifts and sustained direction. Inside a tight range it produces constant crossovers in both directions, most of which are noise. Ignore MACD crossovers when the daily range has compressed and price is oscillating around a flat moving average.
- EMA defines dynamic trend and slope. A rising 20 EMA above a rising 50 EMA is a legitimate trend filter. But EMAs lag by construction, so they confirm what already happened. They will never call a top.
- VWAP is for session-based entries. Institutional reference price for the day, useful for judging whether intraday buyers or sellers hold the advantage. It carries no information about tomorrow.
- Volume profile shows where trade actually occurred. High-volume nodes act as magnets and low-volume gaps get traversed quickly. It describes structure, not direction.
Then there is the problem nobody mentions in indicator tutorials: repainting indicators.
An indicator repaints when its value on the current, unclosed bar changes as new ticks arrive.
Scroll back through history and every signal looks perfectly timed, because history only contains closed candles.
Trade it live and the arrow that appeared at 11:04 quietly vanishes by 11:09.
The fix is simple and non-negotiable.
Act only on signals confirmed at candle close.
If a setup requires you to enter mid-bar because “the signal might disappear,” it was never a signal.
Confirmation Without Chart Clutter
Five indicators on one chart do not give you five opinions. They give you a guaranteed contradiction and an excuse to take whichever trade you already wanted.
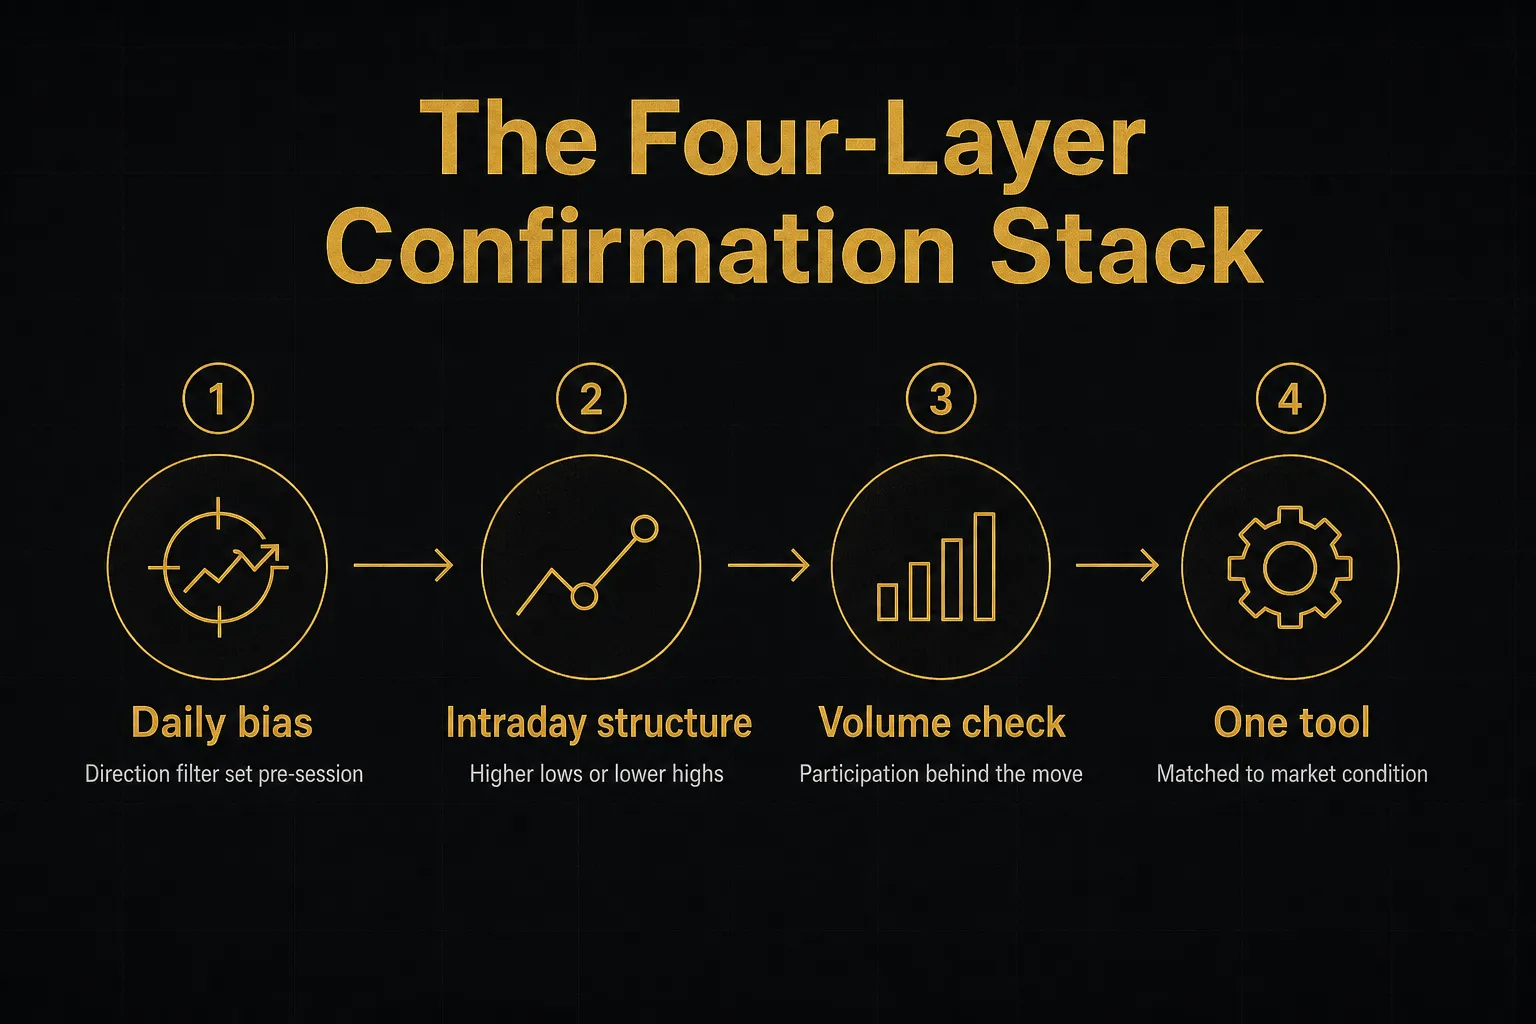
A workable confirmation stack has four layers and stops there.
- Higher-timeframe bias. Daily direction, established before the session opens. This is a filter, not a trade signal. It tells you which side of the market you are allowed to take today.
- Intraday market structure. On the 15-minute, is price making higher lows into resistance or lower highs into support? Structure beats every oscillator on the chart.
- Volume validation. Does the move you want to trade carry participation, or is it a thin drift? A breakout on declining volume near expiry is a trap more often than it is an opportunity.
- One confirmation tool. A single indicator matched to current conditions. Trending day, use EMA slope or MACD. Range day, use RSI or VWAP deviation. One. Not three.
Structured tools can handle this organisation for you.
PipTrend’s multi-timeframe table is a useful example of the approach: it presents alignment across several timeframes in one view and keeps the signal separate from the suggested entry level, so you can see whether the higher timeframe agrees before committing.
Two things worth understanding about any such tool.
Signals lock in only on candle close, which enforces the confirmation discipline described above.
And it is a structured confirmation layer, not a predictive oracle.
Alignment across timeframes improves the odds of a setup working.
It does not guarantee it, and no honest tool claims otherwise.
The goal is a chart you can read in three seconds.
If yours takes thirty, you have too much on it.
Alerts, Backtesting, and Risk Control
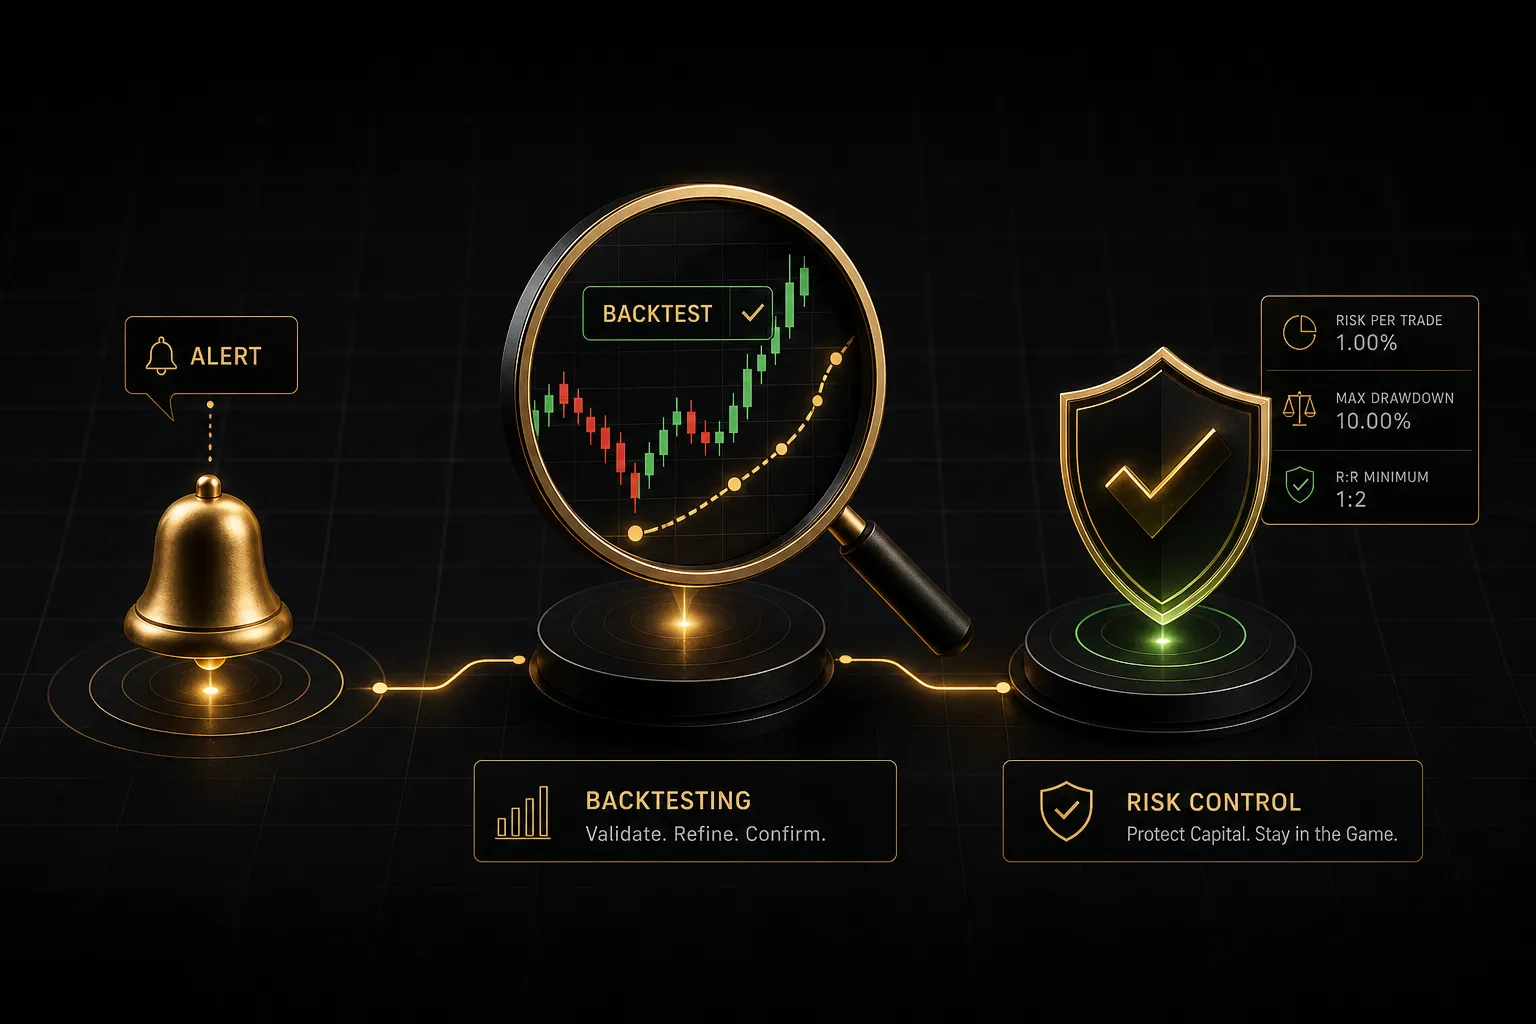
This is the section that separates traders who survive from traders who have great screenshots.
Analysis finds opportunities.
Alerts, honest testing, and risk control decide whether you are still trading in six months.
Setting Alerts That Actually Fire
Staring at a Nifty chart for six hours degrades judgment. Alerts let you wait without watching, but only if configured correctly.
- Price crossing alerts. The simplest form, triggered when Nifty crosses a specified level. Ideal for marking the boundaries of a known range or the level that invalidates your thesis.
- Indicator condition alerts. Fire when an indicator meets a defined criterion, such as RSI crossing 30 or an EMA crossover completing. Set the trigger to “Once Per Bar Close” rather than “Once Per Bar” to avoid intrabar noise.
- Drawing tool alerts. Attach directly to a trendline, horizontal ray, or channel you drew. As price approaches your marked structure, the alert moves with the line. Genuinely underrated.
- Custom Pine Script alerts. Built with Pine Script conditions, allowing multi-condition logic such as trend alignment plus a volume threshold plus a structure break in a single trigger.
- Verify the settings baked into every alert. An alert captures the indicator parameters at the moment you create it. Change the EMA length afterwards and the alert keeps firing on the old value silently. Recreate alerts after any parameter change.
One practical note: alerts tied to a specific futures contract die when that contract expires. Rebuild them on the new front-month series, or you will spend expiry week wondering why nothing triggered.
Why Backtests Mislead Traders
A strategy that returns 340% on the Nifty index chart can lose money in live option trading.
Not sometimes.
Routinely.
The reason is that the strategy tester measures the underlying, while your P&L comes from the instrument.
Those are governed by different mathematics.
- Implied volatility moves premium independently. Nifty can rally 80 points while your call option loses value, because an IV crush after an event compressed the premium faster than direction added to it. The index chart cannot show you this.
- Theta decay runs continuously. Every hour an option holds costs money, accelerating sharply in the final sessions before expiry. An index backtest treats time as free. Options do not.
- The Greeks act on the option, not the index. Delta changes as price moves, gamma accelerates that change near the strike, and vega tracks volatility sensitivity. A profitable index signal says nothing about how those interact on a specific contract.
- Slippage and execution risk are absent from chart backtests. The tester fills you at the exact bar price. Live, you get filled somewhere else, especially during fast moves or on illiquid strikes.
- Costs compound quickly. Brokerage, exchange transaction charges, STT, GST, and stamp duty all apply per leg. A strategy with a small statistical edge and high trade frequency can be net-negative purely on friction.
- Bid-ask spread widens where you least want it. Far out-of-the-money strikes and thin expiries can show spreads wide enough to erase a winning trade at entry.
- Liquidity near expiry is unstable. Depth thins, spreads widen, and the price action that looks tradable in hindsight was frequently untradeable in size.
- Rollover distorts continuous-contract results. NIFTY1! contains synthetic gaps at every contract switch. Backtests that trade through those gaps are recording profits from a price that never existed.
Backtest to reject bad ideas cheaply.
Then forward test on live data with real costs before risking meaningful capital.
Historical performance narrows the field; it does not validate the winner.
Protecting Capital in Futures and Options
Leverage is the entire reason Nifty derivatives are attractive, and the entire reason accounts disappear.
Same feature, both outcomes.
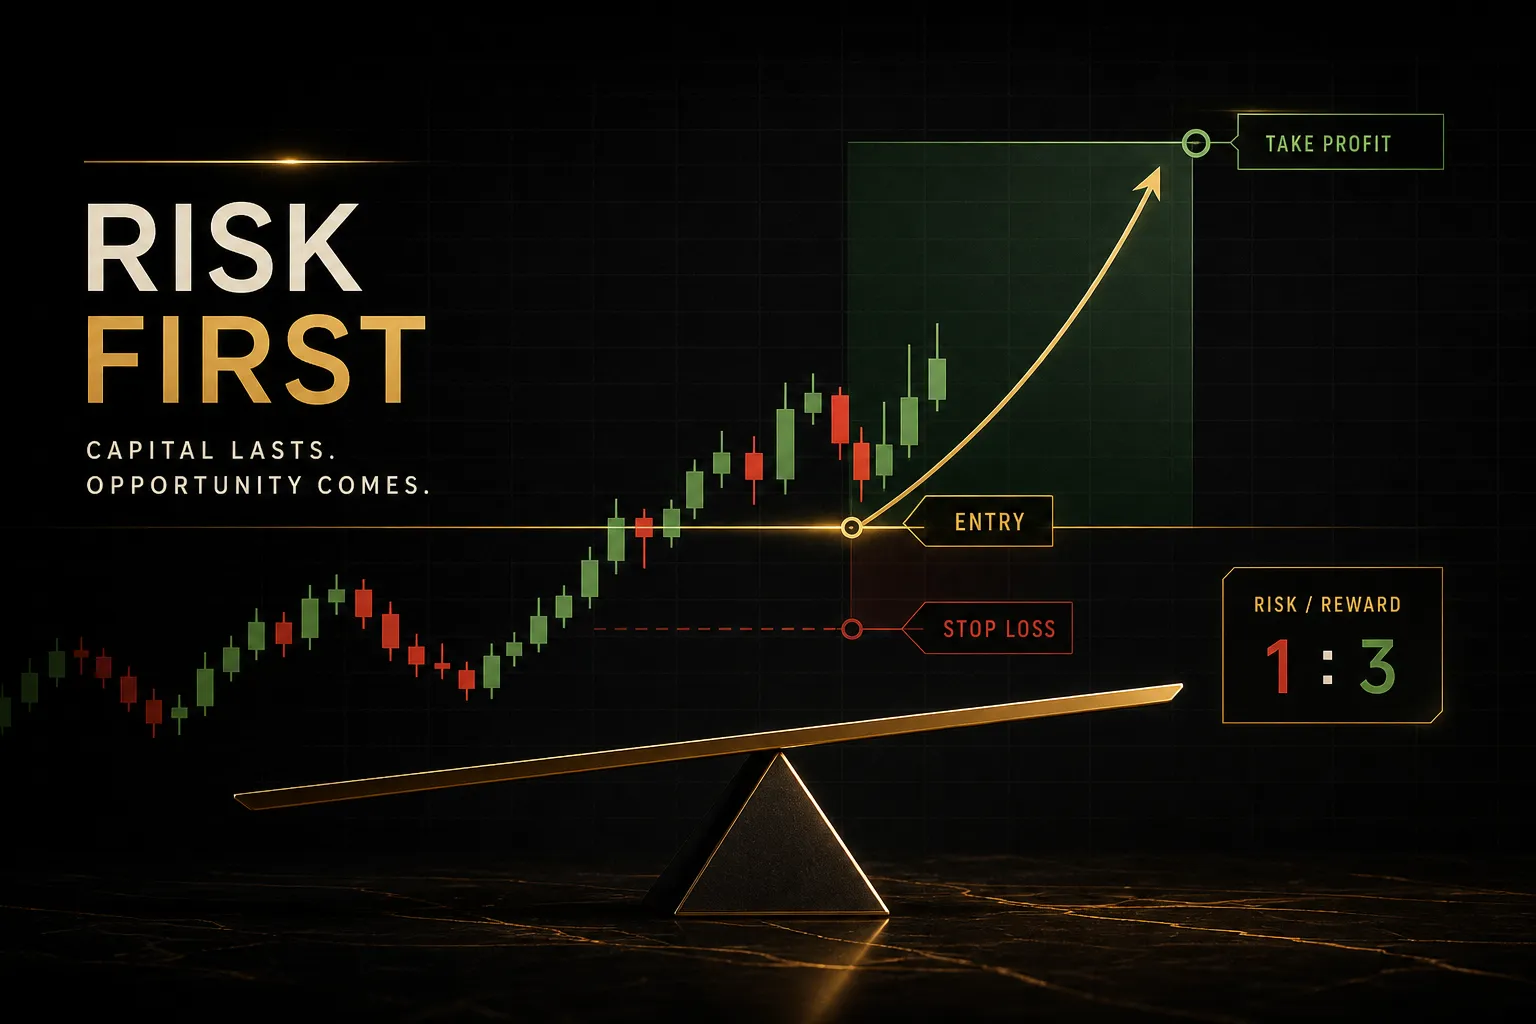
- Size positions against account equity, not available margin. Margin tells you the maximum position you are permitted to take. It is not a recommendation. Define maximum risk per trade as a fixed small percentage of capital and let that dictate contract quantity.
- Define the stop before entering, always. Place it where your analysis is proven wrong, typically beyond the structural level that formed your thesis. Deciding a stop after the position moves against you is not risk management, it is negotiation.
- Treat expiry sessions as a different market. Gamma effects near the money produce premium moves that ignore normal proportionality. Positions that behaved predictably for a week can swing violently in the final hours.
- Respect the cost of leverage in futures. Index futures move in large notional value per point. A move that reads as minor on the chart is not minor on a leveraged position, and mark-to-market losses hit the account daily.
- Cap total exposure across correlated positions. Three Nifty option positions in the same direction are one large directional bet wearing a disguise. Aggregate the risk before adding.
- Journal every trade with the same fields. Symbol and expiry, timeframe, entry reason, exit reason, planned versus realised reward-to-risk, and total cost. Consistency in recording is what makes the data useful.
- Review the metrics that actually measure a system. Win rate, average reward-to-risk ratio, maximum drawdown, and expectancy across a meaningful sample. Four winning trades tell you nothing. Forty tell you something real.
A 45% win rate with an average 2:1 reward-to-risk is a profitable system.
A 70% win rate with uncontrolled losses is a slow-motion account failure.
Judge the arithmetic, not the feeling.
Common Nifty TradingView Questions
What is the symbol for Nifty 50 in TradingView?
NSE:NIFTY is the spot index symbol for the Nifty 50 on TradingView.
It provides the cleanest chart for bias, structure, and long-term levels.
But it is not tradable, so use the futures, options, or ETF instruments covered in the symbol table for execution.
How do I add Nifty futures to TradingView?
Open the symbol search, filter the exchange to NSE, and select the futures category tab.
Choose the current-month contract for live trading, or use the continuous series NIFTY1! for extended historical study.
Always check the expiry date in the description field before saving it to a layout.
Can I see Nifty option charts on TradingView?
Yes, individual Nifty option contracts are chartable as standard symbols.
Search using the underlying name plus expiry, strike, and the CE or PE suffix, filtered to NSE.
Remember that option premium responds to implied volatility and theta decay as well as index direction, so those charts do not mirror the spot chart.
Is TradingView Nifty real-time?
Not by default.
Most accounts receive a delayed NSE feed unless you hold an exchange market data subscription or have connected a supported Indian broker.
Check the data status badge beside the symbol name on the chart, and note that upgrading your TradingView plan does not by itself grant real-time exchange data.
Which indicator is best for Nifty 50?
No single indicator is universally best, and any source claiming otherwise is selling something.
Trending conditions favour EMA slope and MACD; range conditions favour RSI and VWAP deviation.
Use one indicator as confirmation on top of higher-timeframe bias and market structure rather than as a standalone signal.
How do I set alerts for Nifty in TradingView?
Right-click the chart or use the alert panel, then choose your condition: price crossing, indicator condition, drawing tool, or a custom Pine Script trigger.
Set the frequency to fire on bar close to avoid intrabar noise.
Recreate alerts whenever you change indicator settings or roll to a new futures contract.
Your Next Step With Nifty
Before your next trade, do one thing.
Open the chart and confirm two facts: which exact symbol you are analysing, and whether the feed is live or delayed.
Thirty seconds.
That check catches more errors than any indicator will.
The decision logic underneath everything here is compact enough to keep on a sticky note.
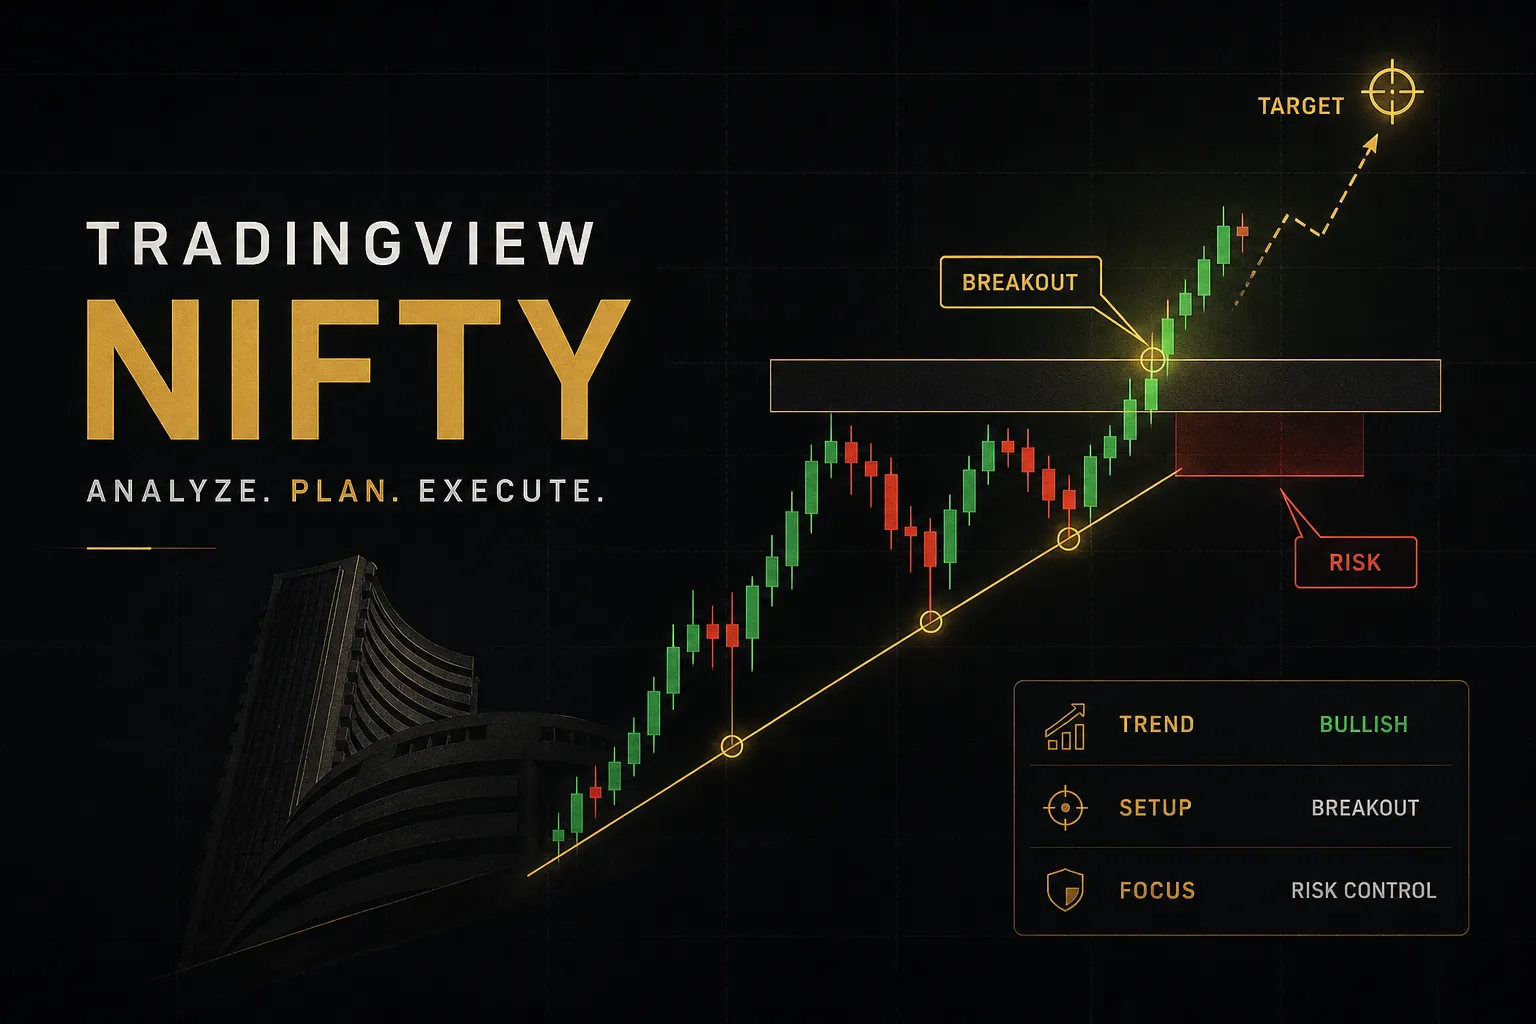
Use NSE:NIFTY spot for directional bias and structural levels.
Execute in futures or options, with full awareness of basis, expiry, and premium behaviour.
Set direction on the Daily, refine on the 15-minute, and trigger on the 5-minute with a single confirmation tool.
Act only on closed candles.
What that leaves out is the search for a perfect signal, and that omission is deliberate.
Consistent Nifty analysis does not come from finding the indicator nobody else knows about.
It comes from doing the same sequence every session, recording the results honestly, and letting a large enough sample tell you whether your edge is real.
Most traders will keep changing indicators after every losing streak.
The ones who improve change something else entirely: they fix the process, verify the data, control the size, and review the numbers.
Boring work.
It also happens to be the work that pays.
Sources
Risk Disclaimer: Trading involves risk. Past performance doesn't guarantee future results. Only trade with money you can afford to lose. PipTrend is a tool to assist your trading decisions, not financial advice.