The Honest Trader's Guide to SMC Trading
On this page
The Honest Trader’s Guide to SMC Trading
The Honest Trader’s Guide to SMC Trading
What SMC Trading Really Means
SMC trading (Smart Money Concepts) is a discretionary framework for reading market structure, liquidity, and how price moves between imbalance zones.
It is not a data feed.
It does not show you institutional orders.
That distinction matters more than any chart marking you’ll learn.
When a YouTube chart says “smart money accumulated here,” what actually happened is that price swept a prior low and reversed.
The first is a story.
The second is observable.
This guide takes a specific approach: every piece of SMC vocabulary gets converted into an explicit, testable chart rule.
Not a hindsight screenshot with arrows drawn after the fact. A rule you could have applied in real time, with a defined invalidation point.
Because here’s the uncomfortable truth about most SMC education.
The concepts describe price behavior reasonably well. The claims about why that behavior happens are unproven.
An order block is a real, markable price zone. The idea that a bank’s unfilled orders are sitting inside it is an assumption nobody can verify from a retail chart.
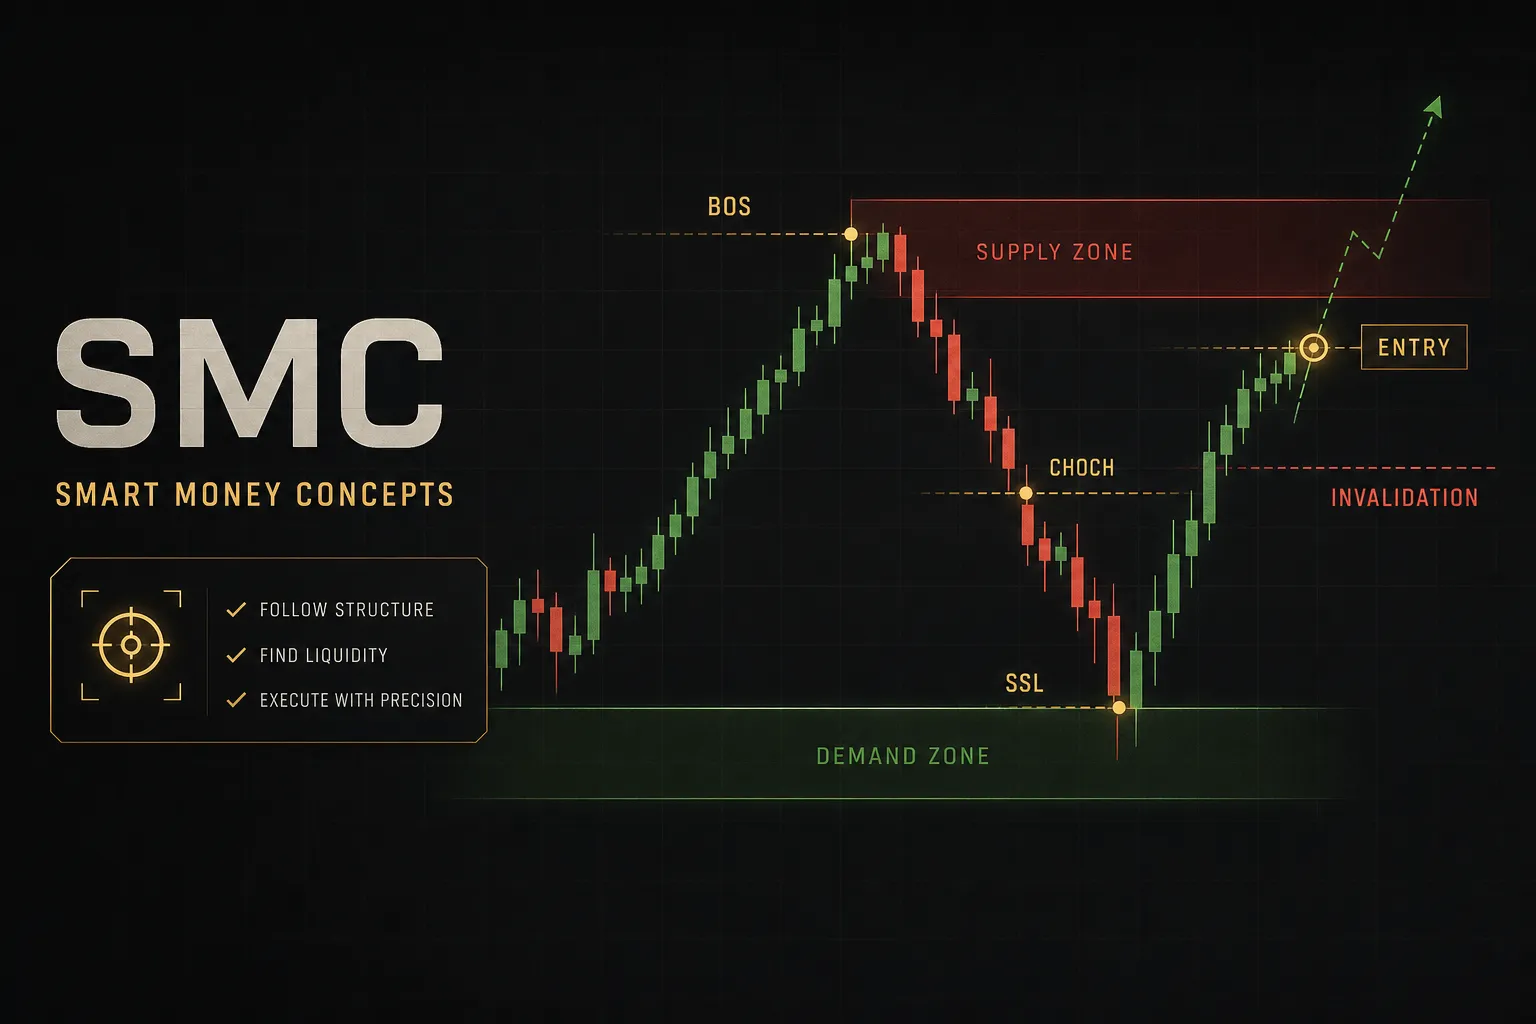
We’ll cover the full toolkit: break of structure, change of character, market structure shift, buy-side and sell-side liquidity, order blocks, fair value gaps, and displacement. Then we’ll build a step-by-step entry model with stop-loss placement and position sizing rules you can backtest.
Applications span forex, stocks, futures, indices, and crypto, with the differences between them spelled out.
Volume data exists in some of those markets.
It doesn’t in others.
That changes what you can honestly claim.
Where SMC Comes From and How Structure Shifts Work
Almost nothing in Smart Money Concepts was invented after 2010.
The vocabulary was.
The price behavior it describes has been documented for over a century.
SMC vs ICT Trading
ICT (Inner Circle Trader) is the original source of most SMC terminology, and “SMC” is largely a public rebranding rather than a separate strategy. Michael Huddleston’s ICT material introduced fair value gaps, order blocks, breaker blocks, mitigation blocks, premium and discount within a dealing range, and killzone session timing.
When traders debate SMC vs ICT trading, they’re usually arguing about presentation.
ICT content tends to be more elaborate: specific session windows, seasonal tendencies, deep model variations. SMC content tends to be a stripped-down subset focused on structure, liquidity, and entry zones.
There is no meaningful edge difference between the two labels.
If a course sells “SMC” as a proprietary discovery, that’s marketing.
Roots in Dow, Wyckoff, and Supply/Demand
Charles Dow described trends as sequences of higher highs and higher lows or lower highs and lower lows in the late 1890s.
That’s market structure.
The naming is newer; the observation isn’t.
Richard Wyckoff went further in the 1930s.
His spring is a probe below support that traps sellers before a markup phase. Modern SMC calls that a sell-side liquidity sweep.
His upthrust is a probe above resistance that traps buyers, now relabelled as a buy-side sweep.
Wyckoff’s accumulation and distribution phases map closely onto what SMC traders call ranges with liquidity at both extremes.
Classic supply and demand zone trading, popular throughout the 2000s, marked areas where price left rapidly and reacted on return. An order block is a narrower version of the same idea with a candle-level definition.
The price behavior SMC describes is real and old. The institutional-intent narrative attached to it is new and unverified. Keep those separate and the framework becomes much more useful.
BOS, CHoCH, and MSS Confirmed Correctly
Here’s where most traders lose money without realising it.
The three core structure terms are defined inconsistently across the internet, which means two traders can look at the identical chart and label it differently.
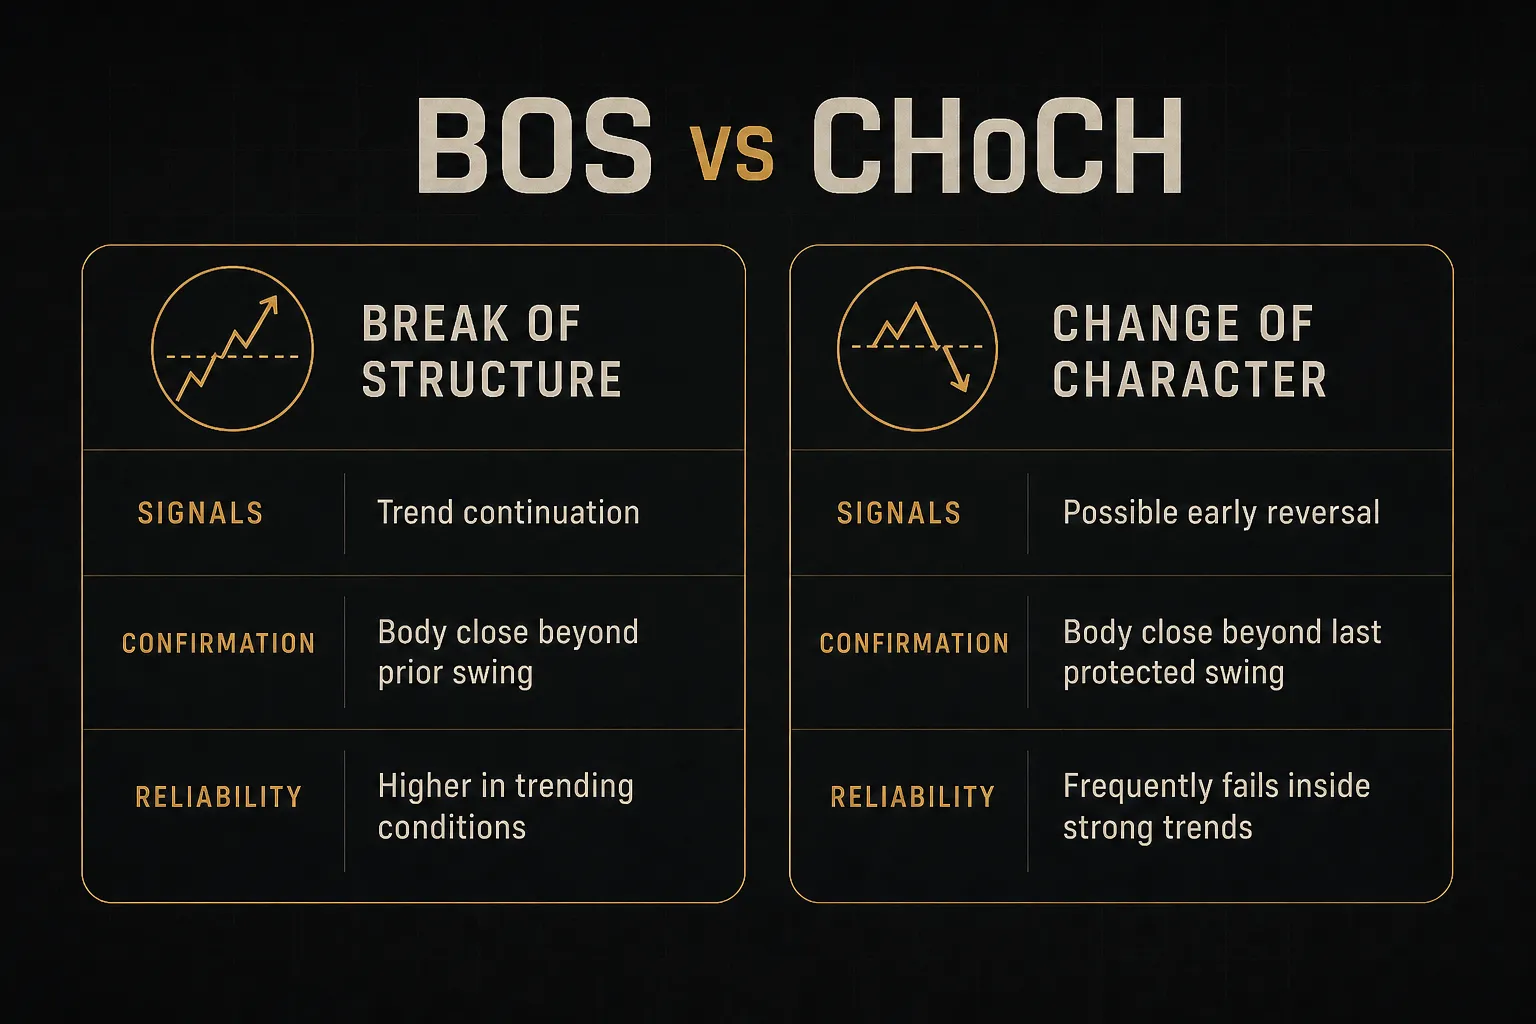
Break of Structure (BOS) signals trend continuation. In an uptrend, it’s price taking out the most recent confirmed swing high while the sequence of higher lows remains intact.
Confirmation rule: require a candle body close beyond the swing point on your working timeframe.
A wick through it is a sweep, not a break.
Change of Character (CHoCH) is an early reversal warning. In an uptrend, it’s the first break of the most recent higher low after a failed attempt to make a new high.
It is a warning, not a confirmation.
CHoCH signals fail regularly inside strong trends.
Market Structure Shift (MSS) is confirmed reversal. It requires the CHoCH break to happen with displacement: an expansive candle or candle cluster that closes well beyond the level and typically leaves an imbalance behind.
Slow, overlapping candles drifting through a low do not qualify.
Write those thresholds down as numbers.
For example: displacement means a candle whose range exceeds 1.5x the average of the prior 10 candles, closing in the top or bottom 25% of its range.
Arbitrary? Somewhat.
But arbitrary-and-consistent beats vague-and-flexible, because only the first can be backtested.
Liquidity, Order Blocks, and Fair Value Gaps
A wick through an old high means one thing for certain: some orders got filled there.
It does not mean the market is reversing.
Traders who treat every sweep as a reversal signal lose money on trend days, which is exactly when the moves are largest.
Liquidity Sweeps and Buy/Sell-Side Liquidity
Liquidity in SMC refers to price levels where resting orders are likely clustered. The logic is simple: stops and pending entries pile up just beyond obvious swing points.
- Buy-side liquidity sits above old highs. Short-sellers place protective stops there, and breakout buyers place entry orders there. Both become buy orders when triggered.
- Sell-side liquidity sits below old lows, for the mirrored reason. Long stops and breakdown short entries both fire as sell orders.
- Equal highs and equal lows (sometimes called double tops with matching wicks) concentrate this effect. Two or more touches at a near-identical price build a visible shelf that attracts more resting orders than a single random swing.
- A liquidity sweep is a wick beyond such a level followed by a rejection back inside the prior range. The critical qualifier: it only becomes a tradable signal when structure shifts afterward. Sweep plus CHoCH plus displacement is a setup. A sweep alone is noise.
- The honest caveat about OTC forex. Retail forex traders have no centralized order book. You cannot see resting orders, depth, or genuine order flow. “Liquidity” in this context is inferred from price levels and human behavioral logic, not confirmed from market microstructure data. Futures and equities traders can at least check real volume and depth of market.
What Makes an Order Block Valid
An order block is the last opposing candle before a displacement move that breaks structure. In a bullish case: the final down candle before an expansive rally that takes out a swing high.
Most order blocks marked on social media wouldn’t pass a basic quality filter.
Use these four:
- Freshness. An untouched block that price hasn’t returned to since formation is more reliable than one already retested twice. Each retest consumes whatever orders were there. After two clean retests, drop the zone.
- Displacement strength. The move away from the block must be decisive: large-bodied candles, minimal overlap, ideally leaving a fair value gap behind. A block followed by a slow drift is a coincidence, not a zone.
- Location within the dealing range. Buy from discount (below the 50% level of the current dealing range), sell from premium (above it). Buying a bullish block sitting in premium is buying at the worst available price.
- Structural relevance. The displacement from the block should have caused a BOS or MSS. If nothing structurally changed, the block is decoration.
Two variants worth knowing.
A breaker block is a failed order block that price closes through and then retests from the other side, flipping its role.
A mitigation block is the last opposing candle before a move that fails to fully break structure, generally weaker and worth treating as a lower-confidence zone.
Fair Value Gaps and Displacement
A fair value gap (FVG) is a three-candle imbalance: the wick of candle one and the opposite wick of candle three fail to overlap, leaving a price range that traded in only one direction. Think of it as a stretch of chart the market covered too fast to transact properly at every level.
- Full mitigation means price traded entirely back through the gap, closing it. The FVG is then spent and should be removed from your chart.
- Partial mitigation means price entered the gap and reversed before filling it. Many traders use the 50% level (the consequent encroachment) as the working entry reference.
- Displacement is the engine that creates these gaps: a high-momentum candle or sequence that moves price so quickly it skips levels. Displacement is what separates a real structural break from a drift.
- The mitigation trap. Gaps do not have to fill. Trending markets leave unfilled gaps for weeks. Treating an open FVG as a guaranteed price magnet is one of the fastest ways to fight a trend and lose.
Two warnings apply to both order blocks and FVGs.
First, most of them do nothing.
On a single H1 chart you might mark twenty zones in a week and see two produce a clean reaction.
Second, and more damaging: marking zones after the move already happened teaches you nothing.
If you can only identify the valid block once you can see the reaction, your model has no predictive content.
A Testable SMC Entry Model
Vocabulary doesn’t make money.
Rules do.
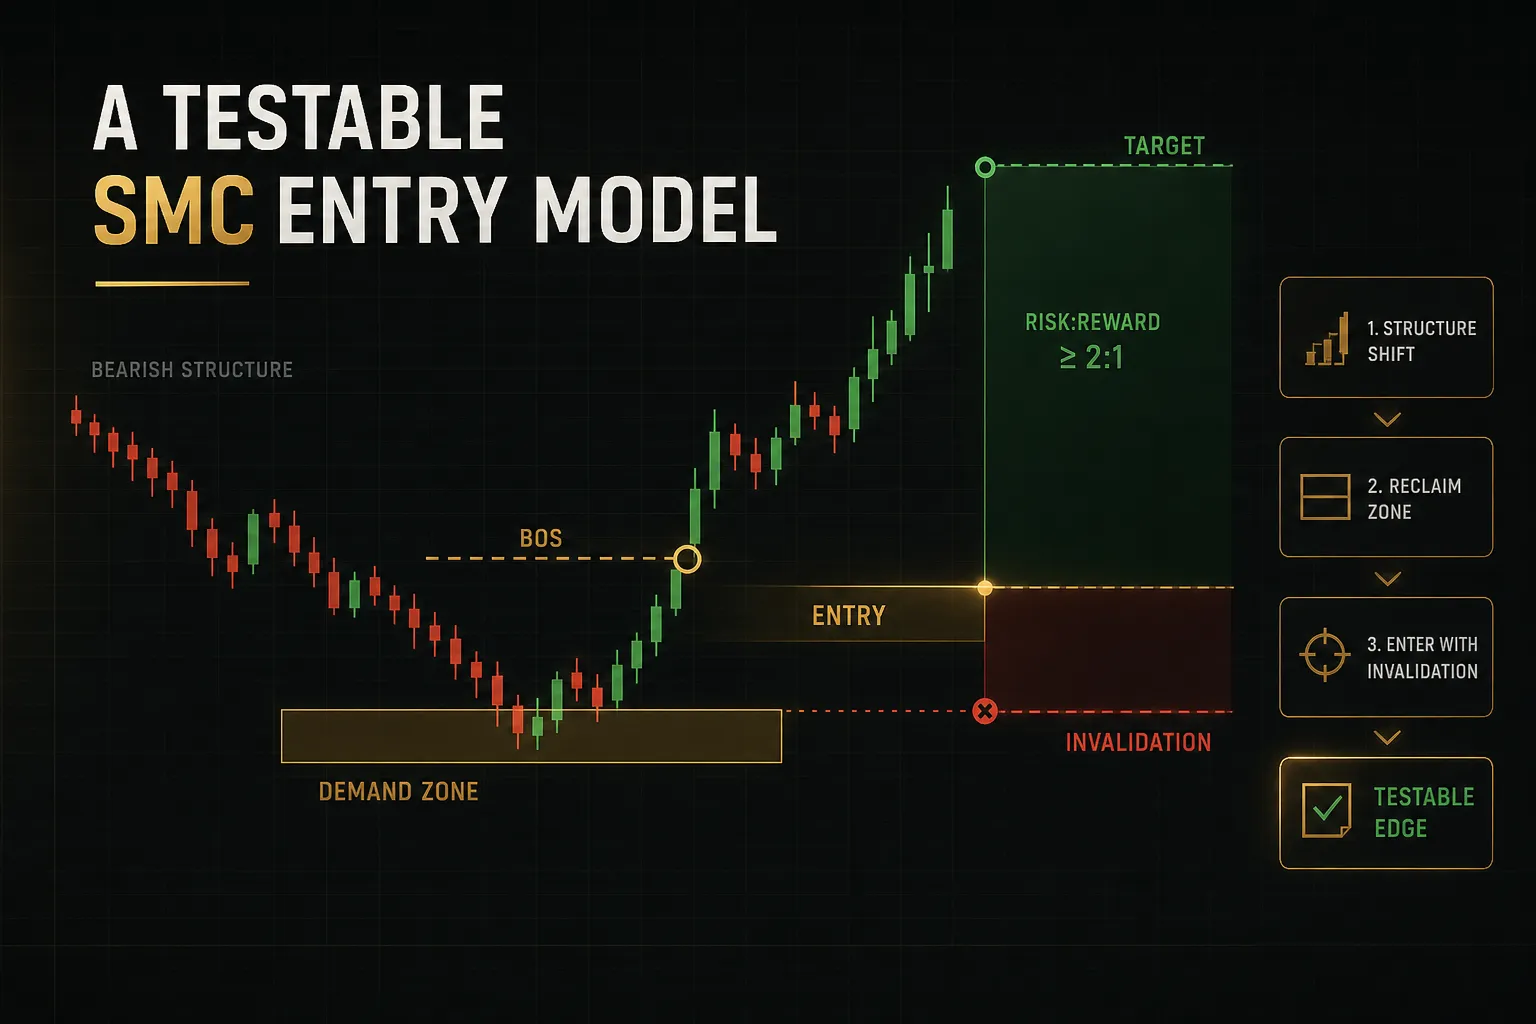
What follows is one complete, beginner-appropriate model with every threshold specified, so you can grade it honestly over a sample of trades.
Step-by-Step Entry Rules
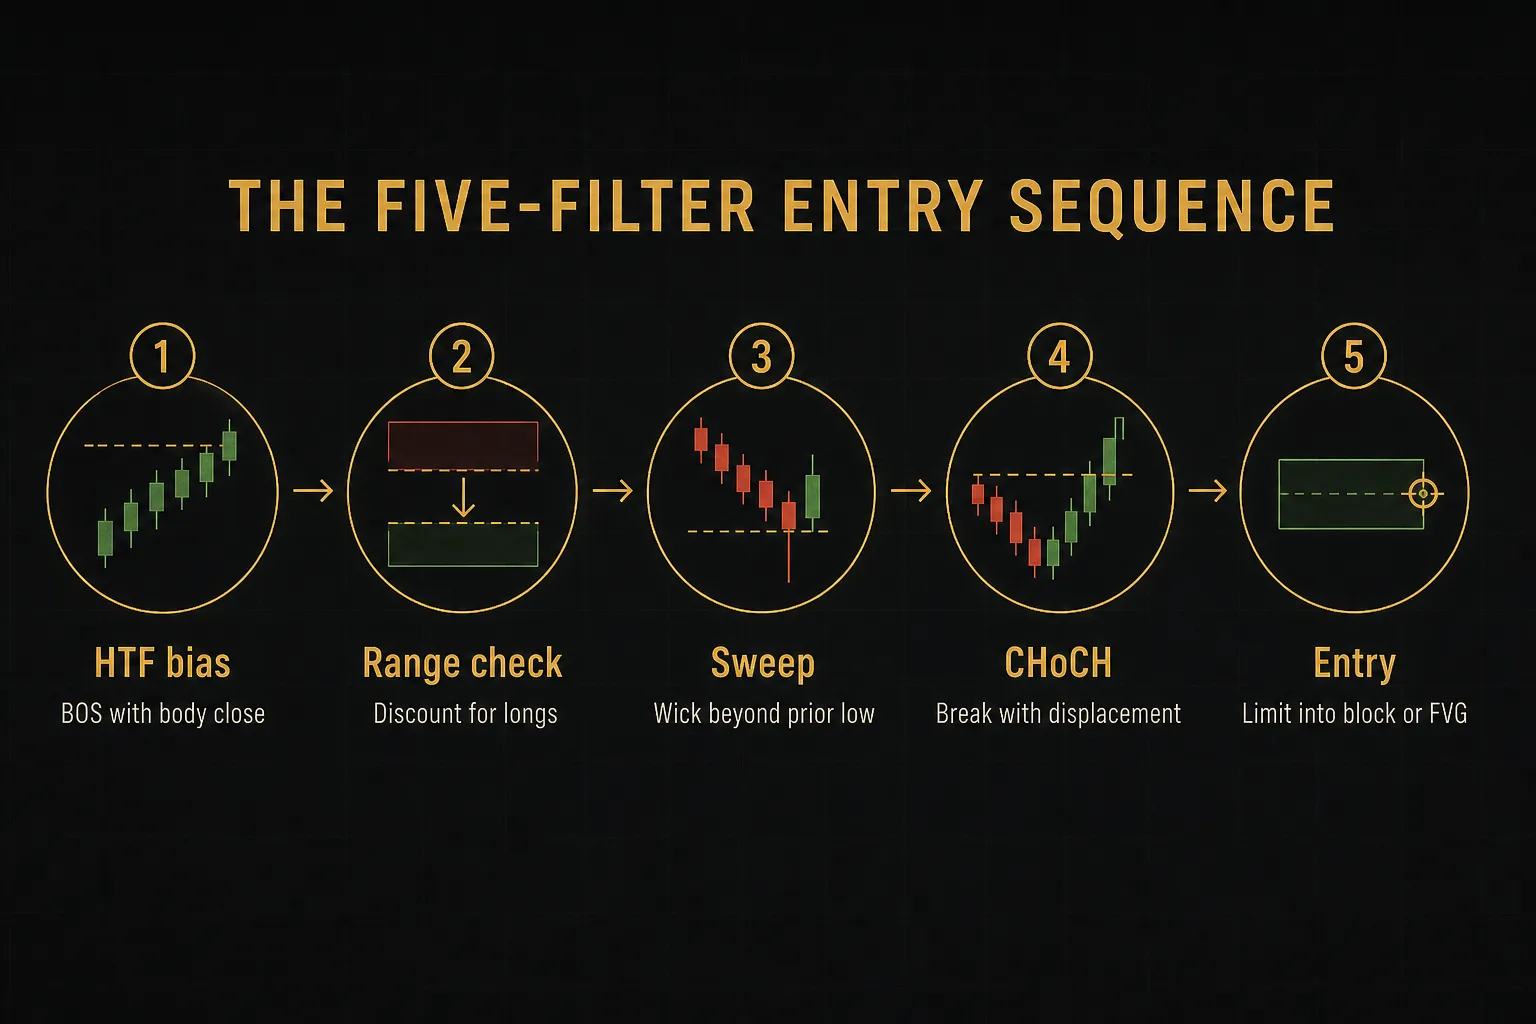
- Establish higher-timeframe bias. On H4 or Daily, identify the most recent BOS with a body close. Bullish BOS means you only look for longs. Bearish means shorts only. No BOS in the last 20 candles means no bias, so no trade.
- Define the dealing range and mark premium/discount. Take the most recent significant swing low to swing high on the bias timeframe, then split it at 50%. Longs are only valid in discount; shorts only in premium.
- Wait for a liquidity sweep into your zone. Price must wick below a prior swing low (for longs) inside discount, ideally an equal-lows shelf. The wick must be rejected with a close back above the swept level.
- Drop to the entry timeframe and require a CHoCH with displacement. On M15 or H1, price must break the last lower high with a body close, using a candle whose range exceeds 1.5x the 10-candle average. No displacement, no trade.
- Identify the entry zone left by that displacement. Mark either the order block (last down candle before the break) or the fair value gap inside the displacement leg. Pick one and stay consistent across your entire sample.
- Enter on retracement into that zone. Use a limit order at the zone’s proximal edge or the FVG 50% level. If price never returns, the trade simply doesn’t happen. Chasing is a separate strategy with separate statistics.
- Define invalidation before entering. The setup is dead if price closes below the sweep low (for longs). That is your stop level, decided before you click.
- Set the target rule in advance. Default: the next opposing liquidity pool, meaning the nearest prior swing high with clustered wicks. Secondary rule: if that target sits closer than 2R, skip the trade.
Stop-Loss and Risk Management
Stop-loss placement belongs at the structural level that invalidates your idea, not at a round pip number. If your thesis is “sellers failed at this low,” then a close below that low proves you wrong.
That’s where the stop goes, plus a small buffer for spread.
A 15-pip stop on a setup that needs 40 pips of room isn’t tight risk management.
It’s a donation.
Position sizing flows from stop distance, not the reverse.
Fix your risk per trade at a percentage of account equity, commonly 0.5% to 1% for developing traders, then calculate lot size from the distance to invalidation.
A $10,000 account risking 1% with a 40-pip stop on EUR/USD sizes at roughly 0.25 lots.
Same account, 80-pip stop, half the size.
Now the part most SMC content skips entirely. Trade expectancy is what determines whether a model survives, and it needs a real sample.
Expectancy = (win rate × average win) − (loss rate × average loss).
A model winning 40% at 3R average return is strongly profitable. A model winning 70% at 0.4R is not.
Judge on 100 trades minimum; 30 trades tells you almost nothing statistically.
And the frictions.
Spread widening at the London open, slippage on stop fills during news releases, and gap risk over weekends can each convert a well-planned 3:1 risk-to-reward ratio into 2:1 or worse.
Log those costs in your journal instead of assuming perfect fills, because a backtest with perfect fills is fiction.
Backtesting Without Hindsight Bias
Hindsight bias is the single largest reason SMC traders believe they have an edge they don’t have. The fix is a written protocol you cannot bend mid-test.
- Entry trigger: one sentence, no alternatives. “Limit at proximal edge of the order block formed by the CHoCH displacement leg.”
- Stop rule: one sentence. “Two pips beyond the sweep extreme.”
- Target rule: one sentence. “Nearest opposing swing high with two or more matching wicks.”
- Session window: specify it. London 07:00 to 11:00 UTC, or New York 12:30 to 16:00 UTC. Session timing changes results substantially, so test one window at a time.
- Excluded setups: list them explicitly. No entries within 30 minutes of tier-one economic releases. No zones with more than one prior retest. No trades where the stop exceeds 1.5x your average.
- Ambiguity rule: if you need more than 20 seconds to decide whether a structure label qualifies, it doesn’t. Mark it “skipped, ambiguous” and move on. Count those skips, because a model requiring constant judgment calls will not survive live pressure.
- The real-time test: for every logged trade, ask whether that structure label would have been visible before the reaction. Use bar replay with the future hidden. Not a scrolled-back chart where your eye already knows the answer.
Applying SMC Across Markets and Tools
The same rules produce different results in different markets, and the reason is structural, not psychological.
Timeframes and Instrument Differences
Start with multi-timeframe analysis on two charts only. H4 or Daily for bias, M15 or H1 for entries.
Beginners who stack four timeframes usually end up finding a bullish signal on one and a bearish signal on another, then trading whichever matches their mood.
Market-by-market, the differences are real:
Forex is decentralized and OTC, so there is no consolidated volume. Tick volume from your broker measures price changes, not contracts traded.
Any SMC claim that leans on volume in spot forex is inference at best.
Futures (ES, NQ, CL, 6E) offer genuine centralized volume, time and sales, and depth of market. If you want to check whether a liquidity narrative holds up against actual order flow, this is the honest place to do it.
Stocks and indices have real volume plus opening auctions and overnight gaps, which create imbalances no forex chart produces.
Earnings dates override technical structure completely.
Crypto trades 24/7, and weekend liquidity is thin.
Sweeps run further, wicks look more dramatic, and reversals often stall until Monday volume arrives. Fragmentation across exchanges also means a swept high on one venue may not be swept on another.
When There’s No Trade
The most profitable skill in SMC is recognising the absence of a setup.
Use this decision tree, in order:
Higher-timeframe BOS bullish and lower-timeframe CHoCH bullish? Take the setup with defined risk.
Signals conflict, meaning HTF bearish while LTF turns bullish? Stand aside, or cut size to a third if you must participate.
Price sitting mid-range with no clear dealing range extremes? No trade.
Your target zone already retested twice? Skip it.
Displacement absent from the structural break? Skip it.
Tier-one data release within the hour? Wait.
Count your skips in your journal alongside your trades. A well-defined SMC model produces far more skips than entries, and traders who force entries on thin days destroy the expectancy they built on good ones.
Indicators as a Consistency Aid
No indicator confirms institutional intent.
What a well-built tool can do is remove inconsistency from your own marking, which is a genuine problem worth solving.
A tool like PipTrend illustrates the honest use case.
Its multi-timeframe table shows structure state across several timeframes at once, so you check alignment rather than eyeballing it.
Marked session levels, VWAP, and fair value gaps appear according to fixed logic, meaning the same chart produces the same zones every time, whether you’re fresh at 8am or tired at 4pm.
That consistency is the actual value.
Being non-repainting matters here too: a level that quietly redraws itself after the fact makes any backtest meaningless.
What it doesn’t do: predict outcomes.
Direction signals and suggested entry levels remain separate features that you should test independently, with their own statistics.
An indicator organizes information.
Your risk rules and your sample size determine your results.
Frequently Asked Questions About SMC Trading
What is SMC strategy in trading?
SMC strategy is a discretionary framework that reads market structure, liquidity levels, and imbalance zones to time entries. The typical sequence is: establish higher-timeframe bias from a break of structure, wait for a liquidity sweep into discount or premium, require a change of character with displacement, then enter on a retracement into an order block or fair value gap with a structural stop.
It is a method for organizing chart observations into rules.
It is not a feed of institutional order data.
Is SMC better than price action?
SMC is price action, with a specialized vocabulary layered on top. The two are overlapping frameworks, not competing ones.
SMC adds precise definitions for zones and structural breaks, which helps consistency. It also adds unverifiable claims about institutional intent, which help nothing.
A trader using classic support, resistance, and trend analysis with strict risk rules can achieve the same results as an SMC trader.
The rules and the sample size decide the outcome, not the terminology.
What is the best SMC trading strategy for beginners?
The simplest workable model uses two timeframes and one setup type. Take bias from H4 break of structure, wait for a sweep of a prior swing low inside the discount half of the dealing range, require an M15 change of character with a displacement candle exceeding 1.5x the recent average range, then enter the resulting fair value gap with your stop beyond the sweep extreme.
Risk 0.5% per trade.
Log 100 trades before judging it.
One setup executed identically beats five setups executed loosely.
What is the difference between BOS and CHoCH in SMC?
A break of structure signals trend continuation, while a change of character signals a possible early reversal.
In an uptrend, BOS is a body close above the most recent swing high with higher lows intact. CHoCH is the first body close below the most recent higher low after a failed push for a new high.
BOS confirms what’s already happening.
CHoCH is a warning that becomes a market structure shift only when the break comes with displacement.
How do you identify liquidity in SMC trading?
You identify liquidity by marking price levels where resting orders logically cluster: above old highs (buy-side), below old lows (sell-side), and especially at equal highs and equal lows where multiple touches build a visible shelf.
In OTC forex you are inferring these levels from price behavior, because no centralized order book exists. In futures and equities you can cross-check against real volume and depth.
Either way, a sweep only becomes actionable when structure shifts behind it.
Is SMC trading real or just a trading theory?
The price patterns are real and observable; the institutional explanation attached to them is theory. Liquidity sweeps, imbalances, and structural breaks appear on charts and can be measured, tested, and backtested by anyone.
What cannot be verified from a retail chart is that a specific bank left unfilled orders in a specific zone.
Trade the observable patterns with defined risk.
Ignore the narrative, and be skeptical of anyone selling it as certainty.
Make Your Next SMC Setup Testable
Do one thing before your next trade.
Write three lines on paper: the exact entry trigger, the exact price that invalidates the idea, and the target.
Before you enter, not after.
If you cannot write those three lines clearly, you don’t have a setup.
You have a feeling with SMC vocabulary attached.
The decision summary is short.
Higher and lower timeframe signals agree? Take it with defined risk and pre-calculated position size.
They conflict, or displacement is missing, or the zone has already been retested twice? Stand aside and log the skip.
Smart Money Concepts gives you a precise language for describing what price does around old highs, old lows, and imbalances. That language becomes useful only when it hardens into rules you can grade in a journal across a hundred trades.
Everything before that point is… vocabulary.
Grade the rules.
Keep what survives.
Sources
Risk Disclaimer: Trading involves risk. Past performance doesn't guarantee future results. Only trade with money you can afford to lose. PipTrend is a tool to assist your trading decisions, not financial advice.