On this page
Why Traders Watch Nikkei Futures Live
By the time the Tokyo Stock Exchange rings its opening bell, the Nikkei has already been trading for hours.
Sometimes for most of a full day.
Nikkei 225 futures run close to 23 hours across CME Globex, the Osaka Exchange, and Singapore, which means the Nikkei Stock Average effectively has a price around the clock even when the cash market is dark. That continuous quote is why traders across Europe and the US treat it as the first readable signal of Asian risk appetite.
It’s also why so many people misread it.
A “live” Nikkei futures quote is not one number.
It’s three exchanges, two currencies, several contract sizes, and at least one timezone that refuses to observe daylight saving. Pull up a chart on a free site and you may be looking at a delayed CME quote in US dollars while assuming you’re seeing the Osaka JPY contract in real time.
The two can differ by hundreds of points.
The most common mistake isn’t reading the chart wrong. It’s reading the wrong chart.
This guide takes a workflow approach rather than a definitions approach.
First, verify exactly which futures contract you’re watching. Second, convert the session hours into your own clock.
Third, compare the futures price against the cash index to measure the premium or discount. Only then do you layer in the USD/JPY exchange rate and the scheduled events on the Japanese economic calendar.
Do those four things in order and a live futures quote becomes genuinely useful context.
Skip them, and you’re trading on a number you don’t actually understand.
Know Your Contract Before You Watch It
Three exchanges list Nikkei 225 futures, and they do not produce identical numbers.
The difference isn’t a rounding error.
A USD-denominated CME contract and a JPY-denominated Osaka contract can drift apart whenever the yen moves, because one of them carries currency exposure baked into the price and the other doesn’t.
CME, JPX, and SGX Explained
The Japan Exchange Group runs the Osaka Exchange, the home market for the Nikkei contract and the venue with the deepest yen-denominated liquidity during Asian hours.
CME Globex lists the dollar and yen versions for US-hours traders. Singapore’s SGX (now SGX Nikkei futures under the derivatives arm) offers a third pool, historically popular with regional institutions.
| Feature | CME (Chicago) | Osaka / JPX | SGX (Singapore) |
|---|---|---|---|
| Primary tickers | NKD (USD), NIY (JPY), MNK (Micro USD) | NK225, NK225M (mini), NK225MC (micro) | SGX Nikkei 225 (NK), USD Nikkei |
| Currency | USD and JPY versions listed | Japanese yen only | Yen and USD versions |
| Local trading hours | Sunday 5:00pm to Friday 4:00pm US Central, with a daily 60-minute break | Day 8:45am to 3:40pm JST; Night 5:00pm to 6:00am JST | T session 7:45am to 2:25pm SGT; T+1 2:45pm to 5:15am SGT |
| Daylight saving | Yes, shifts with US clocks | No, Japan does not observe DST | No |
| Typical user | US and European traders, dollar P&L | Japanese institutions, yen P&L, primary price discovery | Asian institutions, hedging flow |
USD, JPY, and Contract Sizes
Contract size is where real money gets made or lost by accident.
The contract multiplier tells you how many currency units one index point is worth, and it varies by a factor of 50 across the product family.
| Contract | Multiplier per point | Value of a 100-point move | Tick size | Typical initial margin |
|---|---|---|---|---|
| CME Nikkei USD (NKD) | $5 | $500 | 5 points = $25 | Roughly $9,000 to $13,000 |
| CME Nikkei Yen (NIY) | ¥500 | ¥50,000 | 5 points = ¥2,500 | Roughly ¥1.2m to ¥1.7m equivalent |
| CME Micro Nikkei (MNK) | $0.50 | $50 | 5 points = $2.50 | Roughly $900 to $1,300 |
| Osaka Nikkei 225 (standard) | ¥1,000 | ¥100,000 | 10 points = ¥10,000 | Set by SPAN, revised weekly |
| Osaka Nikkei 225 mini | ¥100 | ¥10,000 | 5 points = ¥500 | Roughly one tenth of standard |
Margin figures move with the volatility regime.
Exchanges raise initial margin and maintenance margin during turbulent stretches, and the August 2024 Nikkei crash saw requirements jump sharply within days.
Treat any published number as a snapshot, not a constant.
Most retail charting platforms default to either the CME front month or the JPX front month without telling you which.
That single default choice determines whether your chart carries yen currency risk and whether it goes quiet at 3:40pm JST or keeps ticking.
Check the symbol description before you draw a single support and resistance line.
How to Read a Live Futures Quote
A futures quote has maybe eight fields.
Traders routinely misinterpret four of them.
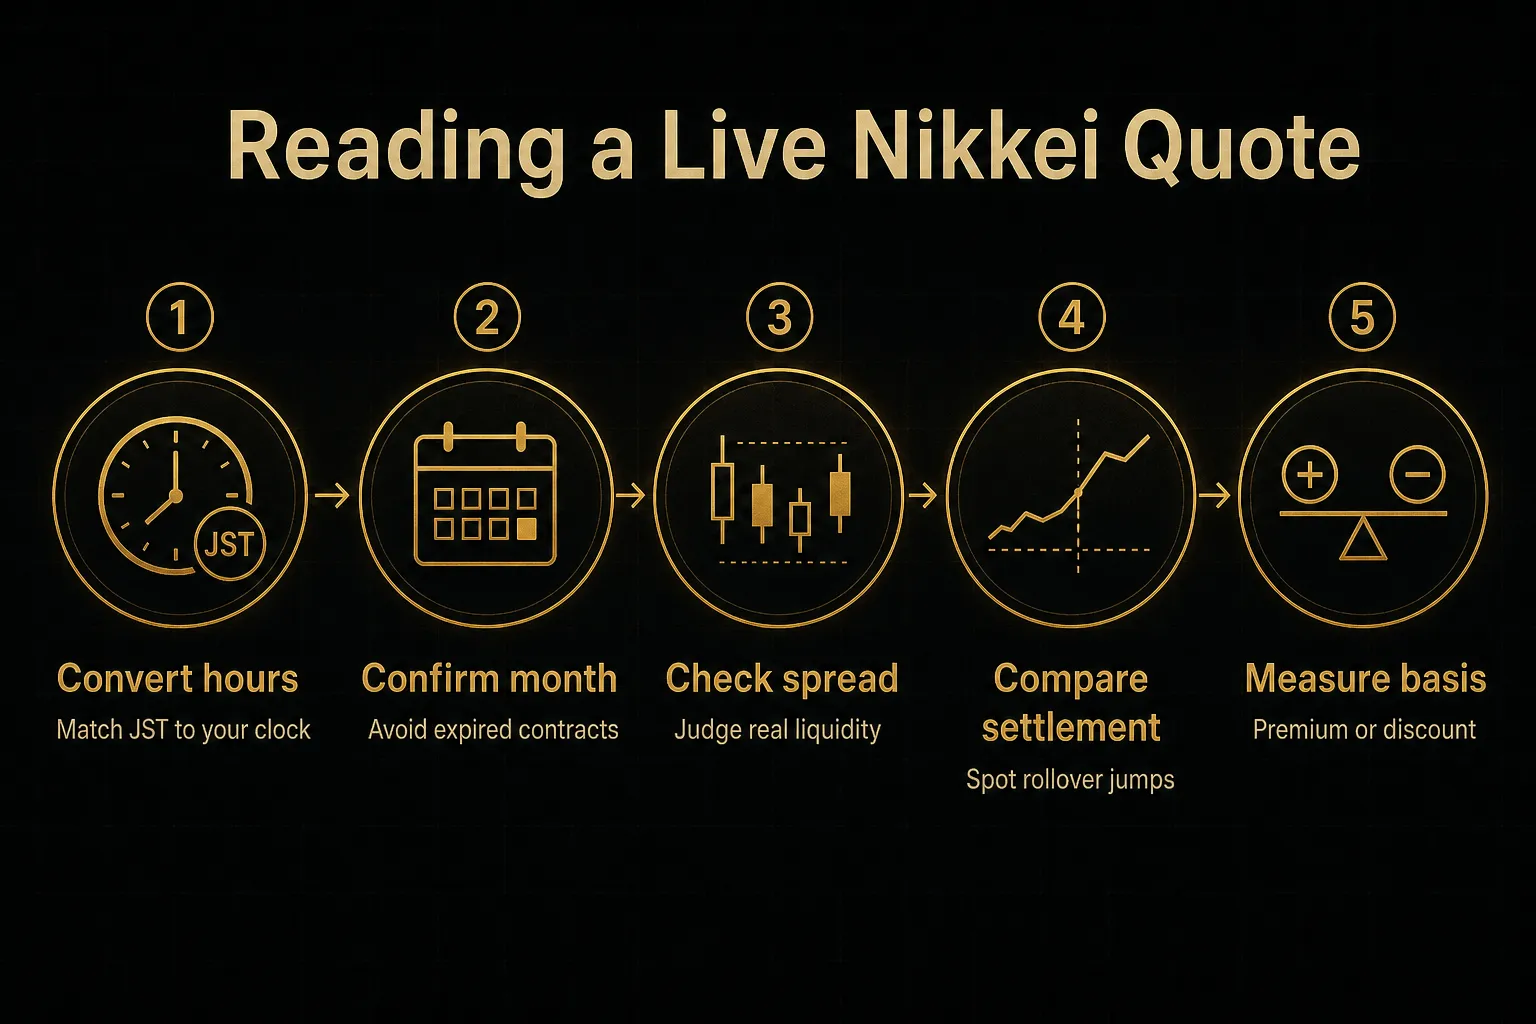
Work through this sequence every time you open a Nikkei chart and the misreads mostly disappear.
Trading Hours Across Timezones
Decoding Quote Fields
- Convert the session hours to your own clock first. Japan sits at UTC+9 year-round with no daylight saving, while CME runs on US Central and shifts twice a year, so the gap between Tokyo and Chicago swings between 14 and 15 hours depending on the month. A London trader watching the JPX night session in January is looking at a different local window than in July.
- Confirm the exact contract month on the chart. Nikkei futures expire quarterly in March, June, September, and December, and a chart labelled simply “Nikkei futures” may be showing an expired month, the front month, or a stitched continuous futures chart. Unadjusted continuous charts paste contracts together at rollover, creating price jumps that never happened in any single contract.
- Read the bid-ask spread and volume together to judge liquidity. During the Tokyo lunch break and the dead zone between the Asian close and the US morning, spreads on the Nikkei can widen from one tick to five or more, and a market order fills at a price you would never accept intentionally. If the spread looks unusually wide, check the clock before you check your thesis.
- Check open interest and settlement price against the prior close. A sudden overnight “gap” in the front month is often just rollover, with volume and open interest migrating from the expiring contract to the next one at a slightly different price. Compare the official settlement price rather than the last trade, because thin late-session prints distort the last-trade number.
- Calculate the basis before drawing any conclusion. The futures basis is simply the futures price minus the cash index level, and it tells you whether the market is currently pricing a premium or a discount into the next Tokyo open. A 250-point premium at 4am JST is a meaningfully different setup from a 250-point discount, even if the futures price itself hasn’t moved all night.
One extra habit worth building: note the timestamp on the quote itself.
Free data feeds frequently run 10 to 20 minutes delayed, and a delayed Nikkei print during a Bank of Japan press conference is worse than no print at all.
Why Futures and Cash Prices Diverge
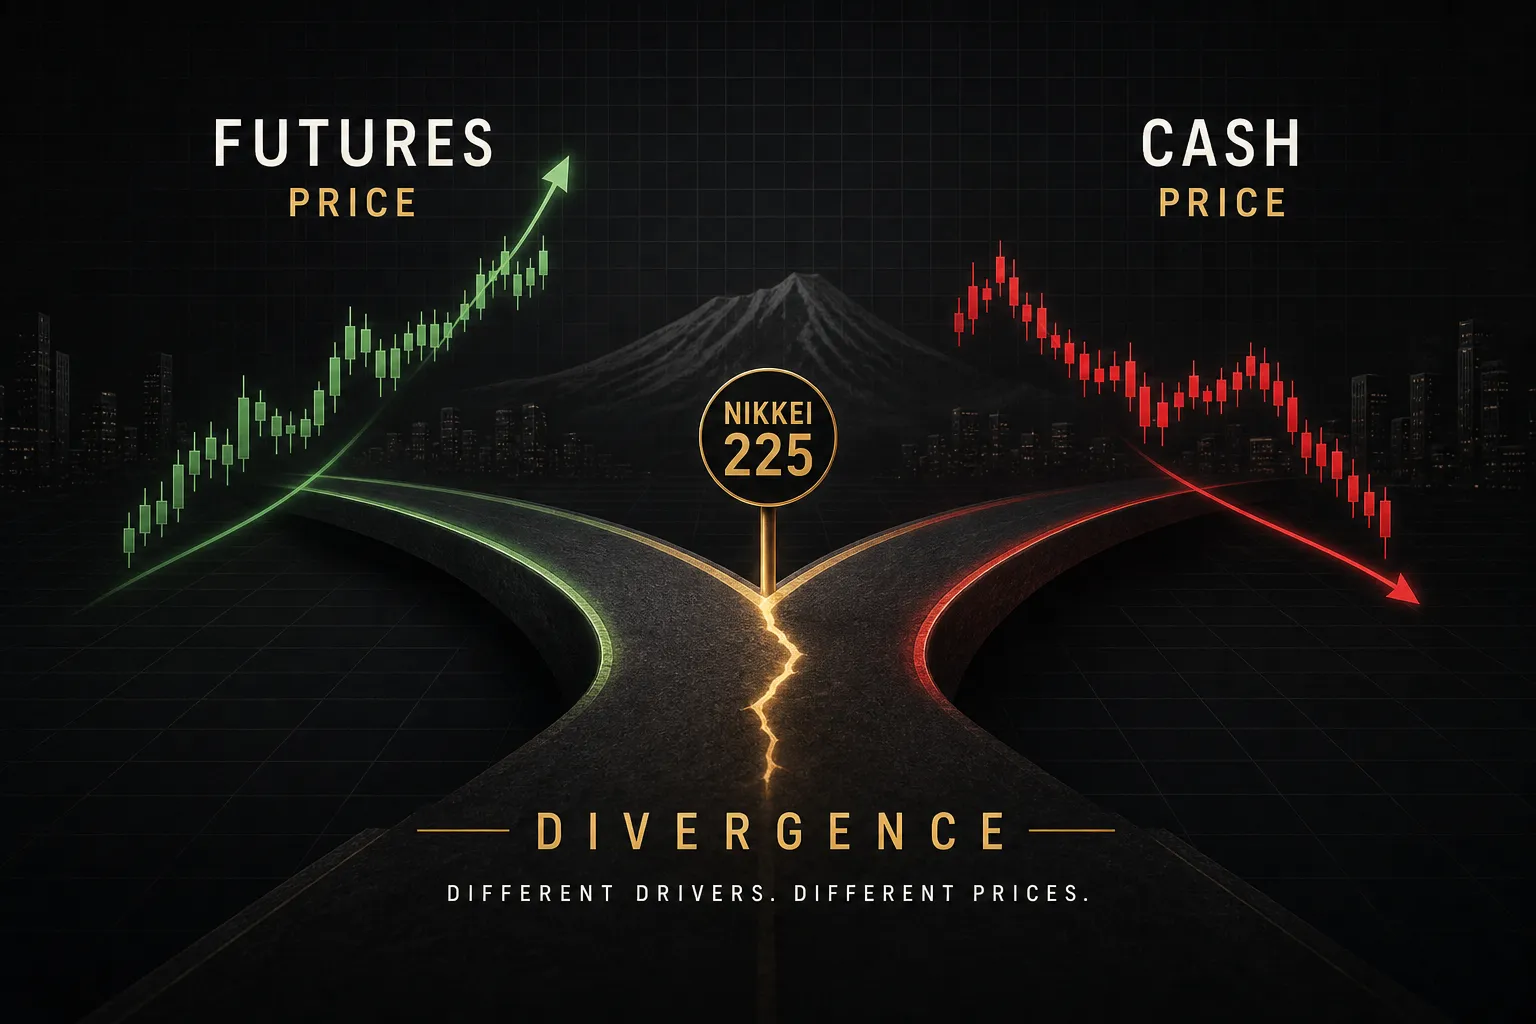
Futures rarely trade exactly at the cash index level, and that’s not a pricing error.
It’s arithmetic.
Fair Value and Financing Costs
The fair value of an equity index future is roughly the cash index, plus the cost of financing that basket until expiry, minus the dividends you forgo by holding the future instead of the shares. Traders call the whole package the cost of carry.
With Japanese short rates having climbed off the floor since the Bank of Japan exited negative rates, the financing side of that equation actually matters again.
For most of the 2010s it rounded to nothing.
Not anymore.
Dividend timing skews things too.
Japanese companies concentrate payouts around the March and September fiscal boundaries, so the futures basis on a June contract behaves differently in February than it does in May.
When the futures price sits below cash by more than fair value implies, that discount usually reflects hedging pressure or expected dividend flow rather than a bearish forecast.
Arbitrage desks keep the relationship honest.
When the basis strays far from fair value, they buy the cheap leg and sell the expensive one, which is exactly why persistent, large gaps are rare during liquid hours and more common at 3am.
The USD/JPY Connection
Here’s where the CME dollar contract adds a second layer.
The Nikkei Stock Average is a yen-denominated, price-weighted index, but NKD settles in dollars, so the dollar contract embeds a currency conversion the Osaka contract does not.
Two charts, same underlying, different exposures.
The popular shorthand says a weaker yen lifts the Nikkei.
It’s directionally right often enough to be dangerous.
The logic holds for exporters.
Toyota, Sony, and the semiconductor equipment names earn abroad, so a softer yen inflates translated earnings and those heavyweight constituents pull the price-weighted index higher.
But domestic retailers, utilities, and importers face the opposite pressure, and a yen collapse driven by panic over Bank of Japan policy can crush the index while the currency weakens.
The August 2024 episode made the point brutally.
A yen surge coincided with a 12% single-day Nikkei collapse, breaking the “weak yen good, strong yen bad” rule in the most expensive way possible.
So does the overnight futures price predict the Tokyo open?
Partially.
Statistically the correlation is high, and the futures level at 8:40am JST is the best single estimate available.
But basis risk is real, arbitrage flows shift the relationship, and a headline landing at 8:50am can produce an opening gap that ignores everything the overnight session priced.
Turning a Live Chart Into a Trading Plan
Context without a process is just entertainment.
The gap between reading a Nikkei futures chart and trading one comes down to a repeatable routine you run before every session, in the same order, every time.
A Pre-Market Checklist
Run this in roughly five minutes before the Tokyo cash open or before you take any overnight position.
- Confirm contract and data source. Check the exchange (CME Globex, JPX, or SGX), the currency, the specific futures contract month, and whether your feed is real-time or delayed. Write it down once and stop re-checking mid-trade.
- Check overnight US index futures. S&P 500 and Nasdaq futures direction leads Asian sentiment more often than not, and a sharp US tech selloff overnight tends to show up in the Nikkei’s semiconductor-heavy weighting within minutes of the open.
- Check USD/JPY movement since the prior Tokyo close. Note the magnitude and, more importantly, the reason. A 100-pip move driven by US yields reads differently than one driven by intervention chatter.
- Scan the Japanese economic calendar. Bank of Japan meeting days, the quarterly Tankan survey, CPI prints, and Ministry of Finance intervention windows all deserve a wider stop or a smaller size. Japanese data typically releases at 8:30am or 8:50am JST, right before the cash open.
- Measure the current gap versus the prior JPX close. Quantify it in points and as a percentage. A 400-point gap on a 39,000 index is about 1%, which is meaningful but not extreme; a 1,200-point gap is a different regime entirely.
- Note the volatility regime. Check the Nikkei VI or simply the average true range over the last ten sessions, then size and set stop-loss placement against that, not against a fixed point count you memorised last year.
Confirming Direction With Multi-Timeframe Data
A single signal on a single timeframe is noise wearing a costume.
The five-minute chart says buy, the daily says the trend rolled over three weeks ago, and you find out which one mattered after the fact.
Multi-timeframe confirmation tables solve the problem by displaying trend state across many horizons at once.
PipTrend’s 12-timeframe BUY/SELL/NEUTRAL dashboard on TradingView, for instance, sits on the Nikkei futures chart and shows whether the one-minute through monthly views agree.
When ten of twelve read the same colour, you have alignment.
When they’re split six-six, you have a range, and range-trading a gap is how accounts get chewed up.
The discipline that matters is separating direction from entry.
Direction comes from the colour-coded trend read across timeframes.
Entry comes from structure on the chart itself: the overnight session high and low, VWAP from the session open, and clearly defined supply and demand zones.
Direction tells you which side to be on. Entry tells you where. Confusing the two is how traders end up chasing a gap at the exact moment the arbitrage desks are fading it.
Calculating Profit and Loss
Nikkei futures move in hundreds of points routinely, which makes the arithmetic feel abstract until you attach dollars to it. A 100-point move is a fairly ordinary intraday swing.
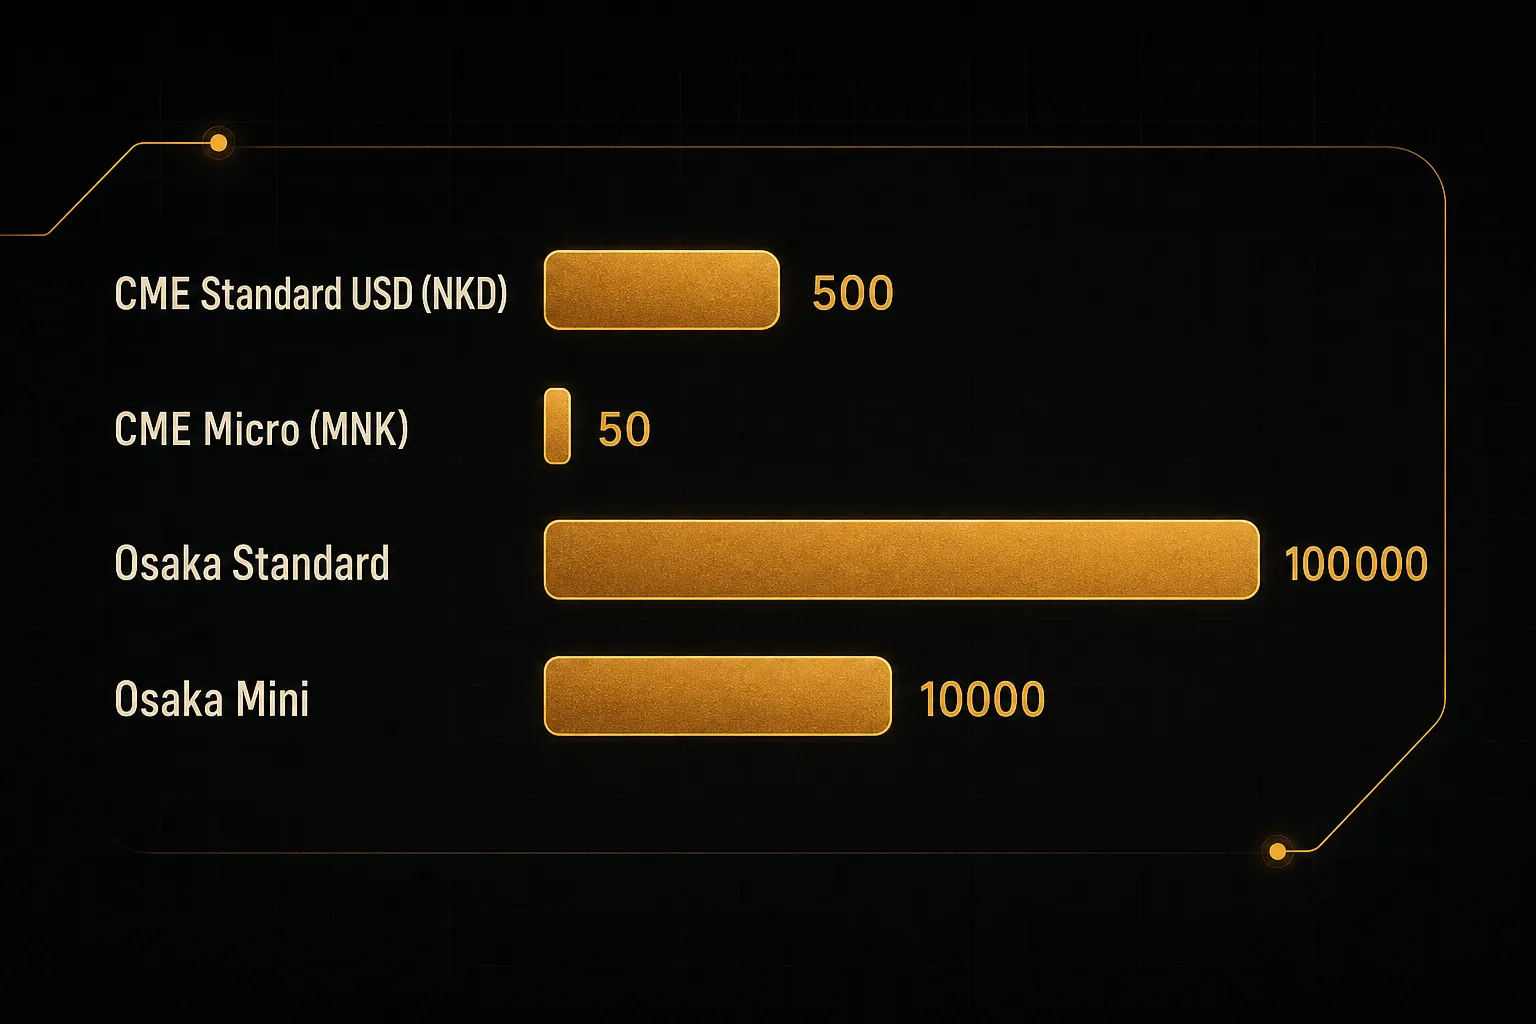
On the CME standard USD contract at $5 per point, that 100-point move is $500 per contract.
On the Micro at $0.50 per point, it’s $50.
On the Osaka standard at ¥1,000 per point, it’s ¥100,000, which is roughly $650 at a 155 exchange rate.
With initial margin on a standard CME contract in the $9,000 to $13,000 range and a notional value near $195,000 at a 39,000 index level, you’re controlling roughly 15 to 20 times your posted margin.
A 2% index move against you, entirely normal on a Bank of Japan surprise, wipes out a third of your margin on one contract.
That’s the case for starting on Micros.
Same chart, same analysis, one-tenth the damage while you learn whether your read on the overnight session actually holds up.
Common Questions About Nikkei Futures
What are Nikkei 225 futures trading at today?
You need a real-time feed from a specific exchange to answer that, and the number differs depending on which contract you check. The CME USD contract (NKD), the CME yen contract (NIY), and the Osaka NK225 front month will all show slightly different prices at the same instant because of currency denomination and venue-specific liquidity.
Free websites often publish delayed quotes, typically 10 to 20 minutes behind. For anything more than casual reference, use a broker feed or an exchange-licensed data subscription.
How can I trade Nikkei 225 futures?
You need a futures-enabled brokerage account with access to CME Globex, the Osaka Exchange, or SGX, plus enough capital to meet initial margin. Most non-Japanese retail traders reach the market through the CME contracts, since Osaka access typically requires a Japanese broker or an institutional relationship.
Micro contracts are the practical entry point.
They carry the same tick structure and session hours at one-tenth the dollar exposure of the standard USD contract.
What is the ticker for Nikkei futures?
It depends entirely on the exchange.
On CME Globex, NKD is the USD-denominated contract, NIY is the yen-denominated version, and MNK is the Micro.
On the Osaka Exchange, the codes are NK225 for the standard contract, NK225M for the mini, and NK225MC for the micro.
Charting platforms then add their own prefixes and month codes, so a symbol like NKD1! usually means the continuous front-month CME dollar contract rather than a specific expiry.
What time do Nikkei futures open?
The Osaka day session opens at 8:45am JST and the night session runs from 5:00pm JST until 6:00am the following morning. CME Globex trades from Sunday 5:00pm US Central through Friday afternoon, with a daily maintenance break.
Japan does not observe daylight saving.
That means the offset between JST and US or European clocks changes twice a year even though Tokyo’s schedule never does, which trips up more traders than any other single detail.
Do Nikkei futures predict the Nikkei 225?
They indicate the likely open rather than predict it.
The overnight futures level is the best available estimate of where the cash index will start, but the relationship breaks when news lands between the last futures print and the 9:00am JST cash open.
Basis and fair value also mean futures should not equal cash. A premium or discount can exist purely because of financing costs and dividend timing, with no directional information in it at all.
What moves the Nikkei 225 futures price?
Four forces dominate: overnight US equity direction, the USD/JPY exchange rate, Bank of Japan policy expectations, and index-specific flows around rollover and options expiry. The index is price-weighted, so a handful of high-priced constituents like Fast Retailing and the semiconductor names swing the number far more than their market caps would suggest.
Global risk events matter too.
Chinese data, US Treasury yields, and semiconductor earnings all transmit into the Nikkei within hours.
The Bottom Line on Live Futures Data
Here’s the one thing to do tonight.
Before you react to any Nikkei futures quote, verify three things: which exchange it comes from, which contract month it represents, and what time it is in Tokyo right now.
Thirty seconds of checking.
It eliminates the majority of Nikkei futures mistakes.
Then add a single confirmation signal before you assume direction.
Check USD/JPY, or check the multi-timeframe trend alignment, or check the basis versus the prior JPX close.
One extra input is the difference between reading a chart and guessing at one.
The deeper shift is how you think about the number itself.
A live futures price is not a trade call, and it never was.
It’s a piece of context that tells you what the market priced while you were asleep, subject to financing costs, currency effects, and the possibility that a Bank of Japan headline rewrites everything at 8:50am JST.
Traders who last treat it that way.
One input among several, weighted by how much they trust the source and how quiet the session was when it printed.
The chart shows you what happened.
What you do about it is a separate decision, and it deserves a separate process.
Sources
Risk Disclaimer: Trading involves risk. Past performance doesn't guarantee future results. Only trade with money you can afford to lose. PipTrend is a tool to assist your trading decisions, not financial advice.