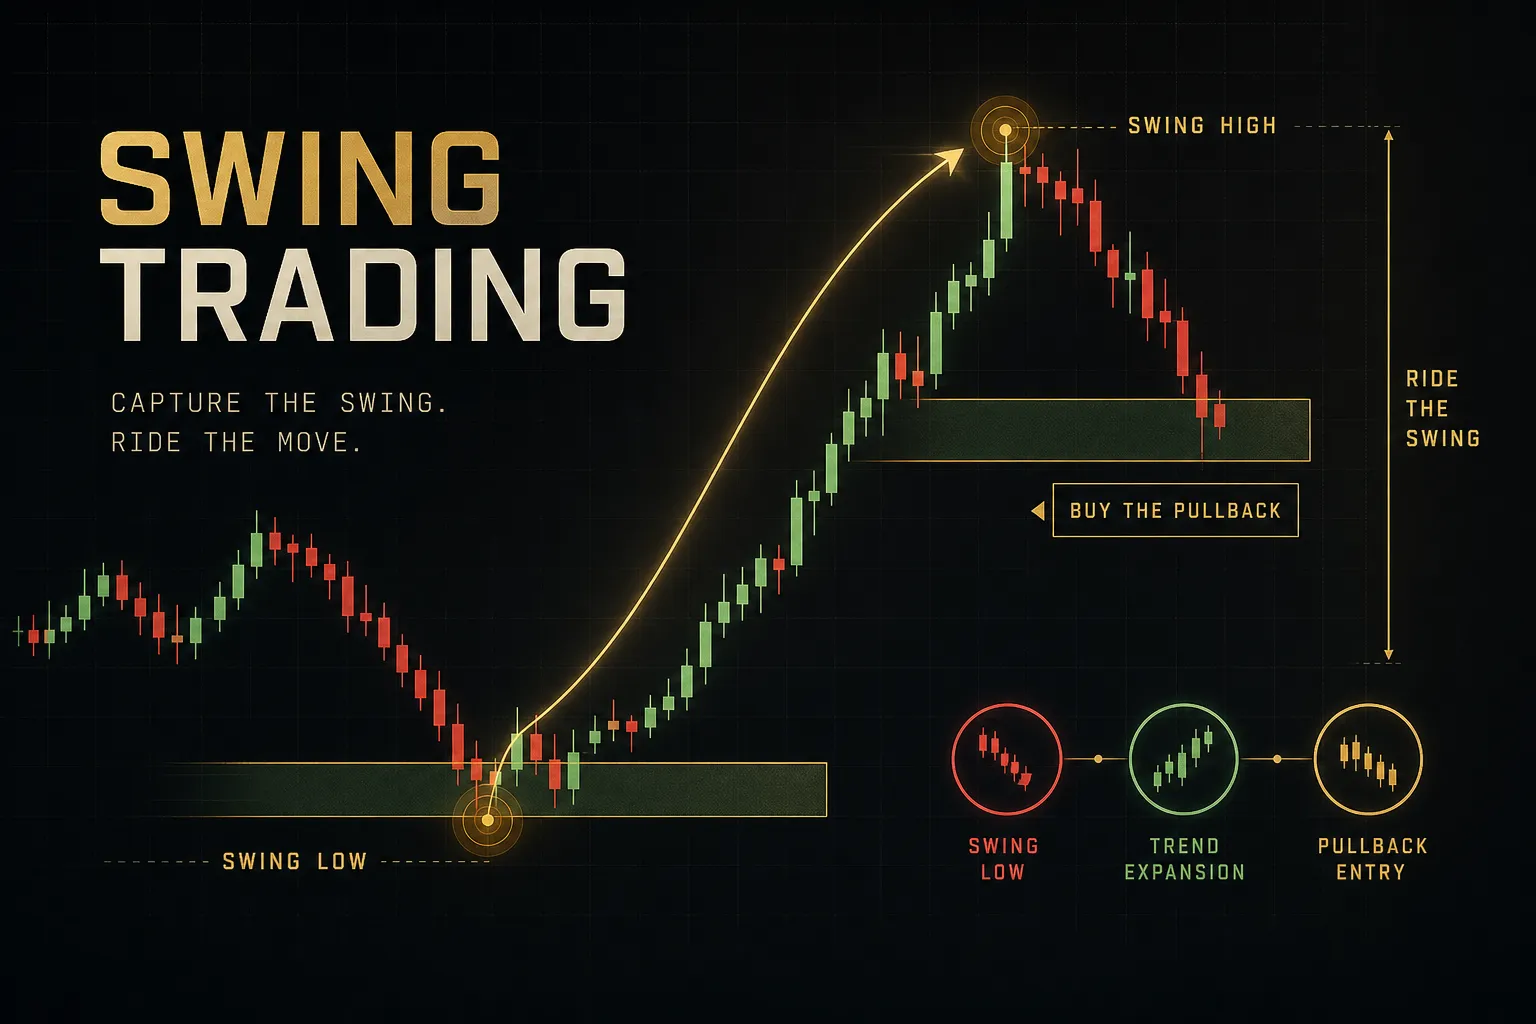
Stochastic Momentum Index: A Trader's Complete Guide
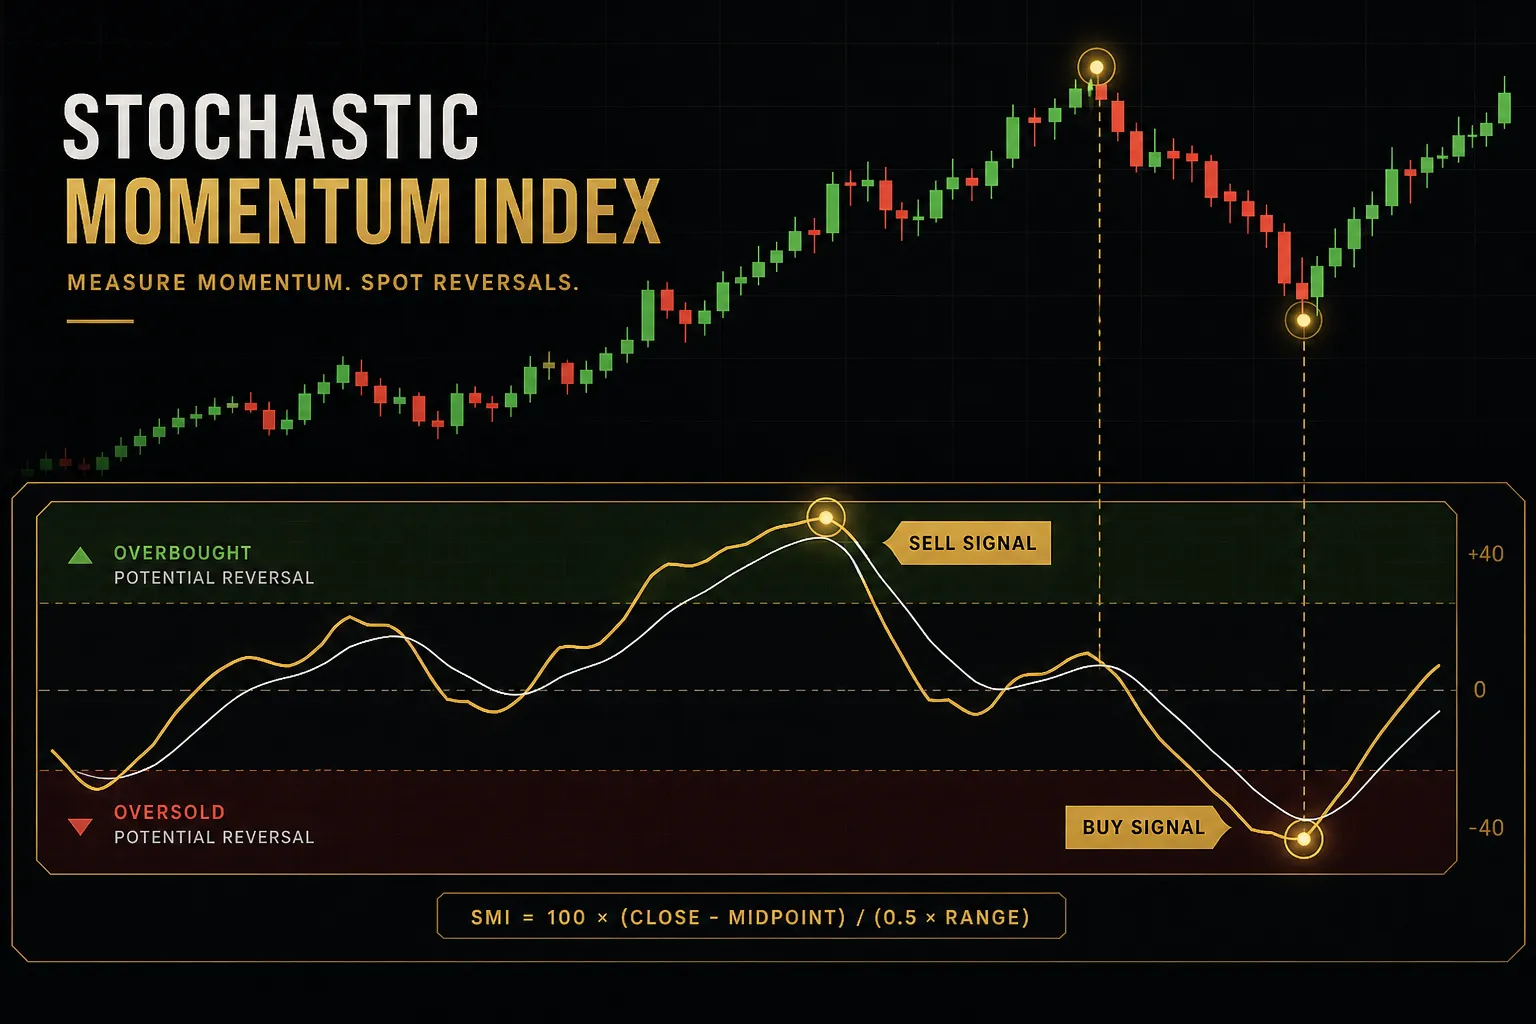
On this page
Why the SMI Deserves a Closer Look
Most traders learn the Stochastic Oscillator, get burned by its constant whipsaws, and move on. The Stochastic Momentum Index was built to fix exactly that problem, and it rarely gets the attention it deserves.
William Blau introduced the SMI in the early 1990s with one structural change that matters enormously. Instead of measuring where price closed relative to the low of the lookback range, the SMI measures where the close sits relative to the high-low range midpoint.
That single adjustment turns a jumpy oscillator into something closer to a genuine momentum reading.
And yet almost every guide online reduces the indicator to a single sentence: buy below -40, sell above +40.
That advice will lose you money in a trending market.
It ignores volatility regime, it ignores timeframe, and it ignores the fact that the SMI can sit pinned above +40 for weeks while price keeps climbing.
This guide takes a different approach. You will get the actual calculation broken into steps, the difference between a signal-line cross and a zero-line cross, parameter combinations matched to scalping, day trading, and swing trading, and platform-specific setup notes for TradingView and thinkorswim.
Then a rules-based workflow: regime first, higher-timeframe bias second, SMI as the timing layer.
Never the trigger on its own.
What the SMI Actually Measures
Picture the last 14 candles on your chart. Draw a horizontal line at the highest high, another at the lowest low, and a third exactly halfway between them. The SMI answers one question: how far is the current close from that middle line, and in which direction?
The Stochastic Momentum Index is a momentum oscillator scaled from -100 to +100. A reading of zero means price closed precisely at the midpoint of its recent range.
Positive values mean the close sits in the upper half of the range. Negative values mean the lower half.
This is meaningfully different from the classic Stochastic, which is bounded 0 to 100 and measures distance from the low. Blau’s version gives you a natural zero line, and a zero line gives you directional bias for free.
The second innovation is smoothing. The raw distance-from-midpoint value is noisy, so the SMI applies double exponential smoothing to both the numerator and the denominator before dividing. Two passes of an EMA, not one.
Why does that matter in practice? Because a single-smoothed oscillator reacts to every minor tick, generating crossovers that reverse two candles later.
Double smoothing filters most of that out.
Backtests across liquid FX pairs and index futures typically show the SMI producing 30 to 50 percent fewer crossover signals than a standard 14-3-3 Stochastic over the same period, with a meaningfully higher proportion of those signals following through.
Fewer signals, better signals. That is the whole trade-off.
The SMI is not a faster Stochastic. It is a quieter one. If you want more signals, this is the wrong indicator.
One honest caveat: the SMI is sometimes marketed as a leading indicator. It leans that way, because divergences and midpoint shifts can appear before a visible price reversal.
But it is still calculated from smoothed historical closes, which makes it fundamentally lagging.
Double smoothing buys you cleanliness at the cost of a delay, usually two to four candles behind the actual turn.
Treat it as a confirmation and timing tool.
Not a crystal ball.
The Formula Step by Step
The math looks intimidating written out as one equation. Broken into stages it is straightforward arithmetic.
- Find the range. Over your lookback period (commonly 10 or 14 candles), identify the highest high and the lowest low.
- Locate the midpoint. Add the highest high and lowest low, then divide by two. This is your reference level.
- Measure the distance. Subtract the midpoint from the current close. Positive means price closed in the upper half; negative means the lower half. Blau calls this value D.
- Calculate the range width. Highest high minus lowest low. Call this HL.
- Double-smooth both. Apply an EMA to D, then an EMA to that result. Do the same to HL. The smoothing period is typically 3 to 5.
- Scale it. Divide the smoothed D by half the smoothed HL, then multiply by 100. That gives you a value bounded between -100 and +100.
- Add the signal line. Apply a short EMA (usually 3 periods) to the SMI itself. This is your signal line.
The division by half the range in step six is what forces the -100 to +100 scale. Close at the exact high and you get +100. Close at the exact low, -100.
SMI vs SMI Ergodic
You will see two versions in most platform indicator libraries, and the naming causes constant confusion.
SMI Ergodic is Blau’s related construction, published as the True Strength Index derivative. It smooths price change rather than distance from a range midpoint.
The plot looks similar and it oscillates around zero, but the inputs are different.
Practical difference: SMI Ergodic responds faster to sharp momentum shifts, which makes it slightly better for trend-following and slightly worse for spotting range extremes. The standard SMI, anchored to the high-low range, is better at telling you when price has stretched too far within its recent envelope.
If your strategy revolves around pullbacks inside a trend, the standard SMI is usually the better fit. If you are hunting momentum thrusts, test Ergodic.
How to Read SMI Signals Correctly
Here is the uncomfortable truth about the +40/-40 levels everyone quotes: Blau never presented them as mechanical triggers.
They are reference zones.
And on some instruments they are simply wrong.
Run the SMI on Bitcoin’s daily chart and then on EUR/CHF. The Bitcoin oscillator will spend long stretches beyond ±60.
EUR/CHF, historically a low-volatility pair, may rarely exceed ±35 outside of intervention events.
Applying the same thresholds to both is a category error.
Recalibrate.
Pull up six months of history on your instrument and timeframe, then note where the SMI actually turns. If reversals cluster around ±55, use ±55.
This takes ten minutes and it eliminates a whole class of bad trades.
Overbought and Oversold Zones Reconsidered
The single most expensive mistake with any momentum oscillator is treating an extreme reading as a reversal instruction.
In a strong uptrend, price closes near the top of its recent range candle after candle. That is what a trend is.
So the SMI climbs above +40 and stays there.
Not for two candles.
Sometimes for thirty.
Every short taken on that basis is a short against the dominant force in the market. Traders who did this during the 2023-2024 equity index run gave back months of gains fighting a reading that never meant what they thought it meant.
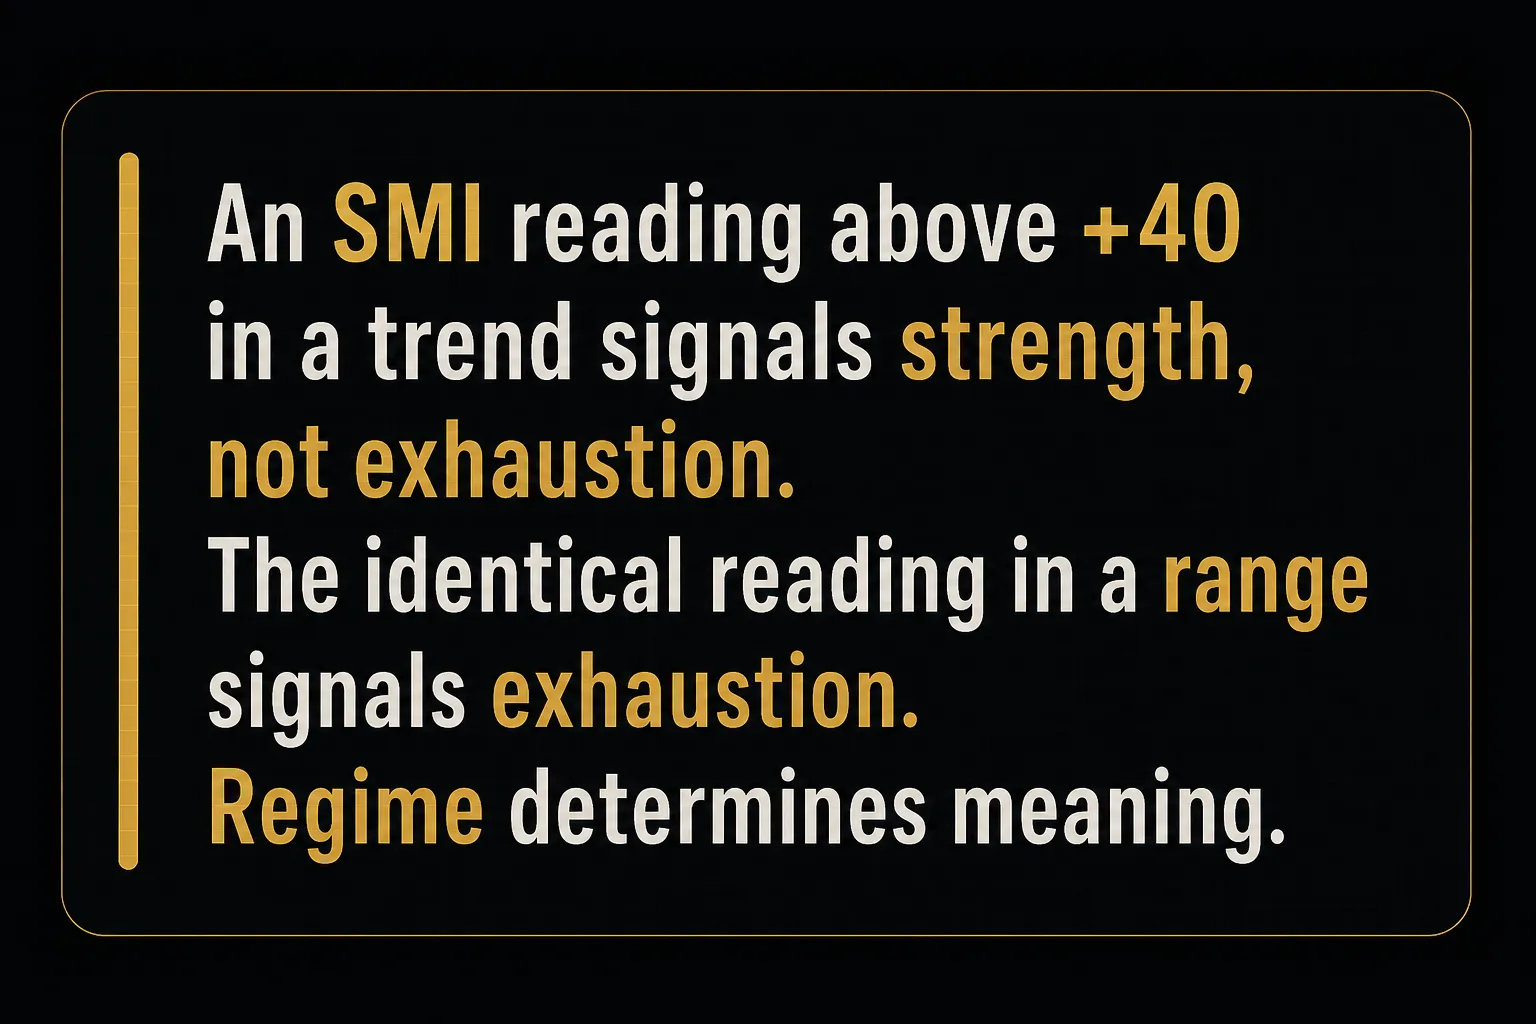
Overbought and oversold zones carry real information in one specific context: range-bound markets. When price is oscillating between defined support and resistance, an SMI extreme at the edge of that range is a genuinely useful signal. In a trend, the same reading is a strength confirmation.
Same number.
Opposite meaning.
That is why regime comes first.
Signal-Line Cross vs Zero-Line Cross
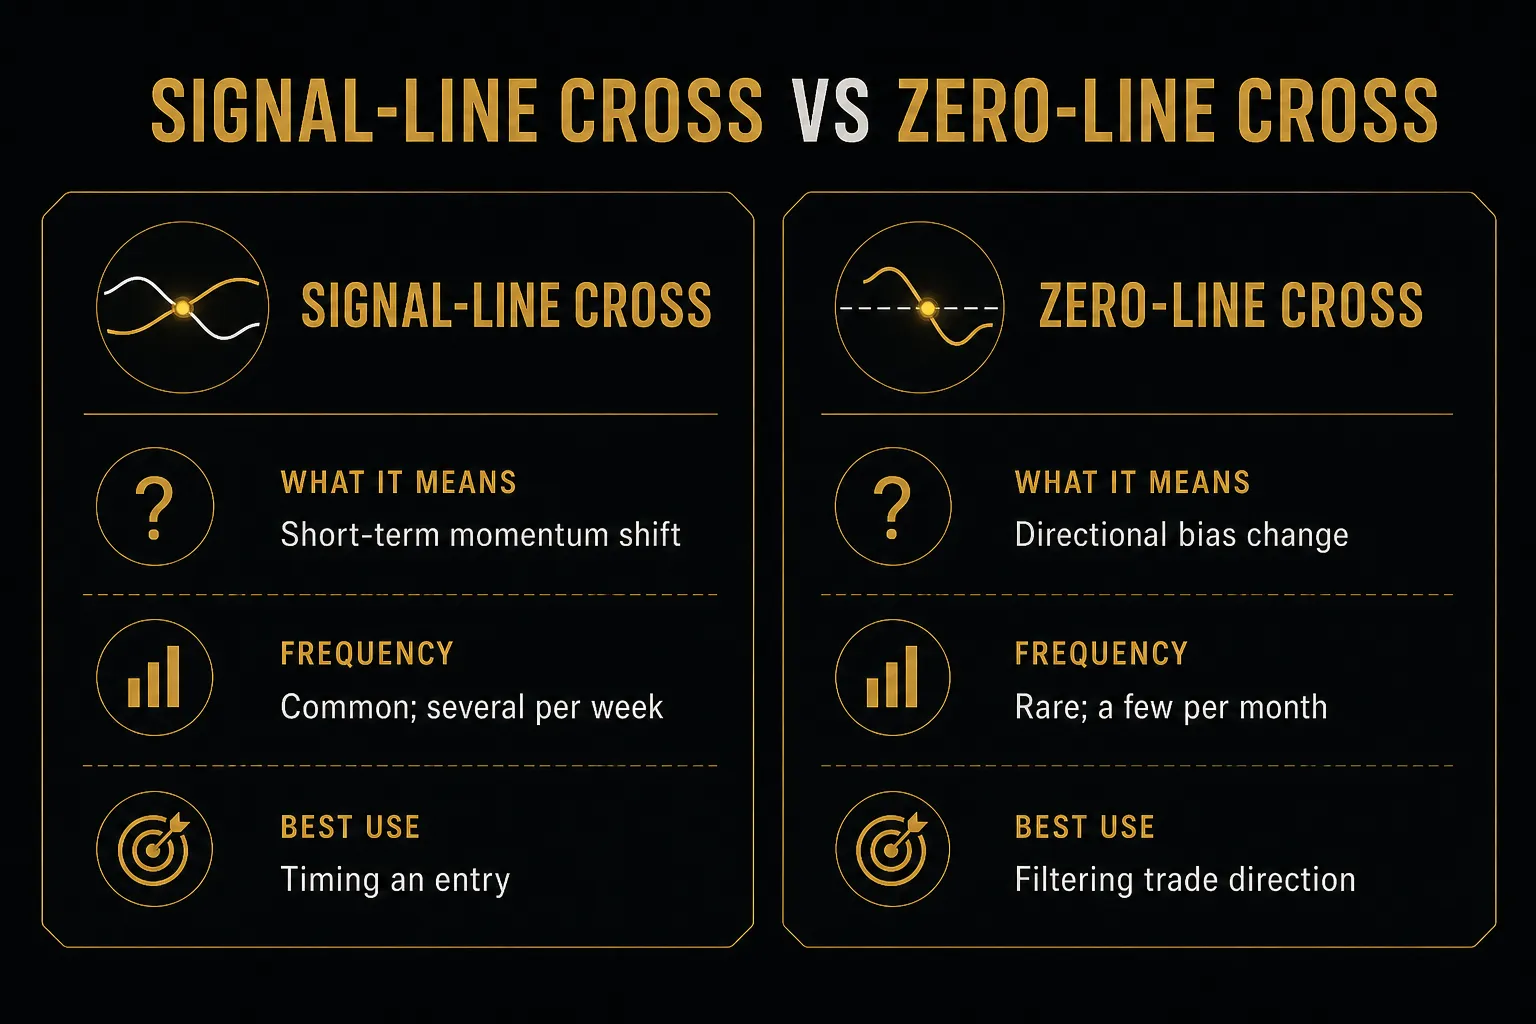
These two events are not interchangeable, and conflating them is why many traders find the SMI unreliable.
A signal-line crossover is a short-term momentum event. The SMI crossing below its signal line means the rate of upward pressure just eased.
That is all.
Location determines whether it matters.
A bearish signal-line cross occurring above +50 is a potential momentum exhaustion signal, worth attention if the higher timeframe agrees. The same cross occurring at -10 in the middle of the range is noise.
Ignore it.
A zero-line cross is structurally different. It means the close has moved from the lower half of the recent high-low range to the upper half, or vice versa. That is a bias shift, not a momentum wobble.
Zero-line crosses are slower and less frequent. They are also considerably more reliable as directional filters. Many systematic traders use the zero line as a permission gate: only take long setups when the SMI sits above zero on the trading timeframe.
Trading Divergence Without Guessing
Divergence is where the SMI earns its keep, and where most traders draw lines that were never there.
Regular divergence is the classic setup. Price makes a higher high while the SMI makes a lower high (bearish), or price makes a lower low while the SMI makes a higher low (bullish). The interpretation: the move is happening on weaker momentum than the previous one.
Hidden divergence runs the other way and is often more useful. Price makes a higher low while the SMI makes a lower low.
Structure holds, momentum flushed out.
In an established uptrend, that combination frequently marks the end of a pullback.
Two discipline rules make divergence tradeable instead of imaginative.
First, only connect confirmed swing points. A swing high needs candles on both sides of it. If the rightmost candle is still forming, that high does not exist yet and your divergence line may vanish.
Second, insist on candle-close confirmation. Intrabar SMI values move constantly, and a divergence visible mid-candle can disappear entirely by the close.
Wait for the close.
Every time.
Divergence also tells you nothing about timing. A bearish divergence can persist for fifteen candles while price grinds higher.
Use it to build a case, then let price action confirmation (a broken swing low, a rejected retest) trigger the entry.
Settings, Timeframes, and Platforms
Three parameters control the SMI, and each one trades responsiveness against reliability.
The lookback length defines the high-low range. Shorter lookbacks mean the range recalculates faster, so the oscillator reaches extremes more often. Longer lookbacks smooth the reference range and produce broader swings.
The double-smoothing period is the biggest lever. Drop it from 5 to 3 and signal count roughly doubles.
Raise it to 8 and you may get two clean signals a month on a daily chart.
The signal-line smoothing only affects crossover timing. A 3-period signal line crosses earlier and more often than a 5-period one.
Matching Settings to Your Trading Style
| Trading Style | Lookback / Smoothing / Signal | Typical Timeframe | Extreme Zones | Behaviour |
|---|---|---|---|---|
| Scalping | 5 / 3 / 3 | 1M to 5M | ±50 | Very responsive; 8-15 signals per session, high false-positive rate. Needs a strict trend filter. |
| Day trading | 10 / 3 / 3 | 5M to 15M | ±40 | Blau’s original defaults. Balanced; roughly 3-6 usable signals per session on liquid instruments. |
| Swing trading | 14 / 5 / 3 | 1H to 4H | ±40 | Noticeably quieter. Two to four quality setups per week; survives overnight noise well. |
| Position trading | 21 / 5 / 5 | Daily to Weekly | ±35 | Very smooth, 2-4 candle lag on turns. Best used with zero-line crosses rather than extremes. |
| High-volatility assets | 14 / 8 / 3 | 1H to Daily | ±60 | Heavy smoothing suppresses crypto-style spikes. Fewer signals, far fewer fakeouts. |
Start with 10/3/3 regardless of style. Change one parameter at a time and test across at least 100 signals before deciding.
Changing all three at once tells you nothing about which change helped.
Adding SMI on TradingView and thinkorswim
A warning before the setup steps: identical parameter names do not guarantee identical calculations. Some implementations use SMA where Blau specified EMA. Others apply the second smoothing pass only to the numerator.
Verify by comparison.
Load the same instrument and settings on two platforms, note the SMI value at a specific historical close, and check whether they match.
If they differ by more than a point or two, the formulas differ and your backtest results will not transfer.
- TradingView. Open the Indicators panel and search “Stochastic Momentum Index”. Community scripts dominate the results, so check the source code or description for the smoothing method. Once added, open the gear icon; the double-smoothing input often appears as “Smooth K” or “EMA Length” rather than anything containing the word “double”.
- thinkorswim. Use Studies, then Add Study, then All Studies, then S, then StochasticMomentumIndex. The overbought and oversold levels are editable in the study’s Properties panel, not on the chart itself. Smoothing appears under “Inputs” as separate percentK and percentD length fields.
- MT4 and MT5. The SMI is not native. You will need a custom indicator dropped into the Indicators folder, and quality varies wildly. Check whether the author used iMAOnArray with MODE_EMA before trusting the output.
- Confirm no repainting. Watch a live candle and note how much the SMI value drifts before the close. On a 5-minute chart in an active session, intrabar drift of 10 to 20 points is normal. That is enough to create and erase a crossover.
Which brings us to the rule that saves more accounts than any parameter tweak: no action on an unclosed candle.
An intrabar crossover is a hypothesis, not a signal.
Building a Complete SMI Workflow
An SMI signal in isolation is a fragment of information. Placed inside a defined process, it becomes a decision tool.
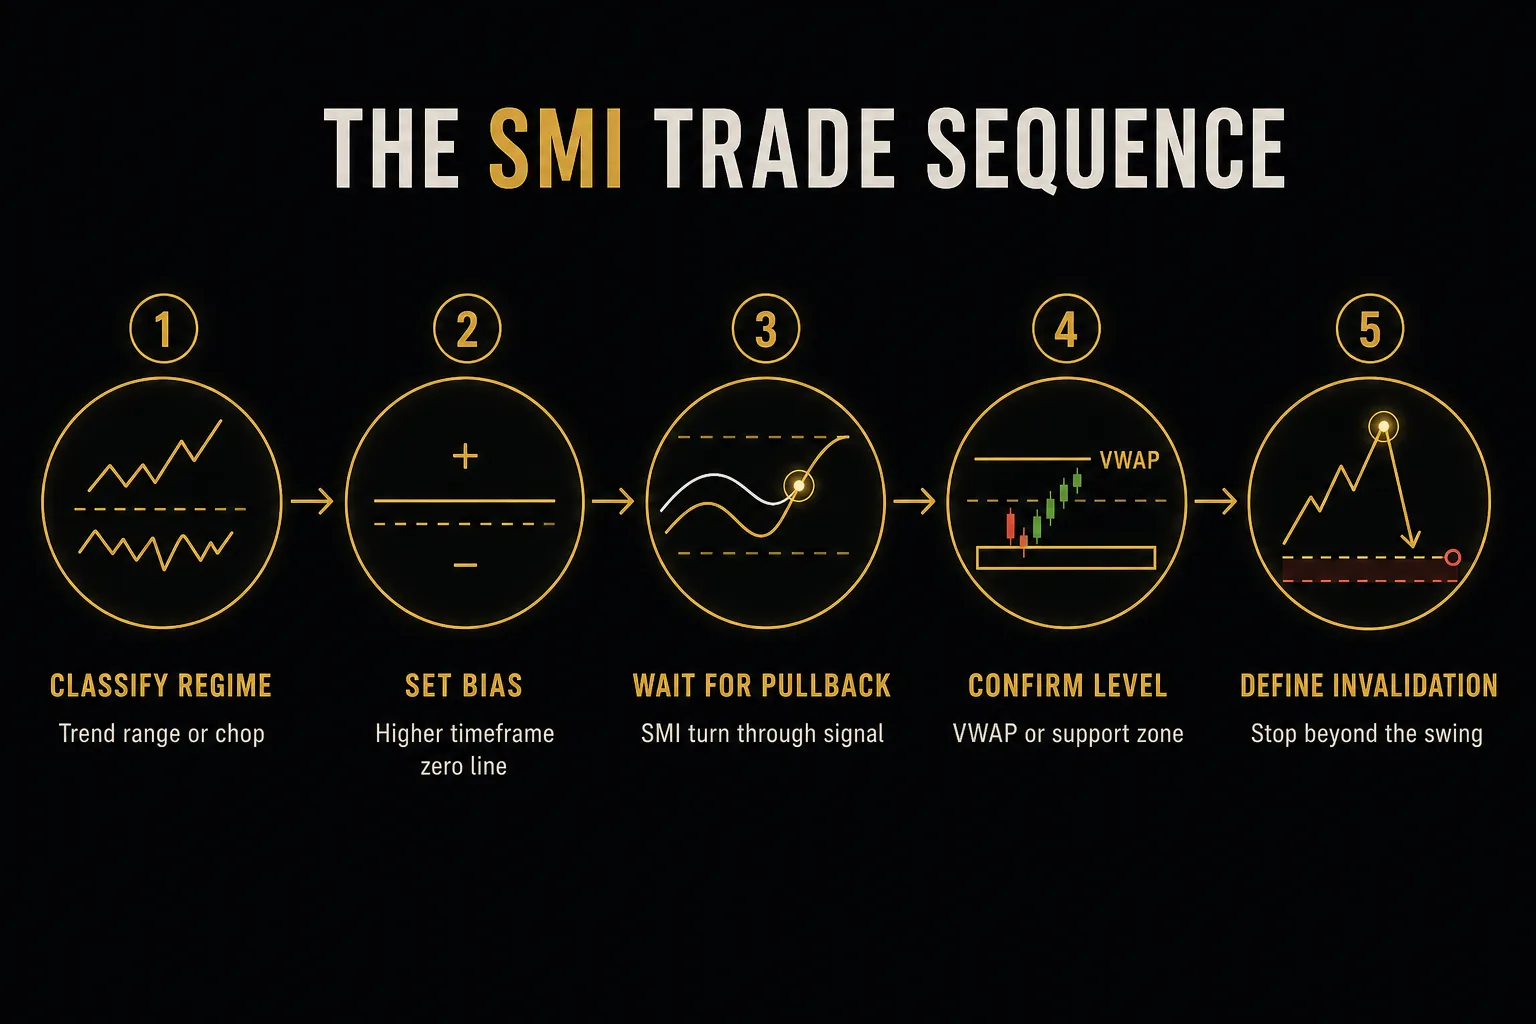
Here is that process.
- Classify the market regime before looking at the indicator. Is price trending, ranging, expanding in volatility, or thin and illiquid? Write the answer down. The same SMI reading means different things in each, and deciding after you see the signal invites bias.
- Set directional bias on a higher timeframe. If you trade the 15-minute, establish bias on the 1-hour or 4-hour. Use the SMI’s zero line plus basic structure: higher highs and higher lows above zero equals long-only bias. This step alone eliminates most counter-trend losses.
- Wait for a pullback signal on the trading timeframe. In a confirmed uptrend, that means the SMI dipping toward or below the lower zone and then turning up through its signal line. You are buying weakness inside strength, not chasing an extreme.
- Time the entry at a real price level. An SMI turn floating in the middle of nowhere is a weak entry. Require confluence with a level that other participants see: VWAP, a prior support and resistance zone, a session high, a retested breakout point.
- Confirm with an independent tool. This is where a dedicated trend layer helps. PipTrend’s multi-timeframe table shows trend direction across several timeframes at once, and its color-coded trend candles mark the entry level on the chart itself, so you can check whether the SMI signal actually aligns with independent trend and level data rather than confirming your own read of the same price series twice.
- Define invalidation before entry. Place the stop beyond the swing that formed the pullback, plus a buffer for typical noise (roughly 0.5 ATR on the trading timeframe). If the required stop makes the trade’s reward-to-risk worse than 1.5:1, skip it.
- Write the exit rule in advance. Pick one and apply it consistently: exit on the opposing signal-line cross above the upper zone, exit on a zero-line cross against you, or scale out at a fixed multiple of risk. Discretionary exits are where documented edges quietly disappear.
- Log the trade with its regime tag. After 40 to 50 trades, sort your results by regime. Almost every trader discovers the SMI performs well in one regime and badly in another. That information is worth more than any setting change.
Reading Market Regime First
Four regimes, four different sets of rules.
In a trending market, extremes confirm strength and pullbacks into the opposite zone are entry opportunities.
Do not fade extremes.
Ever.
In a ranging market, the SMI works closest to its textbook description. Extremes at range boundaries are reversal candidates, and divergence at those boundaries is genuinely predictive.
In high volatility, the high-low range widens dramatically, which compresses SMI readings toward zero even during large moves. Expect fewer extreme readings and widen your stops accordingly.
This is the regime where the 14/8/3 configuration earns its place.
In low-liquidity conditions (holiday sessions, exotic pairs, small-cap names), a single wide candle resets the entire lookback range. The SMI will produce dramatic-looking signals from what is essentially a spread artifact.
Stand down.
Confirming Signals Before You Enter
Confluence means independent agreement. Adding RSI to an SMI signal is not confirmation, because both measure momentum from the same closing prices. You have just asked the same question twice.
Real confirmation comes from a different dimension of the market.
A higher-timeframe trend read.
A structural level.
A volume characteristic.
Session context.
The practical standard: require the higher timeframe to agree on direction, the SMI to provide the timing, and a visible price level to provide the entry and the stop.
Three independent inputs.
If any one disagrees, the trade does not exist.
And when timeframes conflict, that is not a puzzle to solve.
It is a signal to skip.
Frequently Asked Questions
What is the best setting for the Stochastic Momentum Index?
There is no universal best setting, but 10/3/3 is the correct starting point because those were Blau’s original parameters. Swing traders working 1-hour and 4-hour charts generally get cleaner results from 14/5/3, while scalpers on 1-minute charts need 5/3/3 to see anything actionable.
Change one parameter at a time and test across at least 100 signals before committing.
How do you read the Stochastic Momentum Index?
Read the zero line first, then the extremes, then the crossovers. Above zero means price is closing in the upper half of its recent high-low range, which establishes bullish bias; below zero is the reverse.
Extremes beyond ±40 indicate a stretched condition, but only signal reversal in ranging markets. Signal-line crossovers time entries, and they only matter when they occur inside an extreme zone and agree with the higher timeframe.
What is the difference between SMI and stochastic?
The SMI measures the close’s distance from the high-low range midpoint, while the classic Stochastic measures distance from the range low. That gives the SMI a -100 to +100 scale with a meaningful zero line, versus the Stochastic’s 0 to 100.
The SMI also applies double exponential smoothing rather than a single pass, which typically cuts crossover signals by 30 to 50 percent and substantially reduces whipsaws.
What does SMI above 40 mean?
An SMI above +40 means price is closing well into the upper portion of its recent high-low range, indicating strong upward momentum. In a trending market that confirms strength and is not a sell signal, because the SMI can hold above +40 for dozens of candles during a genuine uptrend.
In a well-defined range, the same reading near resistance becomes a credible exhaustion warning.
Is SMI a leading or lagging indicator?
The SMI is a lagging indicator with some leading characteristics. It is calculated entirely from smoothed historical closes, so its turns typically arrive two to four candles after the actual price pivot.
Divergence and zero-line behaviour can hint at weakening momentum before price reverses visibly, which is why it leans leading, but it should never be treated as predictive on its own.
How do you use SMI divergence in trading?
Use divergence to build a case, then let price action trigger the entry. Regular divergence (price higher high, SMI lower high) warns that a move is running on weaker momentum, while hidden divergence (price higher low, SMI lower low) often marks the end of a pullback within a trend.
Only connect swing points that have candles on both sides, always wait for candle-close confirmation, and enter on a structural break rather than on the divergence itself.
Turning SMI Into a Disciplined Habit
The SMI is a good indicator being used badly by most of the people who have it on their charts. Not because the math is flawed, but because it gets asked to do a job it was never designed for.
It is a confirmation and timing layer. It tells you when inside a framework that has already decided whether and which direction.
Strip away the trend context and the risk rules, and you are left with a line that crosses another line, which is worth roughly nothing.
One habit will change your results more than any setting change. Before your next trade, write down three things: the current market regime, the higher-timeframe bias, and the exact price where the idea is wrong.
Do it before you look at the SMI.
Then the indicator is answering a question you already framed, rather than inventing one for you.
The decision framework, compressed: use the SMI for pullback timing when a trend is established and the higher timeframe agrees. Treat extremes as reversal candidates only inside a defined range.
Widen your smoothing when volatility expands, and stand aside entirely when liquidity is thin.
And when the regime and the timeframes disagree?
Skip it.
The best SMI signal of the week is often the one you did not take.
Risk Disclaimer: Trading involves risk. Past performance doesn't guarantee future results. Only trade with money you can afford to lose. PipTrend is a tool to assist your trading decisions, not financial advice.