S&P 500 Futures Explained: A Trader's Risk-First Guide
On this page
Why S&P 500 Futures Confuse New Traders
Three instruments track the same number.
They behave nothing alike.
The S&P 500 cash index, SPX options, the SPY ETF, and S&P 500 futures all reference the same basket of 500 large-cap US stocks.
But the way they settle, the hours they trade, and the amount of leverage they hand you are wildly different.
A trader who moves from buying 100 shares of SPY to buying one ES contract has just multiplied their exposure by roughly seven times without changing a single line on their chart.
That is where the confusion starts.
And where accounts die.
This guide takes a risk-first approach, which means we cover contract mechanics before we cover setups. You will get the exact tick values, a position-sizing formula, an explanation of how the overnight session differs from the 9:30am ET cash-session open, and a pre-market checklist you can use tomorrow morning.
One thing needs saying upfront.
Futures are leveraged, marked to market daily, and can produce losses that exceed the money you deposited. A gap through your stop on FOMC day is not a theoretical risk; it happens several times a year.
Risk controls come before chart analysis, always.
You can be right about direction and still be liquidated. Position size decides whether you survive long enough to be right.
What Are S&P 500 Futures, Exactly?
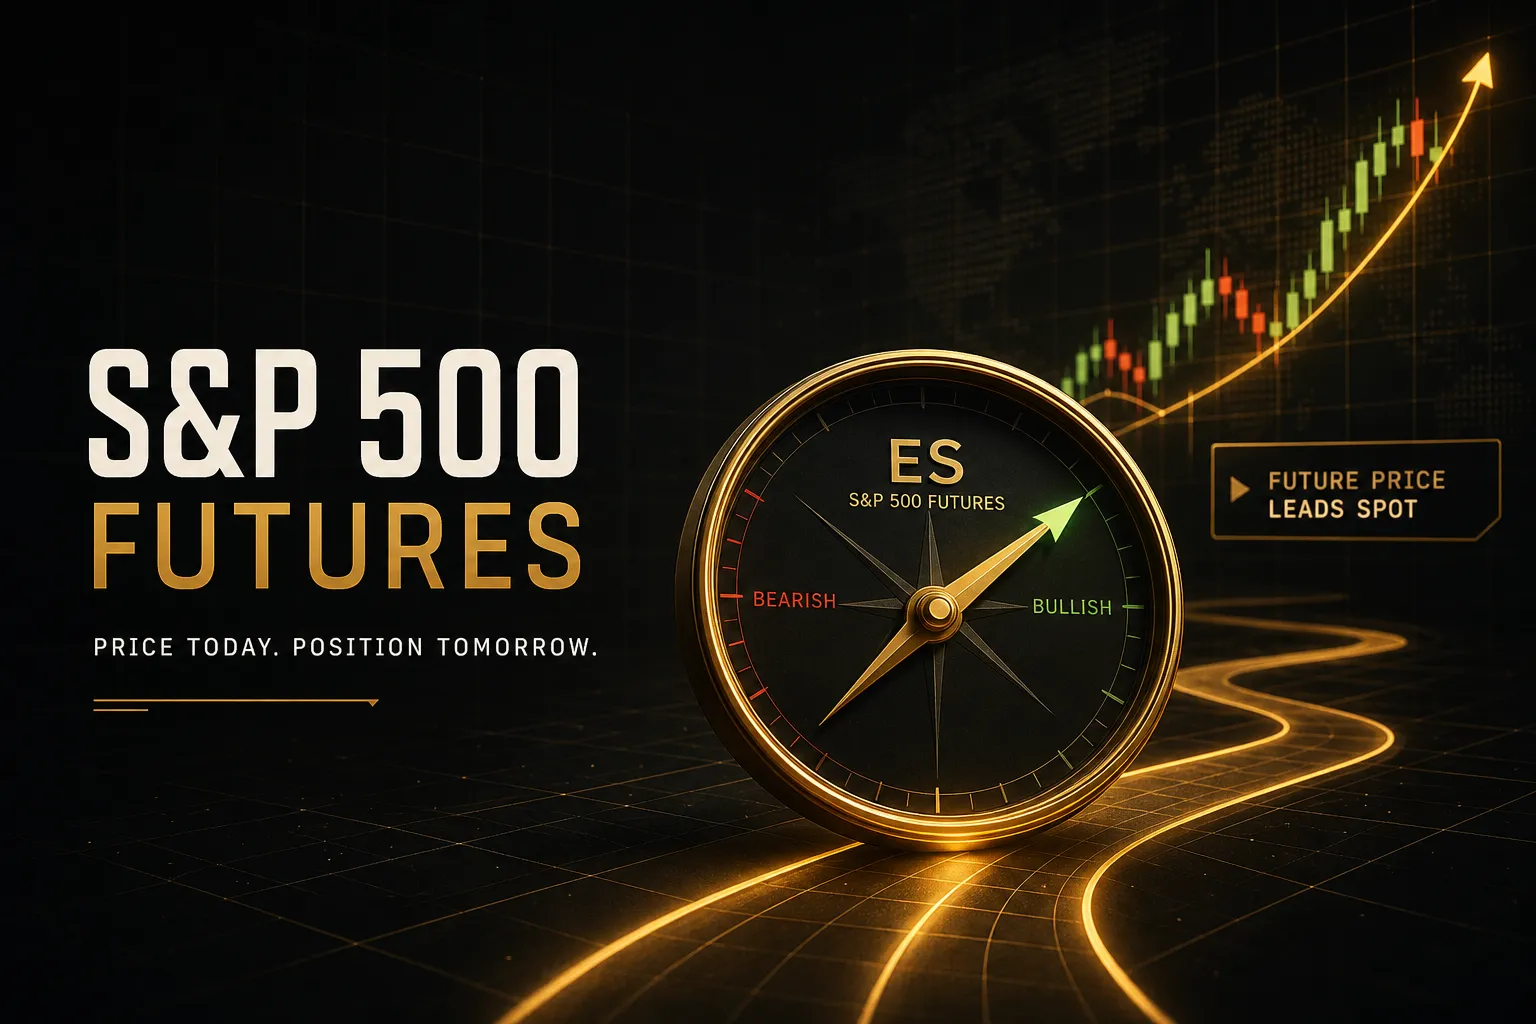
An S&P 500 futures contract is a standardized agreement, traded on CME Group exchanges, to exchange the cash value of the S&P 500 index at a set future date.
You are not buying stocks.
You are taking a leveraged position on a number.
Two contracts dominate retail flow: the E-mini S&P 500 futures contract (ES ticker) and the Micro E-mini S&P 500 futures contract (MES ticker). Same index, same trading hours, same order book logic.
The only meaningful difference is size.
ES vs MES Contract Sizes
The contract multiplier is the whole story.
ES is $50 per index point. MES is $5 per index point, exactly one-tenth the size.
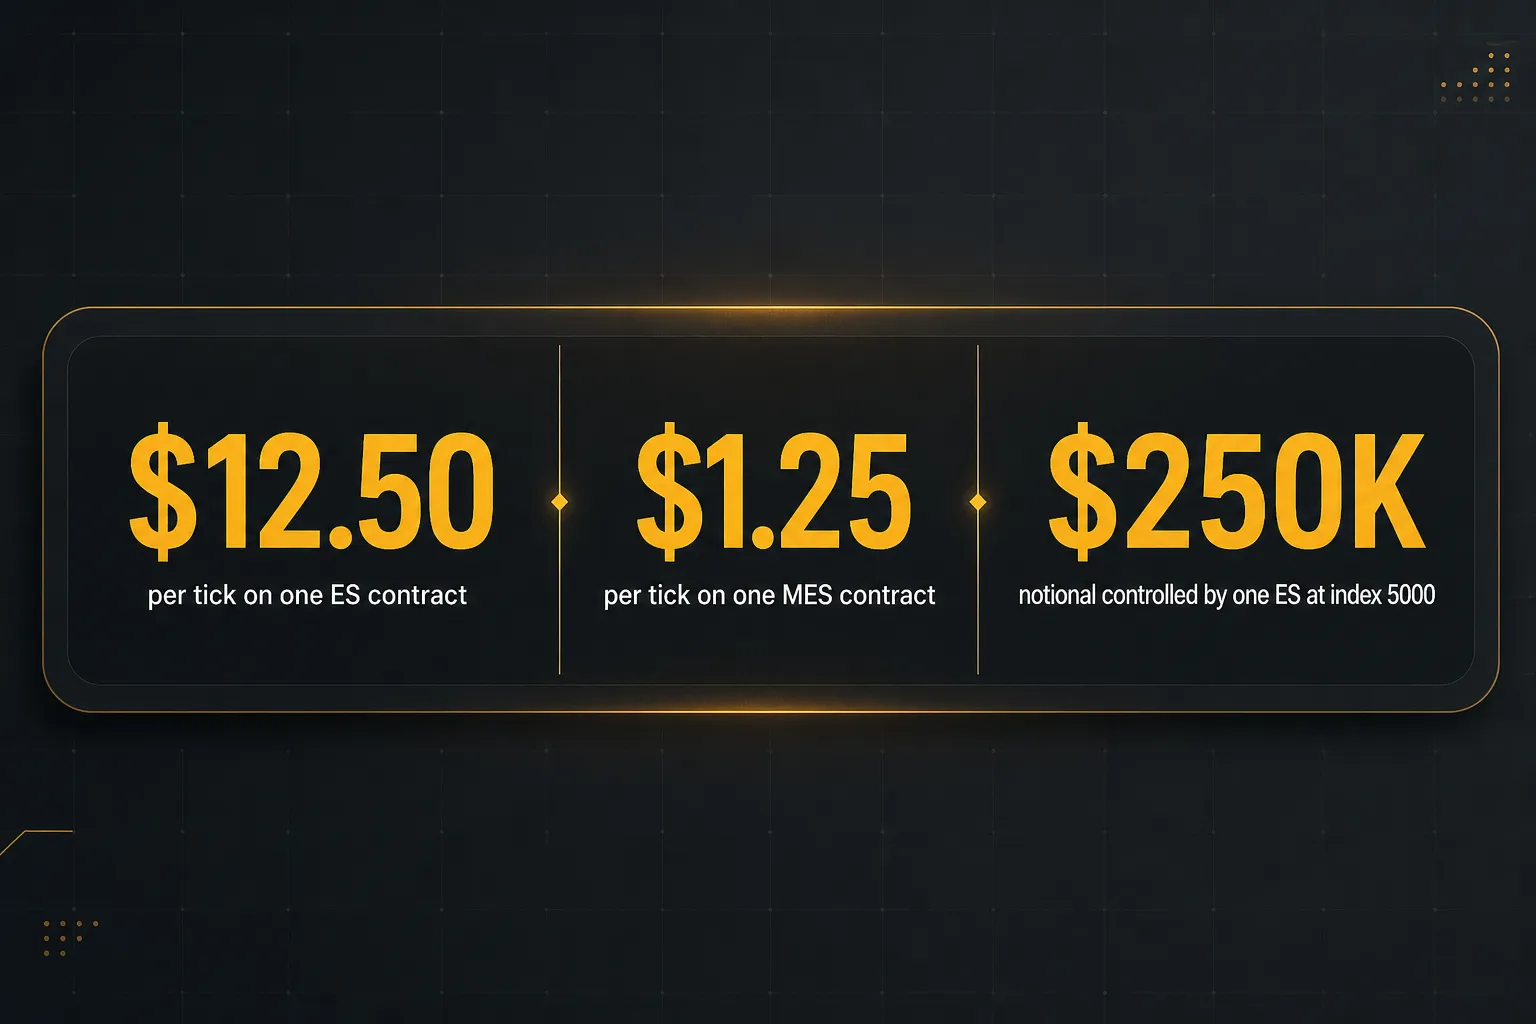
With the index near 5,000, one ES contract controls $250,000 of notional value.
One MES controls $25,000.
That single decision, ES or MES, changes your dollar risk per point by a factor of ten, which is why nearly every serious educator points beginners toward the Micro first.
Both contracts settle to cash.
There is no delivery of shares, no assignment, no basket of 500 stocks arriving in your account. At quarterly futures expiration, open positions settle against a special opening quotation calculated from the index components.
Futures, SPX, SPY, and the Index Compared
Here is where the four instruments actually diverge.
| Feature | ES / MES Futures | SPX Index Options | SPY ETF | S&P 500 Cash Index |
|---|---|---|---|---|
| What you own | Futures contract on the index | Option on the index | Shares of a fund holding the stocks | Nothing; it is a calculation |
| Settlement | Cash, quarterly (Mar/Jun/Sep/Dec) | Cash at expiry (weekly, monthly, EOM) | Shares held indefinitely | Not tradable |
| Trading hours | Nearly 23 hours, Sunday 6pm to Friday 5pm ET | 9:30am to 4:15pm ET, some extended sessions | 9:30am to 4pm ET plus pre/post market | 9:30am to 4pm ET calculation only |
| Approximate leverage | 10x to 20x via initial margin | Defined by premium paid | 1x cash, up to 4x with day-trade margin | None |
| Daily accounting | Mark-to-market settlement every session | Position marked, no cash flow until close | Unrealized P&L only | N/A |
| Point / share value | ES $50/pt, MES $5/pt | $100 per point of premium | Roughly 1/10th of index in dollars | N/A |
Notice the hours row.
Futures are the only instrument in that table that lets you react to a Tokyo selloff or a European central bank headline at 3am ET.
That access is genuinely useful and genuinely dangerous.
Notice also the mark-to-market row.
Futures cash-settle your gains and losses to your account every single day. There is no “waiting for it to come back” in an unrealized sense.
If the position moves against you, real money leaves the account tonight, and if it drops below maintenance margin, you get a call.
Contract Math: Points, Ticks, and Position Size
Most blown accounts trace back to arithmetic, not analysis.
So do the arithmetic first.
Both ES and MES have a minimum tick size of 0.25 index points. The tick value differs with the multiplier:
- ES: 0.25 points x $50 = $12.50 per tick, so $50 per full point.
- MES: 0.25 points x $5 = $1.25 per tick, so $5 per full point.
Four ticks make one point.
Keep that ratio in your head, because most trading platforms display stops in ticks while most traders think in points.
P&L on a 1, 4, and 10 Point Move
Abstract multipliers become real when you see the dollar column.
| Move in index points | Ticks | 1 ES contract P&L | 1 MES contract P&L | Realistic context |
|---|---|---|---|---|
| 1 point | 4 | $50 | $5 | Typical single-minute range mid-morning |
| 4 points | 16 | $200 | $20 | A tight opening-range stop distance |
| 10 points | 40 | $500 | $50 | Common swing stop or a CPI-release spike |
| 25 points | 100 | $1,250 | $125 | A quiet full-day range in low volatility |
| 75 points | 300 | $3,750 | $375 | An FOMC day or high volatility regime session |
Read the bottom row again.
A single ES contract held through one volatile session can swing nearly $4,000. On a $10,000 account, that is 37% of your capital riding on one contract with no size adjustment at all.
Notional Value vs Margin Requirement
Two numbers get conflated constantly, and the difference defines your true leverage.
Notional value is what you control: index price x multiplier. ES at 5,000 equals $250,000 of market exposure.
MES at 5,000 equals $25,000.
Initial margin is what your broker requires you to post to open the position.
For ES this has typically sat in the $12,000 to $25,000 range depending on the exchange’s volatility-linked settings, with MES around one-tenth of that. Many brokers also offer reduced day-trade margin, sometimes a few hundred dollars per contract, for positions closed before the session ends.
So the real leverage ratio on ES at exchange margin is roughly 10x to 20x. On day-trade margin of $500, it is 500x.
Yes, 500x.
That reduced intraday margin is a broker convenience, not a change in risk.
The contract still moves $50 per point regardless of what you posted to open it. Maintenance margin, the lower threshold you must stay above to keep the position, is what triggers the call when the market moves against you.
A Position-Sizing Formula You Can Use
Here is the calculation that should happen before every entry:
Contracts = account risk dollars / (stop distance in points x point value)
Worked example.
You have a $25,000 account and cap risk at 0.75% per trade, so $187.50. Your setup sits below a clean support level and requires a 12-point stop.
- MES: $187.50 / (12 x $5) = $187.50 / $60 = 3.1 contracts, so you trade 3.
- ES: $187.50 / (12 x $50) = $187.50 / $600 = 0.31 contracts, which you cannot trade.
That result is the entire argument for MES.
The Micro lets you size correctly on accounts under roughly $75,000; the E-mini forces you to over-risk or skip the trade. With 3 MES contracts and a 24-point target, your risk-to-reward ratio is 1:2 and your upside is $360 against $180 at risk.
Run this formula every time.
Not most times.
Trading Hours, Liquidity, and the Basis
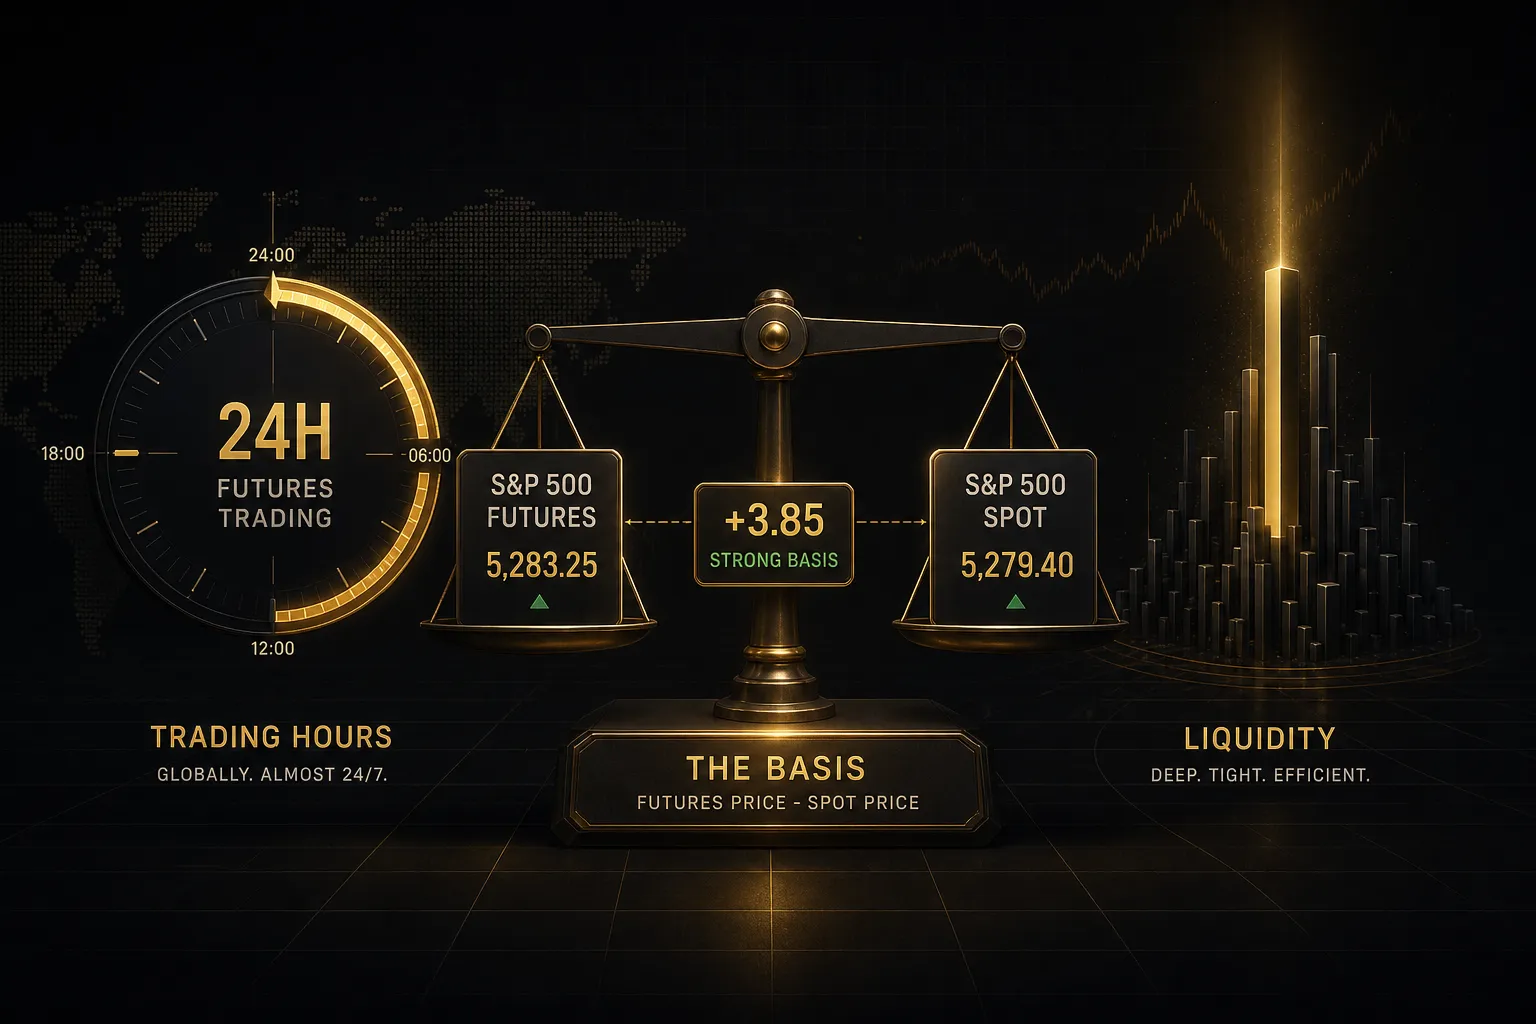
The S&P 500 stops calculating at 4pm ET.
The futures market does not stop trading.
CME Globex runs ES and MES from Sunday 6pm ET through Friday 5pm ET, with a daily maintenance halt from 5pm to 6pm ET. That is nearly 23 hours of continuous trading per weekday, and understanding how those hours differ from one another is one of the fastest ways to stop losing money for silly reasons.
Overnight Liquidity vs the Cash Open
Not all hours are created equal.
During the overnight session, particularly the Asia hours between roughly 8pm and 2am ET, the ES order book thins out dramatically. Resting size at each price level shrinks, the bid-ask spread can widen beyond the usual one tick, and a modest market order pushes price further than it would at 10am.
That is slippage, and it is not a rounding error.
A 100-lot market sell that fills at one tick of slip during the day can slip three or four ticks at 1am, on a chart that looks identical.
Then the European open around 3am ET adds volume. Around 8:30am ET, US economic data hits and activity accelerates sharply.
The cash-session open at 9:30am ET, when the underlying stocks start trading, routinely produces the highest volume of the entire 23-hour session.
Practical consequences: use limit orders overnight where possible, widen your expectations for fill quality, and treat overnight support and resistance levels as less reliable than levels built on real cash-session volume. A volume profile that includes thin Asian hours will show value areas that never had meaningful participation.
Fair Value and the Futures Basis
Futures almost never print exactly the same number as the index. The gap is the futures basis, and it exists for a mathematical reason, not a sentiment one.
Fair value = cash index + financing cost until expiry - expected dividends until expiry
Buying futures means you control $250,000 of exposure without paying for the stocks, so you effectively owe the cost of carrying that money.
But you also forgo the dividends the actual shares would pay.
When interest rates exceed the dividend yield, futures trade at a premium to the index; when dividends dominate, they trade at a discount.
Through 2024 and 2025, with short-term rates well above the S&P 500’s roughly 1.3% yield, the front-month contract has consistently traded at a premium of several points to a few dozen points depending on days to expiry. That premium decays toward zero as expiration approaches.
Which brings up a common misreading.
“S&P 500 futures are up 30 points” before the open does not mean the index will open 30 points higher. Part of that spread is fair value.
Futures reflect real-time order flow and repricing of risk, not a forecast.
Rollover and Choosing an Expiration
ES and MES expire quarterly: March, June, September, and December, on the third Friday of the month. Contracts carry codes like ESH6 (March 2026), ESM6 (June), ESU6 (September), and ESZ6 (December).
Volume does not migrate on expiration day.
It migrates during contract rollover, typically the Thursday about eight days before expiry, when the bulk of open interest shifts to the next quarter. Miss the roll and you end up analyzing a contract with collapsing liquidity and a distorted price relative to where the market actually trades.
Two rules.
Always trade the front month with the highest volume, and check which contract your data feed is charting after each roll. A continuous futures chart stitches quarters together for clean historical market structure, but be aware that the stitching method (back-adjusted or ratio-adjusted) changes the exact historical price levels you are drawing lines on.
Building a Risk-First Trading Plan
Discipline is not a personality trait.
It is a written document you follow when the screen gets loud.
Pre-Market Checklist
Spend fifteen minutes before 9:30am ET and you eliminate most avoidable mistakes. Work through this list in order, every session:
- Prior-day high, low, and close. These are the most-watched reference points in the ES order book. Mark them before the open, not after price reacts to them.
- Daily settlement price. The official CME settlement differs slightly from the 4pm print and anchors overnight positioning. Many desks measure the day’s bias as simply “above or below yesterday’s settlement”.
- Overnight high and low. The Globex range from 6pm to 9:30am ET creates the first liquidity pools the cash open will test. A break of the overnight high in the first thirty minutes behaves very differently from a failure at it.
- Economic calendar risk. Check for CPI, PPI, Non-Farm Payrolls, FOMC statements, and Fed speakers. Note the exact release time and decide in advance whether you are flat, hedged, or reduced into it. The economic calendar is the single largest source of gap risk in index futures.
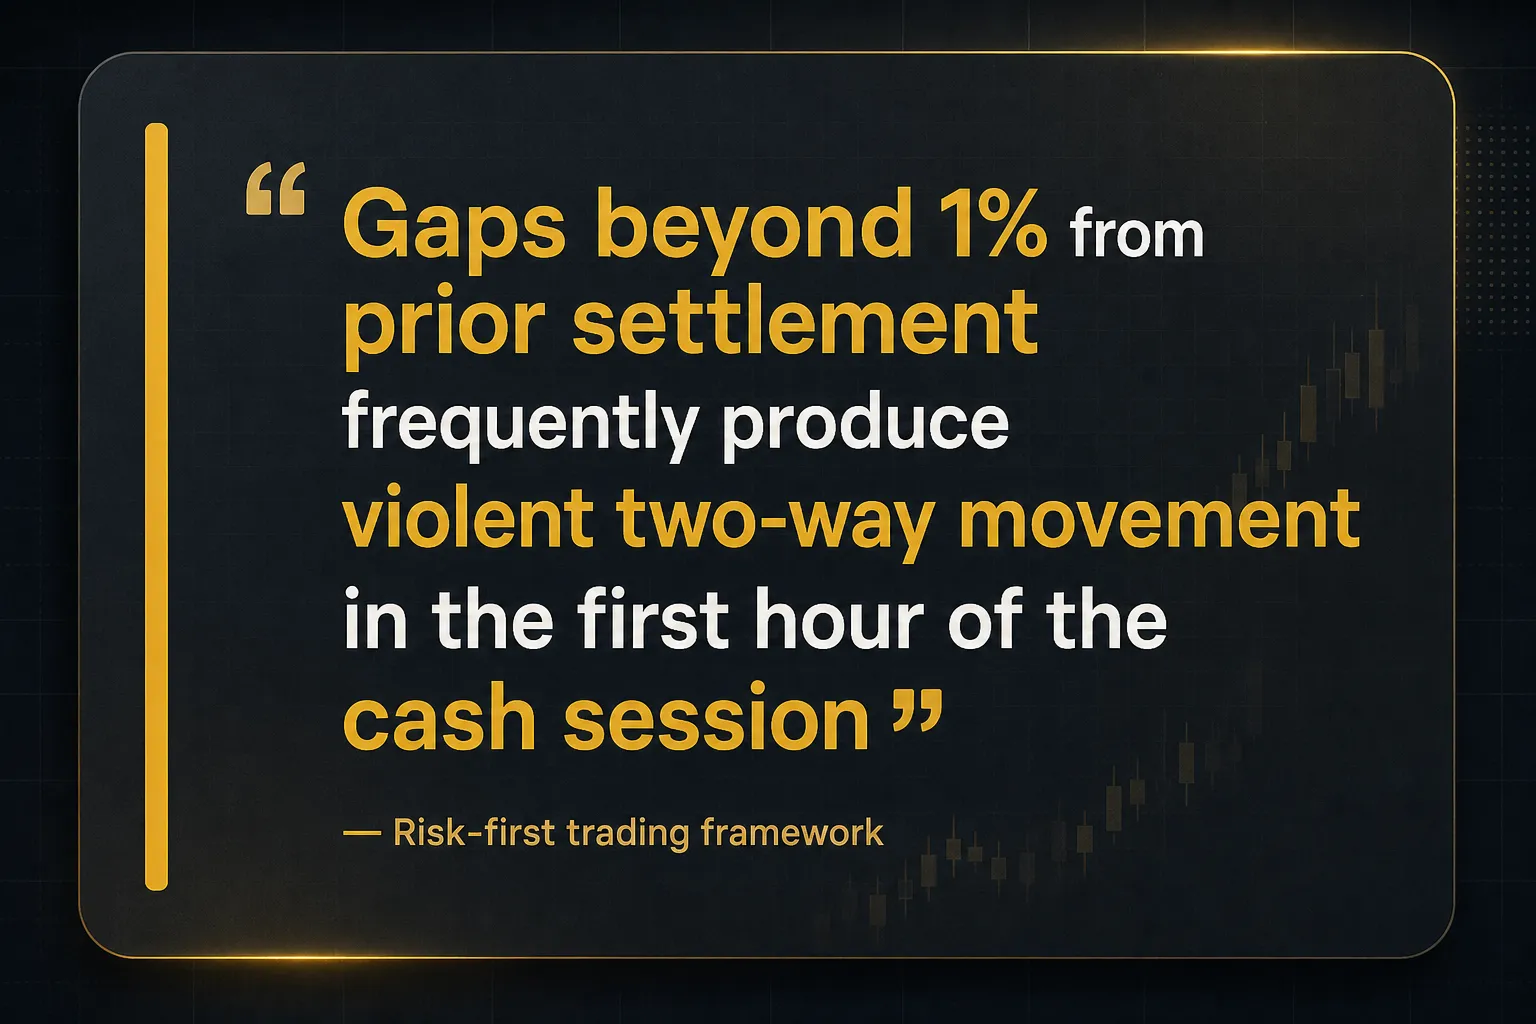
- Opening gap size. Measure the gap from yesterday’s settlement to the pre-open futures price, adjusting for fair value. Gaps under about 0.3% behave like normal continuation; gaps beyond 1% frequently produce violent two-way movement in the first hour.
- Key structure levels. Weekly and monthly highs and lows, prior consolidation edges, high-volume nodes from the volume profile, and any round number that has attracted attention (5,000, 6,000, and so on).
- Current volatility regime. Compare the last five sessions’ average true range to the prior month. Rising ATR means your normal 8-point stop is now inside the noise. Adjust stop distance and contract count together, never one without the other.
- Your maximum loss for the day. A hard dollar number, written down, after which you close the platform. This is the last item on the checklist and the first one people skip.
Confirmation Tools, Not Predictions
Indicators fall into four buckets, and stacking three from the same bucket tells you nothing new:
- Trend tools (moving averages, ADX, structure-based higher highs and lows) tell you the directional context. They lag by design.
- Momentum tools (RSI, MACD, rate of change) measure the speed behind a move. In strong trends they stay “overbought” for weeks, which is information, not a sell signal.
- Volatility tools (ATR, Bollinger Bands, standard deviation) size your stops and tell you whether the current range is normal or expanded.
- Timing tools (session opens, opening range breakout logic, VWAP reversion) narrow when a setup is valid.
The classic beginner error is loading four momentum oscillators onto a range-bound chart and then agonizing when they disagree. In a chop regime, they will disagree constantly, because there is no signal to find.
Fewer tools, clearly assigned to different jobs.
A confirmation layer can help, provided it is used correctly.
PipTrend, for example, offers non-repainting signals with a multi-timeframe confirmation table and a fakeout filter, so a setup on the 5-minute chart can be checked against higher-timeframe agreement before you commit size. Non-repainting matters here: a signal that redraws itself after the candle closes is unusable for measuring past performance.
A confirmation tool answers one question: does the higher timeframe agree with what I am about to do? It never answers: how much should I risk?
Use it alongside price action and market structure, not instead of them. Trend confirmation improves the quality of your entries.
Only position sizing protects the account.
Orders, Execution Risk, and Journaling
Order type is a risk decision, not a technical detail.
- Market order: guarantees a fill, not a price. Fine in liquid cash-session hours, expensive at 2am or during the first seconds after an 8:30am release.
- Stop order: becomes a market order when triggered. Your protective stop-loss order should almost always be this type, because you want out regardless of price.
- Stop-limit order: becomes a limit order when triggered, so it protects your price and risks no fill at all. Dangerous as a protective stop; a fast move can leave you unfilled and still in the position.
- Limit order: guarantees price, not a fill. The default choice for entries in thin overnight liquidity.
Two execution risks deserve specific attention.
First, news slippage: on CPI or FOMC days, ES can travel 15 to 40 points in under a minute, and stops inside that range fill wherever liquidity exists, not where you placed them. Second, CME price limits and volatility pauses: the exchange applies dynamic circuit breakers and can halt trading briefly during extreme moves, meaning you cannot exit during the halt.
Then journal.
Every trade, same fields: date, session time, setup name, entry, stop, target, contracts, planned risk in dollars, actual result, and one sentence on whether you followed the plan.
Review weekly and look for repeat offenders.
The usual suspects: overtrading the first fifteen minutes, moving stops further away to “give it room”, revenge trading immediately after a loss, doubling size on a hunch, and taking setups that were never in your tested playbook. Most traders discover that three or four recurring errors account for the majority of their losses.
You cannot fix a pattern you have not written down.
Frequently Asked Questions
What are S&P 500 futures telling us?
They tell you where traders are willing to transact on index exposure right now, in real time, including hours when US stocks are closed. That is current sentiment and order flow, not a prediction of the 9:30am open.
Remember that part of any pre-open gap is fair value, the financing cost minus expected dividends. A futures premium of 20 points does not mean the cash index will open 20 points higher.
How do you trade S&P 500 futures?
You open a futures-approved brokerage account, post initial margin, and buy or sell ES or MES contracts on CME Globex through a platform that routes to the exchange. Every position needs a defined stop distance in points and a contract count calculated from your risk budget.
The workflow that matters: pre-market checklist, identify the setup, calculate contracts using account risk divided by stop points times point value, place the entry and the protective stop together, then journal the outcome.
What is the difference between SPX and ES futures?
SPX is the index itself and the ticker for cash-settled index options on it; ES is the E-mini S&P 500 futures contract. SPX options give you defined risk through a premium and expire weekly or monthly, while ES gives you linear leveraged exposure at $50 per index point with quarterly expirations.
The other big difference is hours.
ES trades nearly 23 hours a day; SPX options trade primarily within regular US market hours plus some extended sessions.
How much does one ES contract cost?
You do not pay the notional value, so an ES contract at index 5,000 does not cost $250,000. You post initial margin, historically in the $12,000 to $25,000 range set by the exchange, and many brokers allow much smaller day-trade margin for positions closed before the session ends.
The number that actually matters is $50 per point of movement, regardless of margin posted. MES requires roughly one-tenth the margin and moves $5 per point.
Are S&P 500 futures a good way to trade the market?
They are efficient for traders with tested rules and strict position sizing, and unforgiving for everyone else. The advantages are real: deep liquidity, near-24-hour access, tight spreads in the cash session, and no pattern day trader rule.
The offsetting reality is leverage plus daily mark-to-market settlement, which means losses can exceed your deposit during gap events. Start with MES, size using the formula, and prove your process over dozens of trades before scaling.
What time do S&P 500 futures open and close?
ES and MES trade on CME Globex from Sunday 6:00pm ET to Friday 5:00pm ET, with a daily maintenance break from 5:00pm to 6:00pm ET. That gives you nearly 23 hours of trading each weekday.
Liquidity is not uniform across those hours.
The highest volume clusters around the 8:30am ET data releases, the 9:30am ET cash-session open, and the 3:00pm to 4:00pm ET close.
Start Small, Trade the Plan, Not the Screen
If your account is under roughly $75,000, trade MES. The math is not a preference; a 12-point stop on one ES contract risks $600, which no small account can size around, while MES lets you take the identical setup at $60 per contract and scale in units instead of all-or-nothing.
Learn how the contract behaves at $5 a point. Then decide whether $50 a point is a step you have earned.
One habit to adopt tonight, before the next session opens: write down your pre-market checklist and a single maximum-risk-per-trade dollar figure.
Tape it somewhere visible.
Traders who define that number in advance do not need willpower at 9:34am, they just need to follow their own instructions.
Confirmation tools help.
PipTrend’s non-repainting multi-timeframe table and fakeout filter can tell you whether higher timeframes agree with your entry, and that is genuinely useful information.
But no indicator places your stop, calculates your contracts, or decides when you have lost enough for one day.
Those remain yours, and they are the only part of trading that reliably keeps you in the game.
Risk Disclaimer: Trading involves risk. Past performance doesn't guarantee future results. Only trade with money you can afford to lose. PipTrend is a tool to assist your trading decisions, not financial advice.