RSI Indicator: What It Really Tells Traders
On this page
RSI Isn’t a Crystal Ball
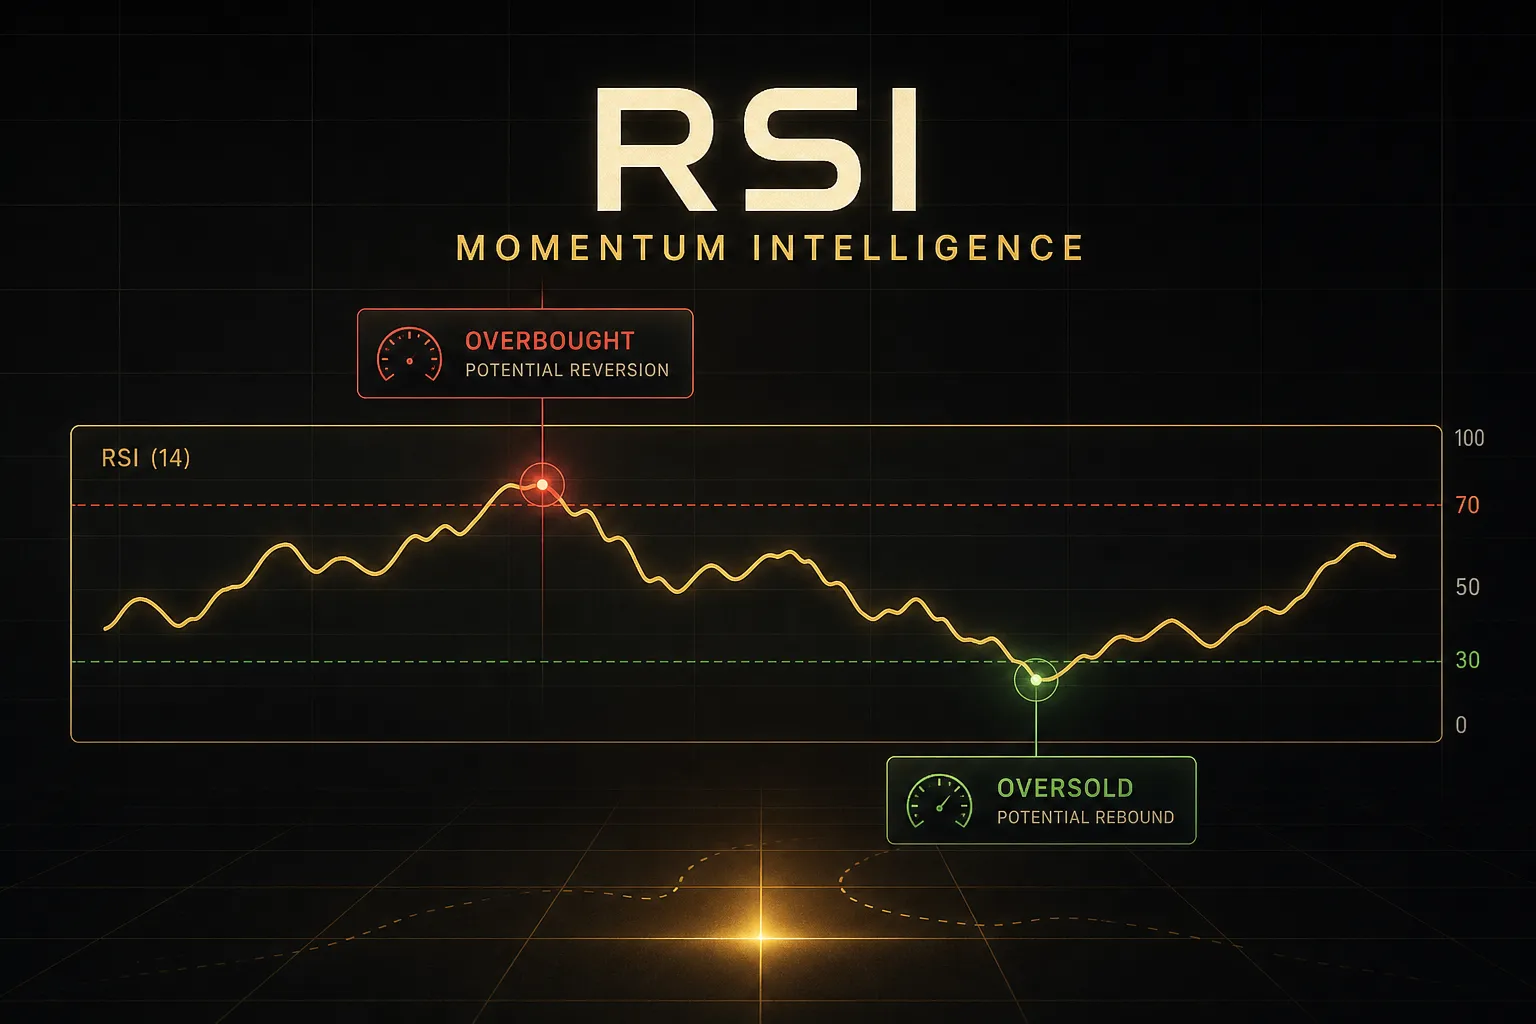
Ask ten new traders what the RSI indicator does, and nine will tell you the same thing: above 70 you sell, below 30 you buy. It sounds clean.
It’s also the fastest way to get run over by a trending market.
During the 2020-2021 crypto bull run, Bitcoin’s daily RSI stayed above 70 for weeks at a stretch. Traders shorting every “overbought” print lost repeatedly while price kept climbing.
The indicator wasn’t broken.
The interpretation was.
The Relative Strength Index is a momentum oscillator. It measures the speed and magnitude of recent price changes on a 0-100 scale.
That’s it.
It tells you how forcefully price has been moving, not where price is going next.
Here’s the part most guides skip: the same RSI reading carries completely different meaning depending on market conditions. An RSI of 72 in a sideways range is a genuine warning of exhaustion.
The identical reading in a strong uptrend is often confirmation that buyers are in control.
RSI doesn’t predict reversals. It describes momentum. Everything else is context you have to supply yourself.
This guide builds that context.
We’ll break down what the formula actually computes, how readings shift across market regimes, when divergence is worth trading and when it’s a trap, and how to fold RSI into a testable plan alongside trend filters, market structure, and multi-timeframe analysis.
By the end, you won’t be looking for a magic number. You’ll be reading momentum in context, which is what the indicator was designed for when J. Welles Wilder Jr. published it in 1978.
What RSI Actually Measures
Most traders use RSI daily without knowing what’s happening under the hood. That’s a problem, because the mechanics explain exactly why the indicator behaves the way it does at extremes.
The RSI Formula Explained
RSI compares the size of recent gains to the size of recent losses. The standard RSI period is 14 candles, meaning it looks back over the last 14 closes.
The calculation runs in two steps.
First, compute the average gain and average loss across the lookback window. Then divide one by the other to get relative strength (RS), and normalize it:
RSI = 100 - (100 / (1 + RS)), where RS = average gain / average loss.
The first calculation uses a simple average. Every subsequent bar uses Wilder smoothing, an exponential method that weights the prior average at 13/14 and the new value at 1/14.
This is why RSI moves smoothly rather than jumping around.
Two practical consequences fall out of this.
If there are no losses in the window, average loss approaches zero, RS approaches infinity, and RSI pins near 100. And because the smoothing carries history forward, RSI has memory.
A single explosive candle doesn’t reset it.
RSI is calculated on closing prices by default.
Wicks are ignored entirely.
That’s a meaningful detail: a candle that spikes 3% intraday and closes flat contributes nothing to RSI.
You may also notice small discrepancies between platforms. Some data providers use different smoothing implementations, different session close times, or different price sources (bid vs mid in forex). A reading of 69.4 on one chart can show as 70.8 on another.
Never build a strategy that hinges on a single decimal point.
RSI vs Relative Strength
The naming is genuinely unfortunate.
“Relative Strength Index” and “relative strength” are two different concepts, and confusing them is one of the most common beginner errors.
Relative strength compares one asset’s performance against another, usually a benchmark. If a stock is up 18% while the S&P 500 is up 6%, that stock has strong relative strength.
It’s a cross-asset comparison used heavily in sector rotation and stock screening.
RSI compares an asset to itself.
It measures recent up-moves against recent down-moves within the same instrument.
No benchmark involved.
Nothing external at all.
So an asset can have an RSI of 25 (weak internal momentum) while still massively outperforming its index. The two metrics answer different questions and can point in opposite directions without either being wrong.
RSI vs Stochastic RSI
Stochastic RSI applies the stochastic oscillator formula to RSI values instead of price. It asks where the current RSI sits within its own recent high-low range, then scales that to 0-100.
The result is far more sensitive.
Where standard RSI might drift between 45 and 60 for days, Stochastic RSI in the same stretch will swing repeatedly from 0 to 100.
More signals, more noise.
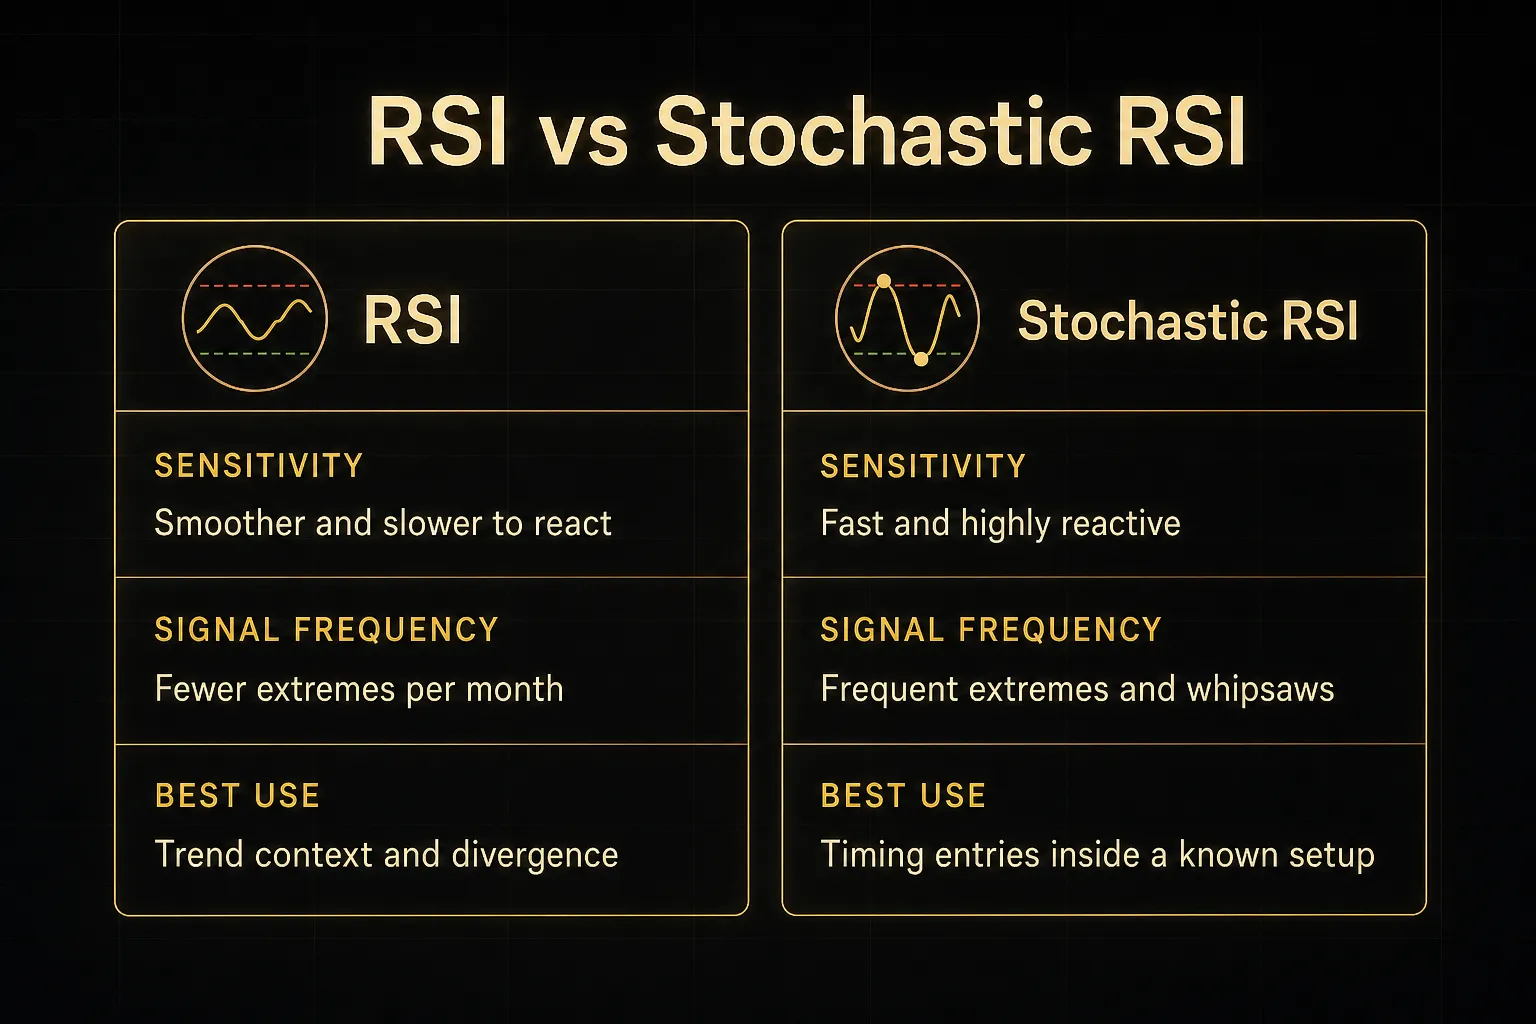
Practical rule: use standard RSI to assess whether momentum conditions favor your thesis, and reach for Stochastic RSI only when you already have a directional bias and need tighter entry timing.
Traders who use Stochastic RSI as their primary decision tool tend to overtrade badly.
RSI in Different Market Regimes
This is the section that separates traders who profit from RSI from traders who blame it.
The thresholds are not fixed.
They shift with the volatility regime and trend condition.
Constance Brown’s work on range shift made the point decades ago: RSI tends to oscillate between roughly 40 and 90 during strong uptrends, and between roughly 10 and 60 during strong downtrends. The 30/70 defaults assume a market with no directional bias, which describes maybe a third of trading conditions.
| Market Regime | Typical RSI Range | What 70+ Implies | What 30- Implies | Appropriate Response |
|---|---|---|---|---|
| Range-bound / sideways | 30 - 70 | Genuine overbought condition; range top likely near | Genuine oversold condition; range low likely near | Fade extremes, but only after a close back inside the level plus a rejection candle at range boundary |
| Strong uptrend | 40 - 90 | Trend confirmation, not exhaustion; buyers dominant | Rare and significant; possible trend failure or capitulation low | Buy pullbacks into the 40-50 zone; ignore 70+ as a short trigger |
| Strong downtrend | 10 - 60 | Rare; often marks a lower-high short entry | Trend confirmation; sellers dominant | Sell rallies into the 50-60 zone; ignore sub-30 as a long trigger |
| High volatility / choppy | 15 - 85 with rapid swings | Low reliability; may reverse within 1-2 candles | Low reliability; whipsaw risk elevated | Widen thresholds to 20/80, lengthen RSI period, or stand aside entirely |
Range-Bound Markets
Ranges are RSI’s home turf.
When price oscillates between defined support and resistance, momentum extremes genuinely coincide with turning points because there’s no directional force overriding them.
The discipline is in confirmation.
A threshold touch is not a signal.
RSI poking 71 for one candle means nothing on its own.
A confirmed signal has three components: RSI closes back below 70 (or above 30), price is reacting at a known structural level, and the candle itself shows rejection through a long wick, an engulfing pattern, or a failed breakout close. Volume confirmation strengthens the case further.
Strong Trending Markets
In a strong trend, treating high RSI as a sell signal means fighting the dominant flow.
And the market doesn’t reward that.
Why does high RSI confirm strength? Because RSI above 70 means average gains are massively outpacing average losses over 14 bars.
That’s the mathematical fingerprint of persistent buying pressure, not fragility.
The useful trend application is inverted.
In an uptrend, watch for RSI dipping to the 40-50 area on a pullback while price holds a rising moving average. That’s a continuation entry with the trend, not a reversal bet against it.
The centerline crossover at 50 matters here too. Sustained readings above 50 indicate bullish control; a decisive break below 50 that holds is often an earlier warning of trend deterioration than any 70-level signal.
Volatile or Choppy Markets
High-volatility environments break RSI in a specific way: readings hit extremes and reverse before you can act. Crypto during a liquidation cascade, or forex pairs around a central bank surprise, will print RSI 12 and RSI 78 within the same hour.
Three adjustments help.
Widen thresholds to 20/80 so only true extremes register. Lengthen the RSI period to 21 or 25 to smooth the whipsaw.
Or accept that the highest-probability decision in chop is often no trade at all.
A failure swing is worth watching in these conditions. That’s when RSI enters oversold, recovers above 30, pulls back but holds above its prior RSI low, then breaks its intervening peak.
Wilder considered this one of the stronger RSI patterns precisely because it demands multiple confirmations.
RSI Divergence: Signal or Trap?
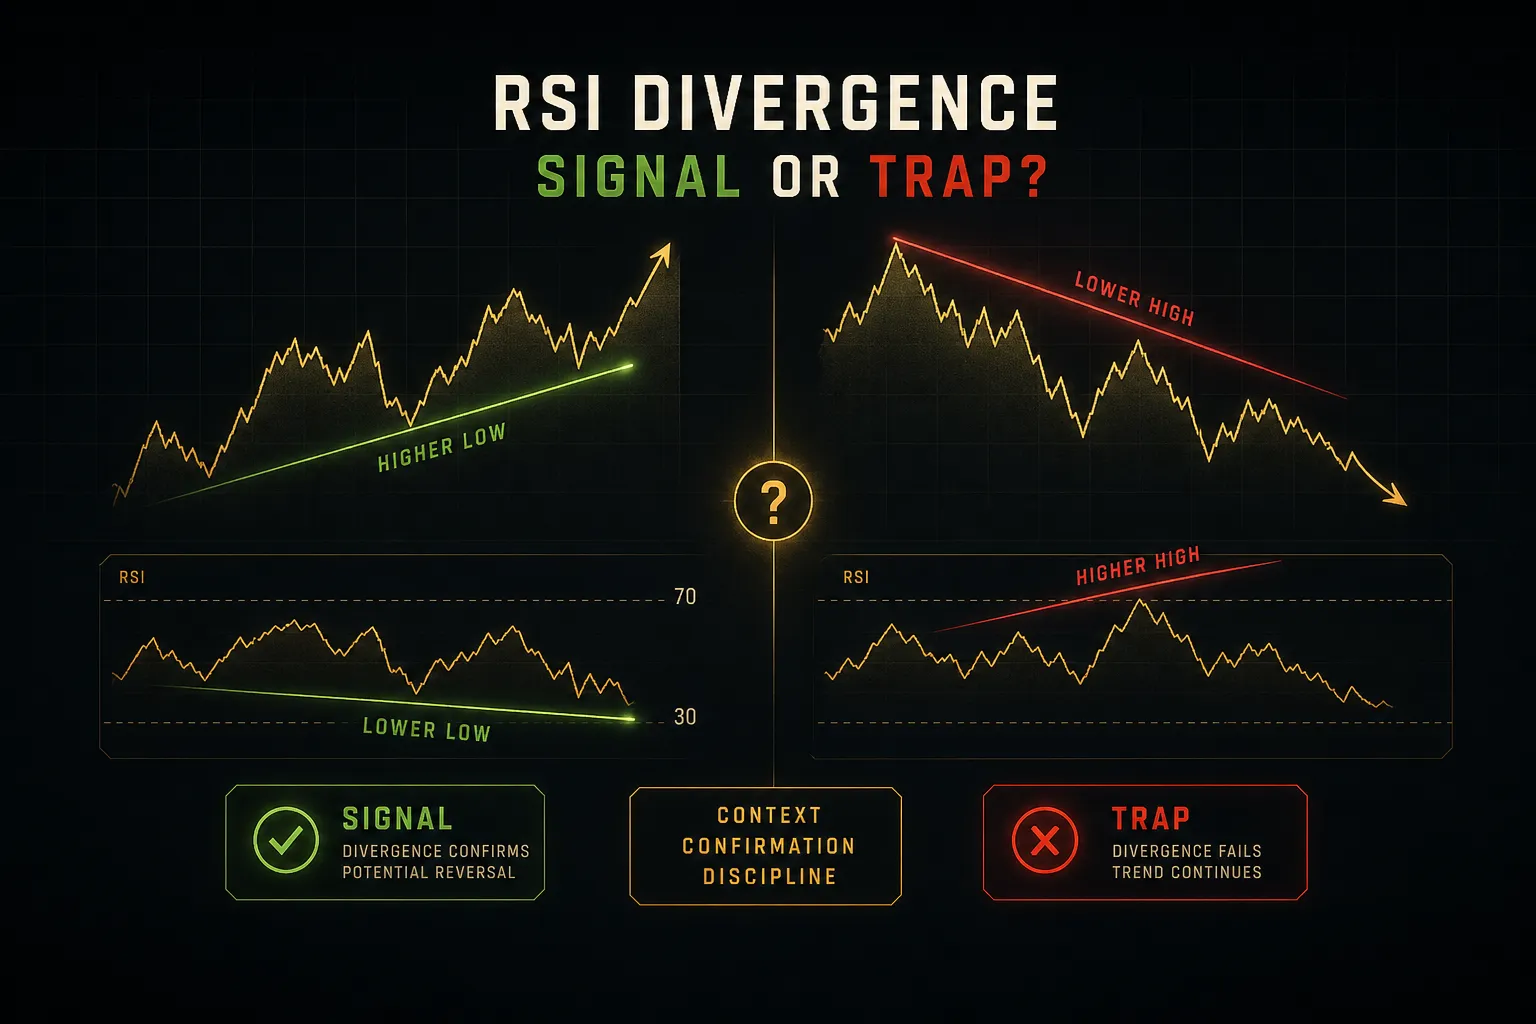
Divergence is the most seductive RSI concept and the most frequently mishandled. It looks brilliant in hindsight and costs money in real time.
Regular vs Hidden Divergence
Regular divergence occurs when price makes a new extreme but RSI does not. It suggests the move is losing internal momentum even as price extends.
Bearish divergence: price prints a higher high, RSI prints a lower high. Buying pressure behind each successive push is weakening.
Bullish divergence: price prints a lower low, RSI prints a higher low. Selling pressure is fading.
Hidden divergence (also called hidden or reverse divergence) flips the relationship and points to continuation rather than reversal. In an uptrend, price makes a higher low while RSI makes a lower low, meaning the pullback shook out weak hands harder than price action suggested.
It’s a trend-continuation clue, and it appears far more often in healthy trends than most traders notice.
The mental model matters.
Regular divergence says “this move is tiring.” Hidden divergence says “this pullback was deeper in momentum terms than in price terms, and the trend is still intact.”
Failed Divergence and False Signals
Here’s the structural problem with divergence: you identify it using pivot highs and lows, and a pivot isn’t confirmed until several candles have closed on both sides of it.
By the time the divergence is visually obvious, price has often already moved.
Worse, divergence can persist and extend.
Price makes a higher high with lower RSI, then does it again, and again. Each new leg invalidates the previous divergence while creating a fresh one.
Traders who short the first instance get stopped out three times before the reversal finally arrives.
Divergence is not a trade signal until confirmed. Acceptable confirmation includes a market structure break (a swing low giving way in an uptrend), a moving average cross, or a decisive rejection at a tested support or resistance zone.
Reliability varies sharply by regime.
In range-bound markets and during trend transitions, divergence has real predictive value. In strong, low-pullback trends, it fails often enough that trading it directionally is close to a coin flip with worse risk-reward.
One filter that helps: only take divergence signals where the higher timeframe agrees.
A bearish divergence on the 15-minute chart inside a daily uptrend is noise. The same divergence on the daily chart, at daily resistance, with the weekly rolling over, is a setup.
Turning RSI Into a Trade Plan
An indicator reading is not a strategy.
A strategy specifies what triggers entry, where the stop goes, how much you risk, and how you’ll know if the whole thing stops working.
Choosing an RSI Setting
The default 14 exists because Wilder chose it in 1978 for daily commodity charts. It’s a reasonable starting point, not a law of nature.
Shortening the RSI period to 7 or 9 makes it far more sensitive. You get more extreme readings, earlier signals, and considerably more false positives.
Scalpers on 1-5 minute charts often prefer this, accepting the noise in exchange for speed.
Lengthening to 21 or 25 smooths the line, produces fewer signals, and adds lag. Swing and position traders working on daily and weekly charts usually benefit here, because the noise reduction outweighs the delayed entry.
Asset class matters.
Forex majors, with their relatively contained daily ranges, work well with 14 on most timeframes. Crypto and small-cap equities, where 8% daily moves are ordinary, often need a longer period or widened 20/80 thresholds to avoid constant extreme readings that carry no information.
One warning.
Optimizing the RSI period until backtest results look perfect is curve-fitting, and it fails the moment conditions change. If your edge disappears when you shift from RSI 11 to RSI 14, you didn’t find an edge.
You found an artifact.
Combining RSI With Trend and Structure
RSI answers one question: how strong has recent momentum been? It cannot tell you direction of the dominant trend, where price is likely to react, or whether the setup offers acceptable risk-reward ratio.
Those need other inputs.
A workable three-filter structure looks like this:
- Trend filter. A 50-period or 200-period moving average defines the bias. Only take RSI long signals when price is above it, only shorts when below. This single rule eliminates most counter-trend disasters.
- Structure filter. The RSI extreme must occur at a meaningful level, prior swing high or low, a well-tested support and resistance zone, a trendline, or a higher-timeframe level. An RSI 28 in the middle of nowhere is not a location.
- Trigger. Price action confirms. A rejection wick, an engulfing candle, or a break of a minor swing point gives you a defined entry with a definable stop.
The stop is not arbitrary.
Stop-loss placement should sit beyond the structure that invalidates your idea, below the swing low you bought at, above the swing high you sold at. If that stop distance makes the trade’s risk-reward worse than roughly 1:2, skip it rather than shrinking the stop to make the numbers look better.
Checking Timeframe Alignment
A daily RSI at 62 and rising can sit alongside a 15-minute RSI at 24.
Both are correct.
They’re measuring momentum over completely different windows.
That contradiction is where most false signals live. The oversold 15-minute reading is just a pullback inside a healthy daily uptrend, which makes it a buying opportunity, not a short.
Traders who look only at their execution timeframe read it backwards.
Multi-timeframe analysis fixes this cheaply. Before acting on any RSI reading, check at least two timeframes above your entry chart. Trading the 15-minute? Look at the 1-hour and the 4-hour.
Alignment across timeframes doesn’t guarantee anything, but misalignment is a reliable warning.
Tools built for this make the check fast. A multi-timeframe confirmation view like the 12-timeframe table in PipTrend shows at a glance whether an RSI-based idea agrees with the broader trend across every timeframe from minutes to weeks, which keeps the oscillator as one input rather than the whole decision.
Finally, test it.
A complete RSI plan needs an explicit entry trigger, structure-based stop, position size tied to a fixed percentage of account risk (most professionals stay under 1-2% per trade), and defined exit logic. Then backtest it, and critically, validate on out-of-sample data the optimization never touched.
A plan that only works on the data used to build it isn’t a plan.
It’s a memory.
RSI Questions Traders Ask
What is the RSI indicator and how does it work?
The RSI indicator is a momentum oscillator that measures the magnitude of recent price gains against recent losses on a 0-100 scale. It divides the average gain by the average loss over a lookback period, typically 14 closing prices, applies Wilder smoothing, and normalizes the result.
Readings above 50 indicate that up-moves have dominated recently; readings below 50 indicate the opposite. The traditional 70 and 30 levels flag overbought and oversold conditions, but as covered above, those thresholds shift meaningfully depending on whether the market is ranging or trending.
What is the best RSI setting for day trading?
Most day traders use RSI 14 on 5-minute to 1-hour charts, with 9 as the common alternative for faster signals. There’s no universally optimal number, and the correct answer depends on your timeframe, the instrument’s volatility, and how many false signals your strategy can absorb.
Shorter periods react faster but generate substantially more noise. If you’re scalping a volatile crypto pair, widening thresholds to 20/80 while keeping RSI 14 usually beats shortening the period, because it filters signals rather than multiplying them.
Should I buy when RSI is below 30?
No, not on that basis alone.
An RSI below 30 in a strong downtrend is confirmation that sellers are in control, and buying into it is the classic way traders lose money catching falling knives.
Sub-30 readings become tradeable when three things line up: the broader trend is neutral or bullish, price is reacting at established support, and a confirmation candle or structure break shows buyers stepping in.
In a confirmed downtrend, sub-30 is a reason to stay out, not to buy.
What does RSI 70 mean?
RSI 70 means average gains have outpaced average losses roughly 2.33 to 1 over the lookback period. It’s conventionally labeled overbought, but the accurate reading is simply strong bullish momentum.
In a range-bound market, RSI 70 near resistance is a legitimate exhaustion warning. In a strong uptrend, it’s trend confirmation and can persist for weeks.
Context determines which situation you’re in, not the number itself.
Is RSI a leading or lagging indicator?
RSI is technically a lagging or coincident indicator, because every input is historical price data. Nothing in the calculation looks forward, despite RSI often being marketed as predictive.
Where it can feel leading is at extremes and in divergence, since momentum sometimes decelerates before price turns.
But that’s a probabilistic tendency derived from past data, not forecasting.
Treating RSI as a descriptive momentum gauge rather than a prediction engine produces better decisions.
Which is better, RSI or MACD?
Neither is better; they measure momentum differently and answer different questions.
RSI is a bounded oscillator (0-100) that shows momentum relative to an asset’s own recent range, making it well suited to identifying extremes. MACD is unbounded and built from moving average differences, making it stronger at identifying trend direction and momentum shifts.
Combining them adds value when you use RSI for entry timing and MACD for trend confirmation. It adds nothing when you simply wait for both to say “oversold,” since you’re then confirming one momentum reading with a highly correlated second one and calling it independent evidence.
Read Momentum, Don’t Predict It
The shift that makes RSI genuinely useful is small but total: stop treating it as a buy/sell trigger and start treating it as a momentum gauge that requires regime context.
Two decision rules cover most situations.
In ranges, fade extremes, but only with confirmation, meaning RSI closing back through the threshold, price reacting at a real support or resistance level, and a rejection candle to trigger entry.
In trends, use RSI dips and rises as continuation entries, buying pullbacks toward 40-50 in uptrends and selling rallies toward 50-60 in downtrends, rather than betting against the dominant flow at 70 or 30.
Everything else is risk management.
Define the stop by structure, size the position by a fixed risk percentage, and check whether your higher timeframes agree before committing capital.
RSI has survived since 1978 because it does one job accurately.
It measures momentum.
The moment you ask it to also identify trend, mark structure, and time reversals on its own, it fails, and traders blame the tool instead of the assignment.
Pair it with trend, structure, and multi-timeframe confirmation. Then it earns its place on your chart.
Sources
Risk Disclaimer: Trading involves risk. Past performance doesn't guarantee future results. Only trade with money you can afford to lose. PipTrend is a tool to assist your trading decisions, not financial advice.