
The world of online trading is changing faster than ever, and staying ahead means using every tool at your disposal. In this landscape, trading view indicators have become essential for anyone serious about gaining a competitive edge.
TradingView stands out as the platform of choice for traders seeking powerful charting features and fully customizable indicator options. The right tools can transform how you analyze markets and spot opportunities.
As we move into 2025, picking the best indicators is more important than ever. The right selections help you act quickly, reduce risk, and maximize profits in markets that never stand still.
This article reveals the top 10 TradingView indicators for 2025. We’ll break down their features, benefits, and the best scenarios for using each one.
From proven classics to cutting-edge AI-powered solutions, you’ll discover the trading view indicators that can help you refine your strategy and take your trading to the next level.
Understanding TradingView Indicators
TradingView indicators are the secret sauce behind many successful trading strategies. These tools, available right inside the TradingView platform, help traders break down complex market data into clear, actionable insights. By using mathematical formulas and visual cues, trading view indicators can reveal trends, momentum changes, and even potential reversals before they’re obvious on the price chart.
If you’re new to this world, you’ll find that TradingView offers a mix of built-in, custom, and community-created indicators. Thanks to Pine Script, users can even code their own unique formulas. For a deeper dive into how these tools work and what sets them apart, check out the TradingView Indicators Overview. Classic examples like RSI help spot overbought or oversold conditions, while MACD shines in identifying trend shifts across different assets.
What Are TradingView Indicators?
Trading view indicators are essentially algorithms or visual tools designed to analyze price, volume, and related market data. Their main job is to simplify the vast flow of market information, turning it into signals or patterns that traders can act on with more confidence.
On TradingView, you’ll find three main categories:
- Built-in indicators: Pre-installed and ready to use.
- Custom indicators: Created by users, often using Pine Script.
- Community indicators: Shared openly by other traders for anyone to try.
Popular indicators like RSI (Relative Strength Index) and MACD (Moving Average Convergence Divergence) serve different purposes. While RSI is perfect for momentum strategies, MACD blends momentum and trend analysis, giving traders flexible options for various market conditions.
Why the Right Indicators Matter in 2025
As we head into 2025, markets are moving faster and becoming more unpredictable. Algorithmic trading and global news can trigger sharp moves in seconds. That’s why choosing the right trading view indicators is more crucial than ever. Retail traders need adaptable, data-driven tools to stay competitive.
Recent stats show that over 50 million users worldwide rely on these indicators for trade timing and risk management. By combining several indicators—like using momentum and trend tools together—you can filter out false signals and boost your accuracy. A great example is multi-timeframe analysis, where traders check signals on different timeframes to avoid trading against the bigger trend.
How to Access and Use Indicators on TradingView
Getting started with trading view indicators on TradingView is straightforward. Here’s a quick step-by-step guide:
- Open your asset chart.
- Click the “Indicators” button at the top.
- Search for your desired indicator and click to add it.
- Layer multiple indicators for a custom strategy.
- Favorite indicators for quick access later.
Both free and premium TradingView accounts support these features. You can also save custom indicator templates, making it easy to switch strategies for stocks, forex, crypto, or any other asset class. This flexibility empowers traders to adapt their setups in seconds.
Types of Indicators: Trend, Momentum, Volume, and Volatility
Trading view indicators fall into four main categories, each serving a unique purpose:
- Trend indicators: Reveal the prevailing market direction (e.g., Moving Averages).
- Momentum indicators: Measure the speed of price movements (e.g., RSI).
- Volume indicators: Track trading activity and confirm moves (e.g., Volume Profile).
- Volatility indicators: Gauge price swings and breakout potential (e.g., Bollinger Bands).
Here’s a quick comparison:
| Type | Core Function | Example | Use Case |
|---|---|---|---|
| Trend | Identify direction | Moving Average | Ride big moves |
| Momentum | Spot strength/weakness | RSI | Time reversals |
| Volume | Confirm participation | Volume Profile | Validate breakouts |
| Volatility | Measure price swings | Bollinger Bands | Anticipate breakouts |
For 2025, building a balanced toolkit—like combining a trend indicator with a momentum tool—gives traders a powerful edge in volatile markets.
Top 10 TradingView Indicators for 2025
Looking to master the markets in 2025? The right trading view indicators can be the difference between consistent wins and frustrating losses. Below, we break down the top 10 must-have indicators for TradingView, highlighting their unique strengths, how they work, and when to use them. Whether you’re a seasoned pro or just starting out, these tools will help you navigate volatility and seize opportunities that others miss.
PipTrend AI Trading Indicator
The PipTrend AI Trading Indicator brings artificial intelligence to the forefront of trading view indicators. It provides real-time buy and sell signals across forex, crypto, stocks, and indices, acting as a personal trading assistant.
Key Features:
- Automatic trend detection for all major asset classes
- Multi-timeframe dashboard for holistic market perspective
- Session liquidity levels and customizable alerts
- Works seamlessly with free TradingView accounts
Benefits:
This tool eliminates guesswork and lag, helping traders act confidently. With lifetime updates, you stay ahead of market shifts. The AI-powered logic and multi-timeframe trend table deliver clarity that’s hard to match among trading view indicators.
Ideal For:
Beginners to intermediates, day and swing traders seeking simplified signals.
Pros:
- Laser-accurate signals
- Universal asset compatibility
- Beginner-friendly onboarding
Cons:
- Subscription required
- No refunds
Example: A swing trader uses the indicator’s dashboard to spot forex reversals during high liquidity sessions, catching moves before the crowd.
Bollinger Bands
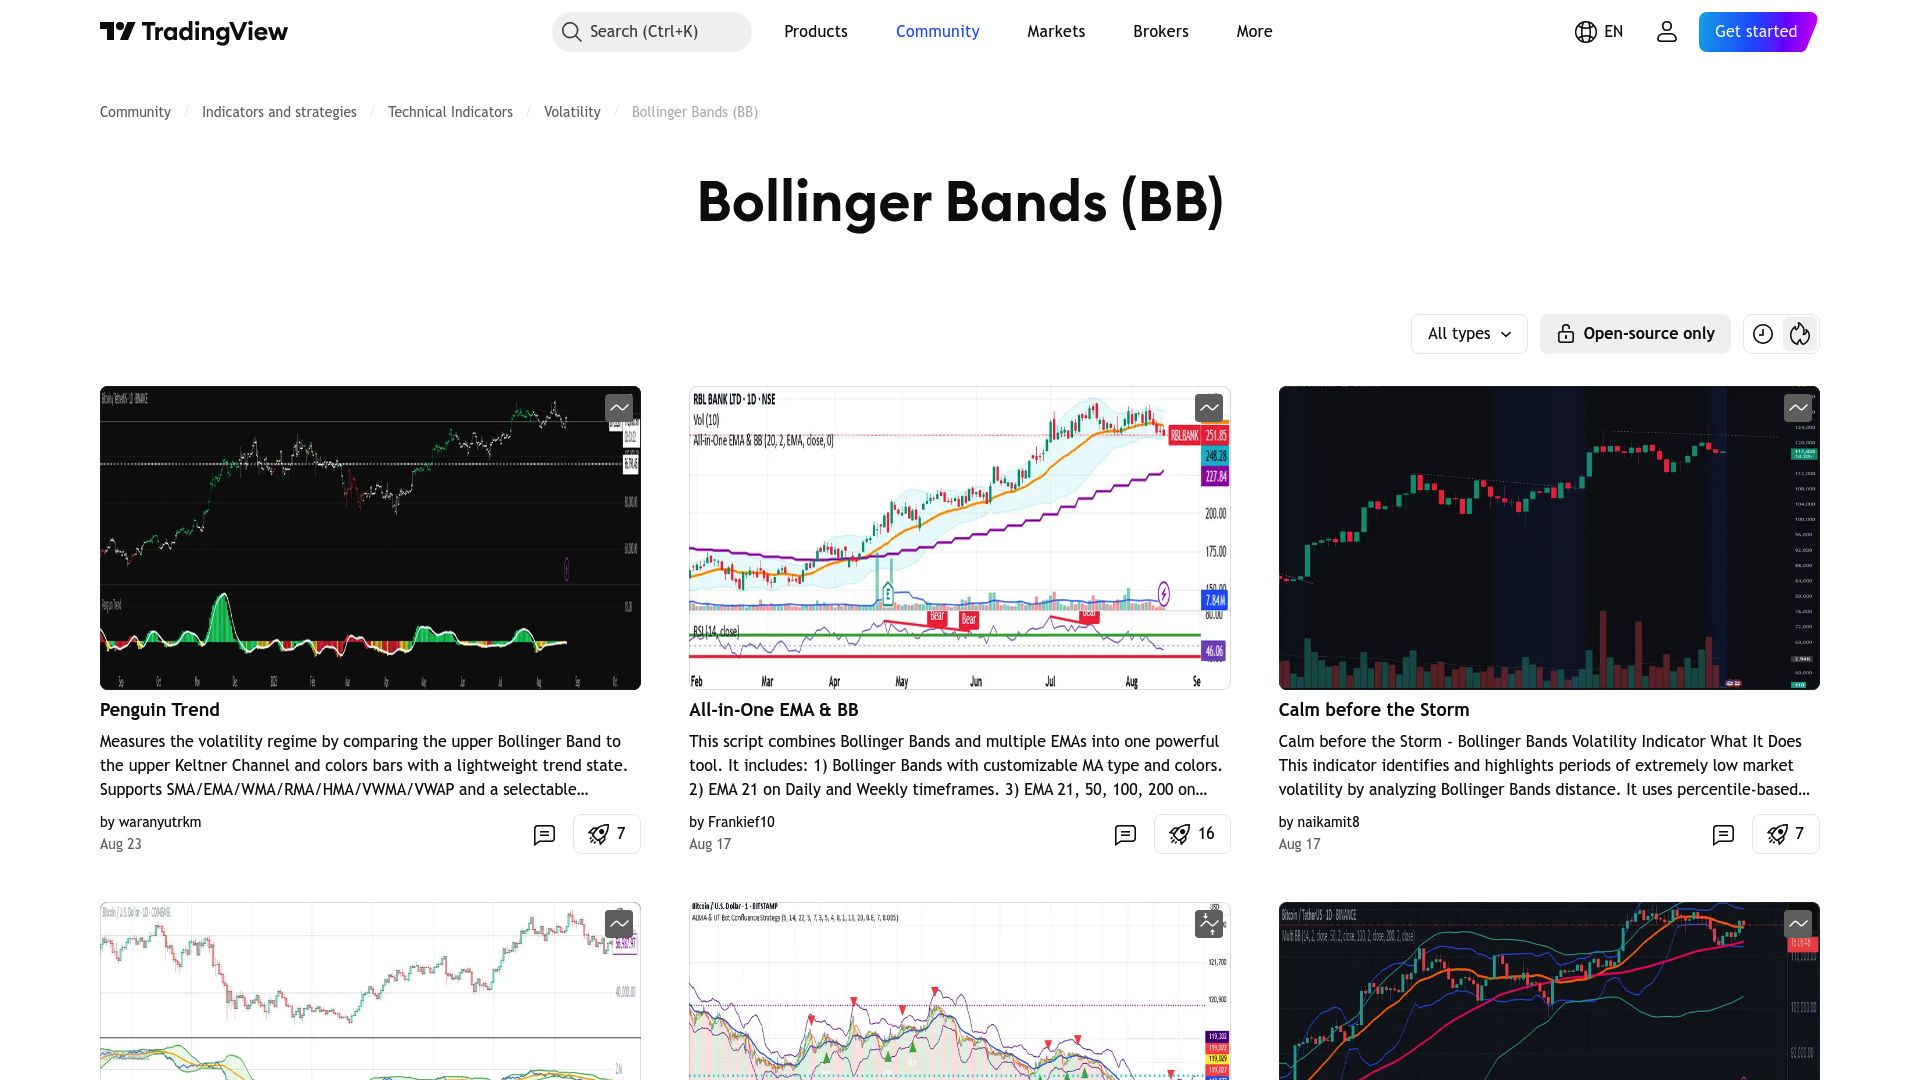
Bollinger Bands are a staple among trading view indicators, visualizing price volatility and trend direction. The bands expand and contract based on market volatility, showing when assets are overbought or oversold.
Core Features:
- Upper, lower, and middle bands adjust dynamically
- Standard deviation calculations
- Overlays for real-time price analysis
Benefits:
Bollinger Bands offer clear signals for potential reversals and support breakout or bounce strategies. They adapt to changing markets, making them essential for volatility-based trading view indicators.
Ideal For:
Swing and breakout traders needing volatility cues.
Pros:
- Simple to interpret
- Flexible in various market conditions
Cons:
- Can create false signals in sideways markets
Example: Crypto traders use the bands to time entries during volatility spikes, maximizing profit potential.
Moving Average Convergence Divergence (MACD)
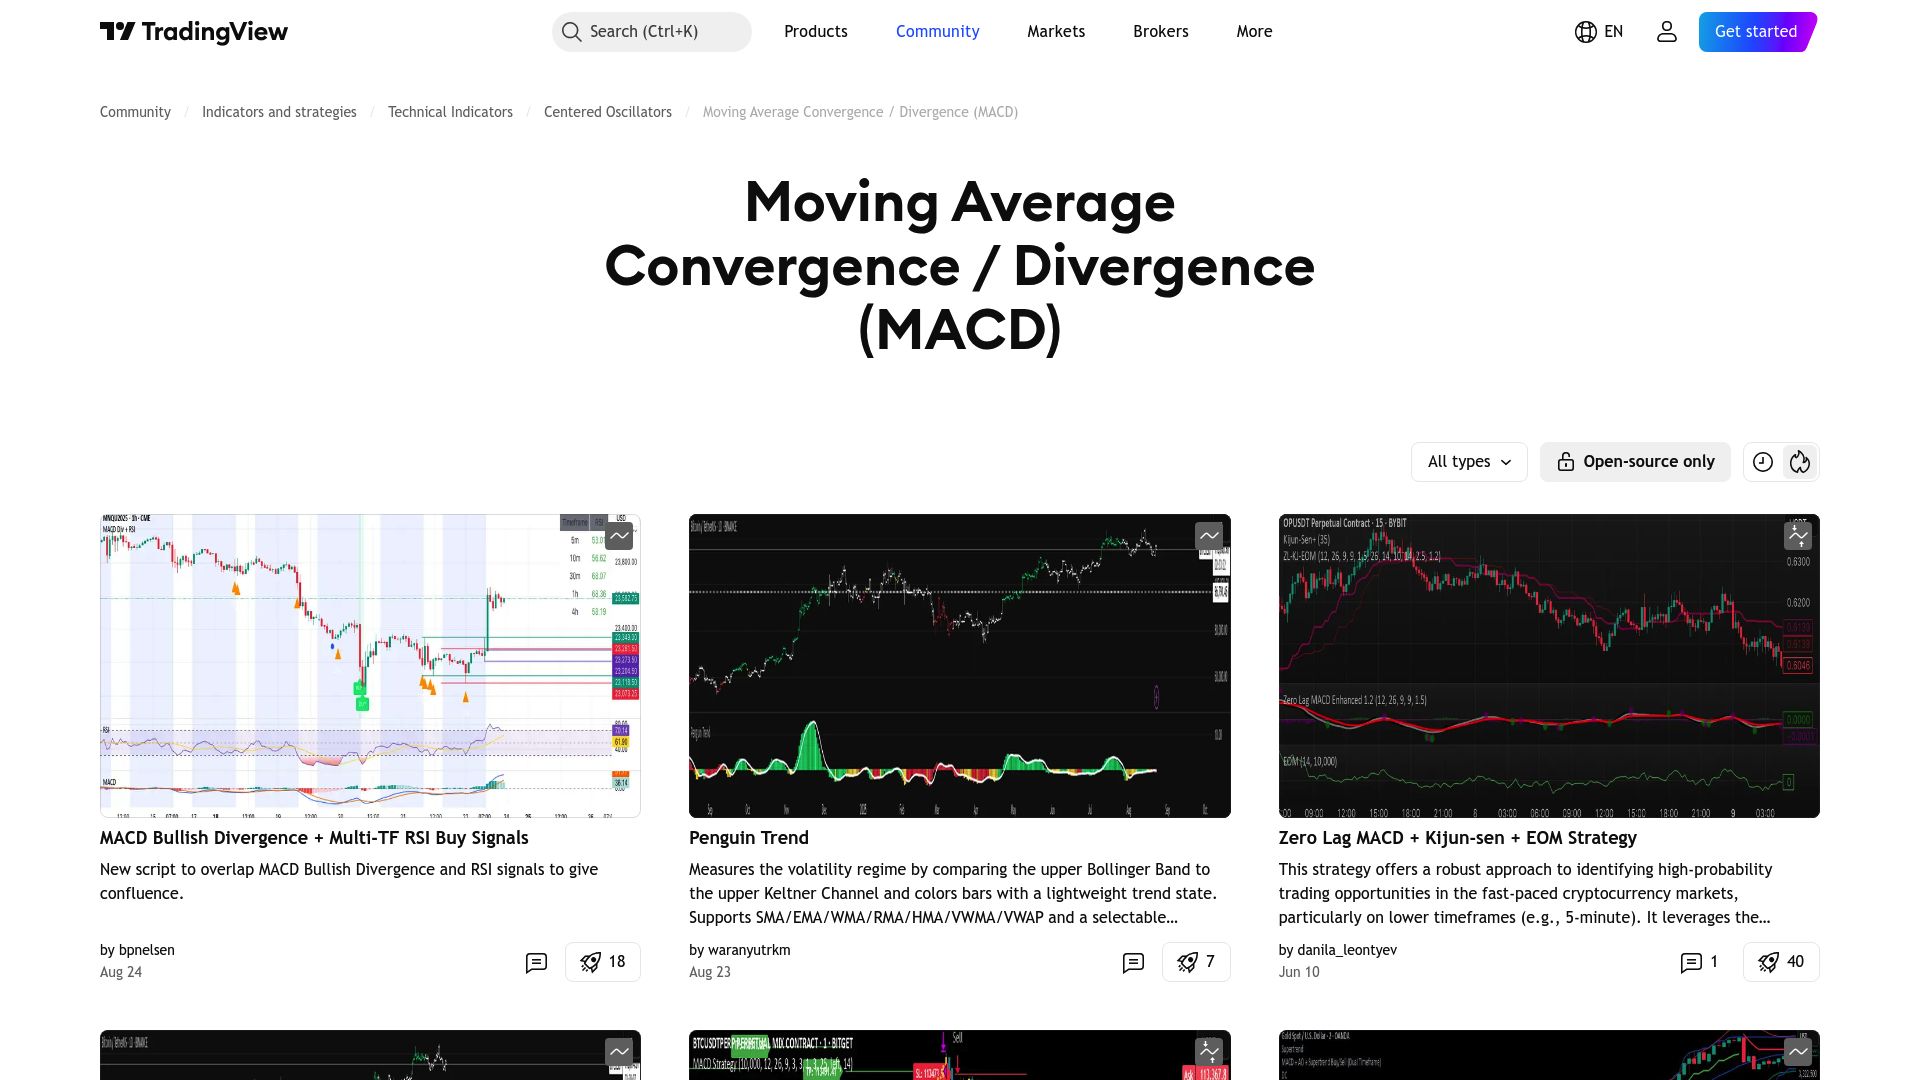
MACD is a dynamic combination of trend and momentum, making it a favorite among trading view indicators. It uses moving averages to generate actionable buy and sell signals.
Core Features:
- MACD line, signal line, and histogram for momentum shifts
- Highlights reversals and divergence
- Works across all timeframes
Benefits:
MACD helps identify trend changes and entry points, supporting a range of trading strategies. Its versatility keeps it at the top of trading view indicators lists.
Ideal For:
Stocks, indices, forex—any asset where trends matter.
Pros:
- Versatile and reliable
- Effective confirmation tool
Cons:
- Can lag in fast-moving markets
Example: Traders confirm S&P 500 trend changes by analyzing MACD crossovers on daily charts.
Stochastic Oscillator
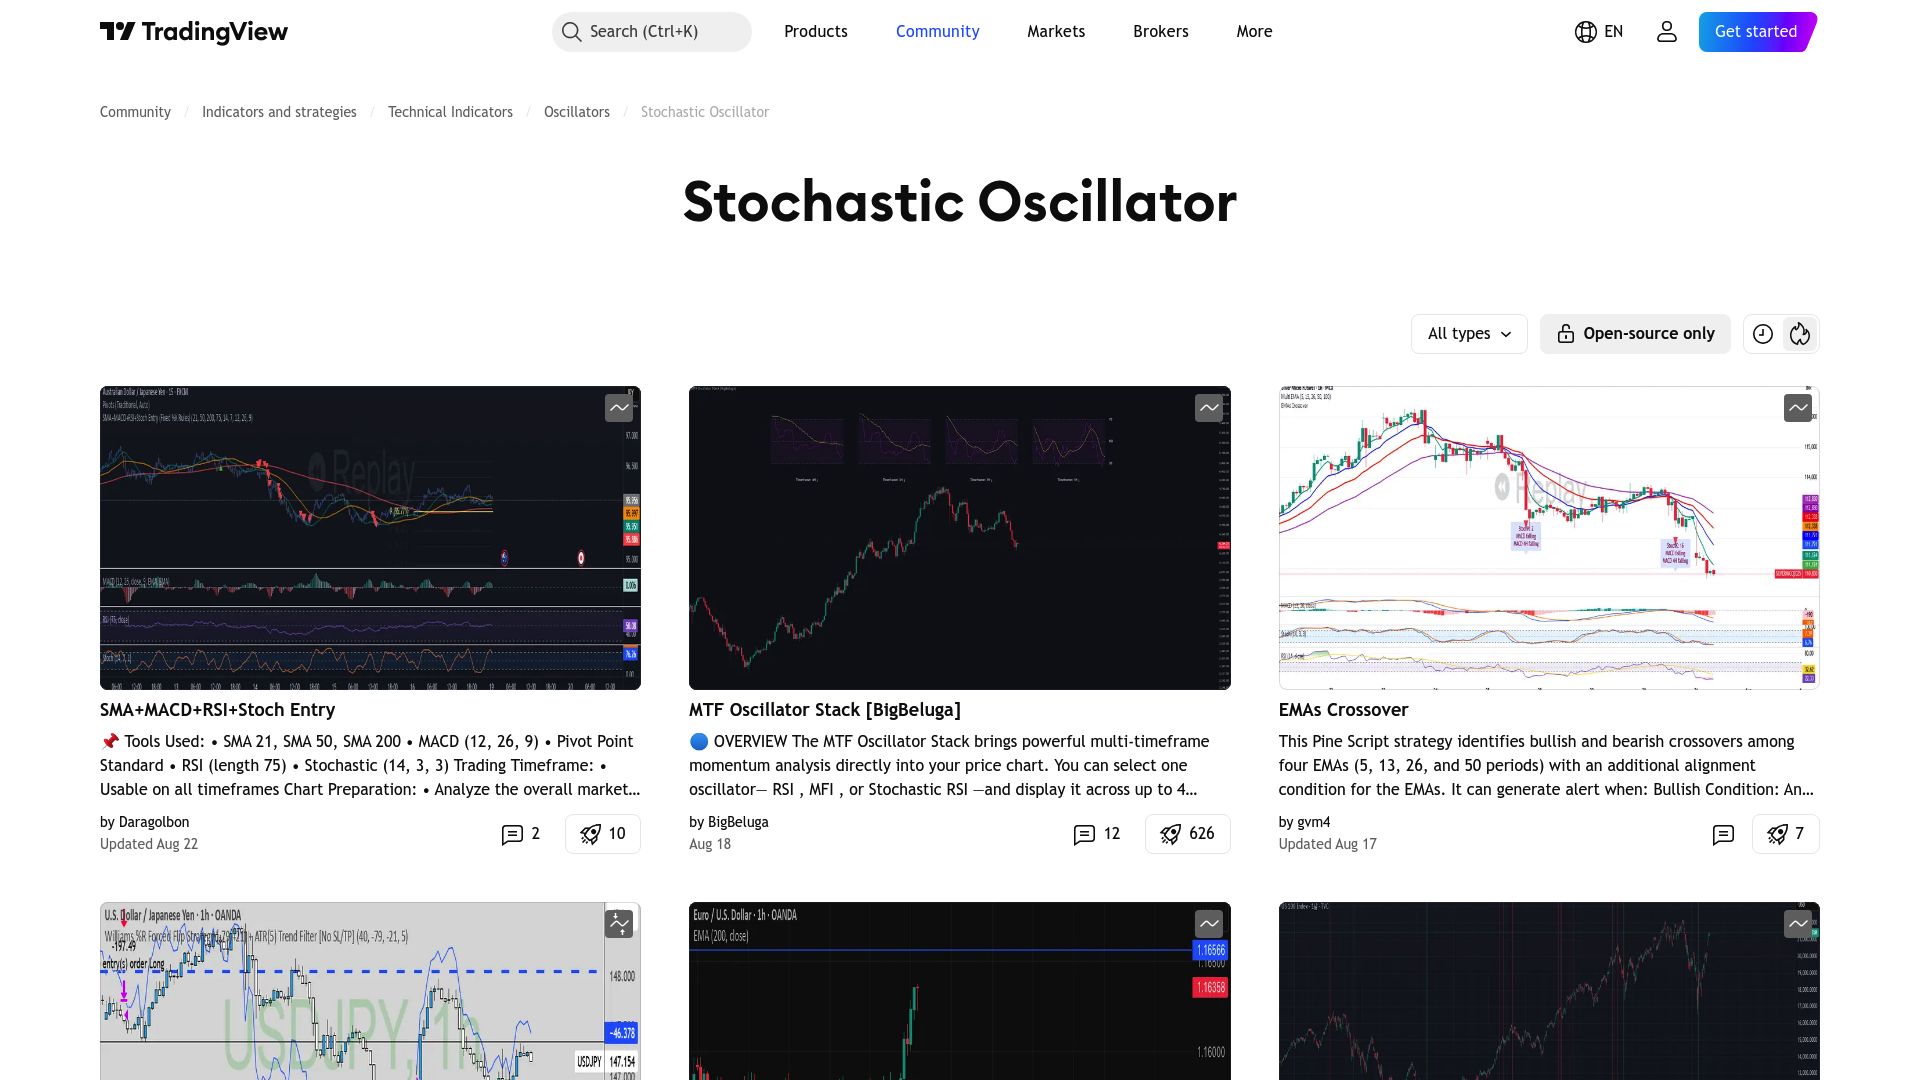
The Stochastic Oscillator measures momentum by comparing closing prices to recent ranges, making it a key player among trading view indicators for spotting reversals.
Core Features:
- %K and %D lines for signal clarity
- Overbought (above 80) and oversold (below 20) zones
- Quick visual cues for market turns
Benefits:
It’s highly effective in ranging markets, helping traders catch short-term reversals. The simplicity of signals makes this a favorite for many who rely on trading view indicators.
Ideal For:
Forex and crypto traders seeking timely reversal signals.
Pros:
- Easy to use
- Effective in range-bound markets
Cons:
- Less reliable during strong trends
Example: EUR/USD traders spot bullish divergences for quick intraday trades.
Fibonacci Retracement
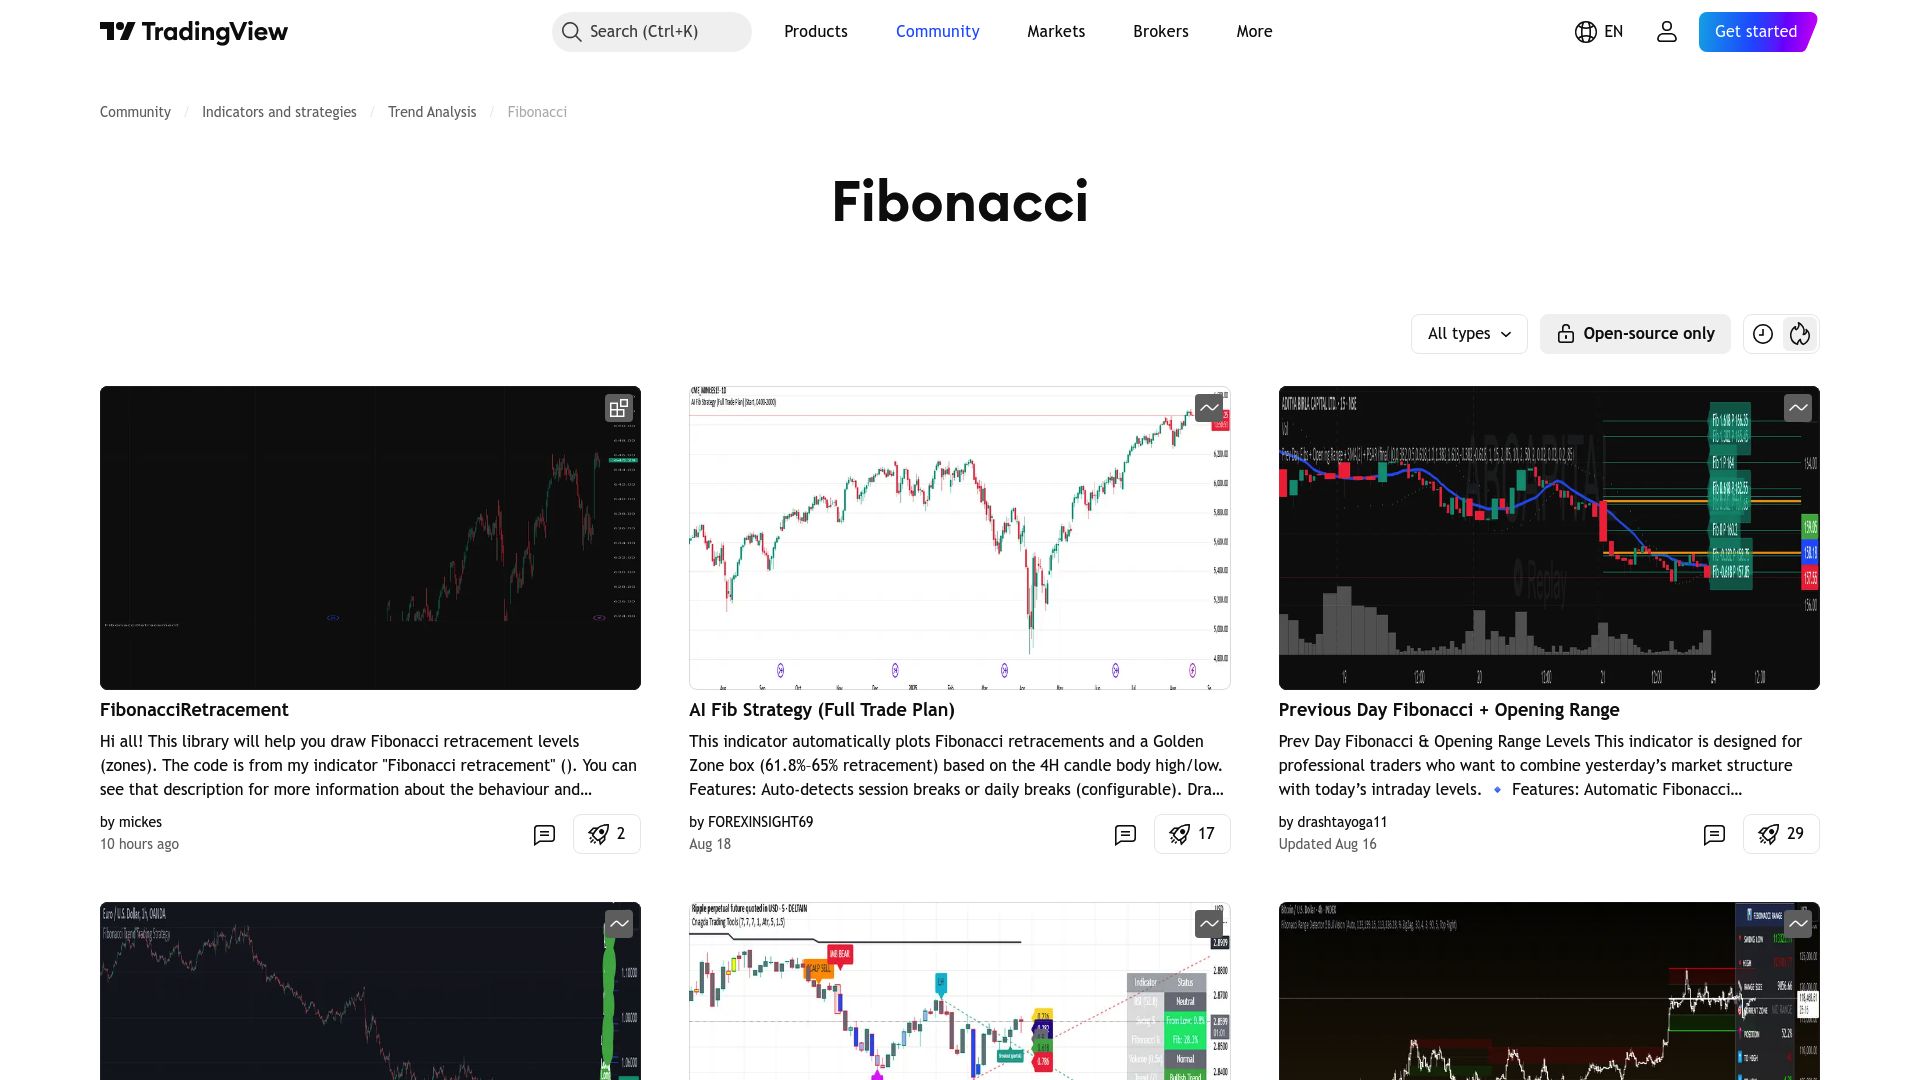
Fibonacci Retracement is one of the most respected trading view indicators for mapping out support and resistance levels based on mathematical ratios.
Core Features:
- Auto-plots key Fibonacci levels (23.6%, 38.2%, 61.8%, etc.)
- Customizable anchor points for precise analysis
Benefits:
It helps traders pinpoint reversal zones, manage stop-losses, and set profit targets. For many, it’s the backbone of technical setups involving trading view indicators.
Ideal For:
Swing traders, technical analysts, and trend followers.
Pros:
- Universally respected
- Works on all timeframes
Cons:
- Anchor point selection can be subjective
Example: Gold traders use Fibonacci levels to anticipate pullbacks during market corrections.
Relative Strength Index (RSI)
RSI is a momentum oscillator that measures the speed and change of price movements. It’s one of the most widely used trading view indicators for identifying overbought and oversold conditions.
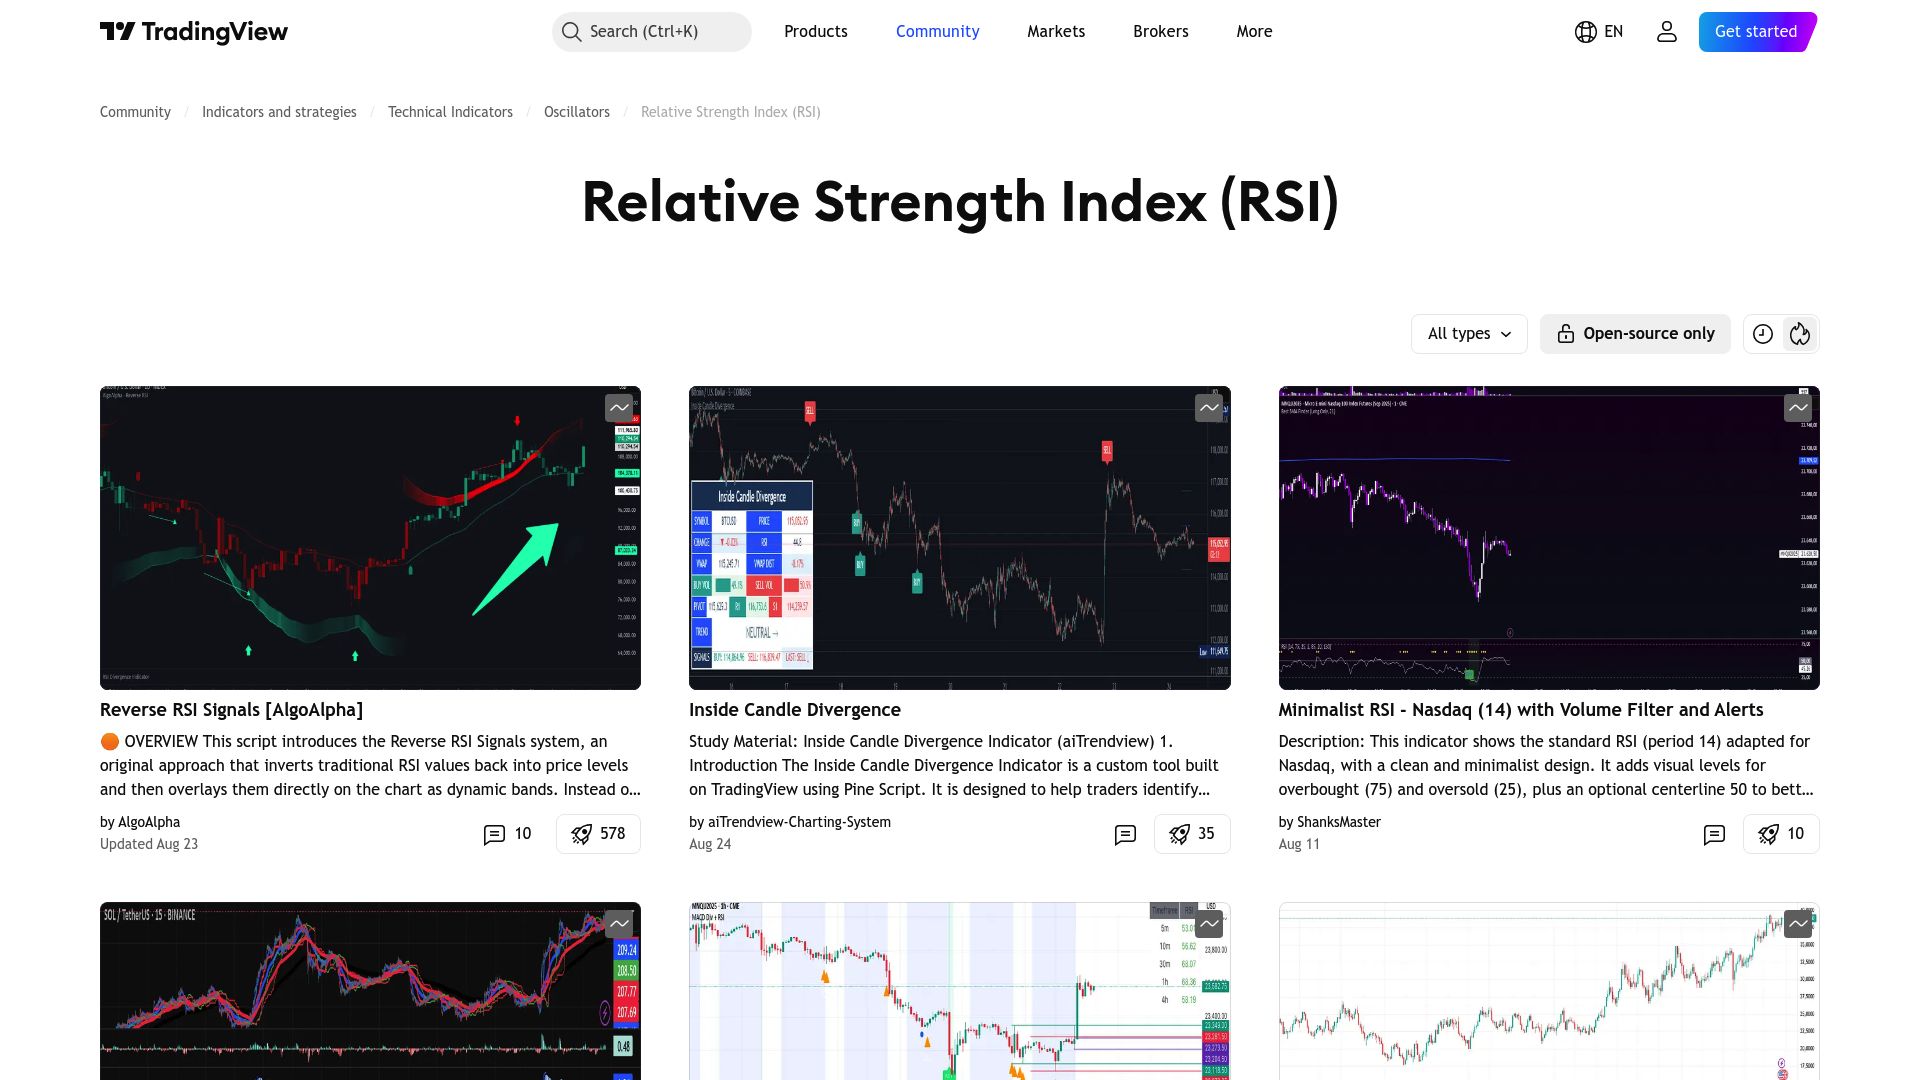
Core Features:
- 0–100 scale for clear visual signals
- Overbought (above 70) and oversold (below 30) alerts
- Detects bullish and bearish divergences
Benefits:
RSI offers easy entry and exit cues, helping traders avoid buying into strength or selling into weakness. Its clarity keeps it at the forefront of trading view indicators.
Ideal For:
All traders, especially those timing reversals.
Pros:
- Simple setup
- Quick confirmation
Cons:
- Can give false signals in trending markets
Example: Stock traders buy oversold equities during market dips, guided by RSI signals.
Volume Profile
Volume Profile is a powerful visualization tool among trading view indicators, showing traded volume at each price level as a horizontal histogram.
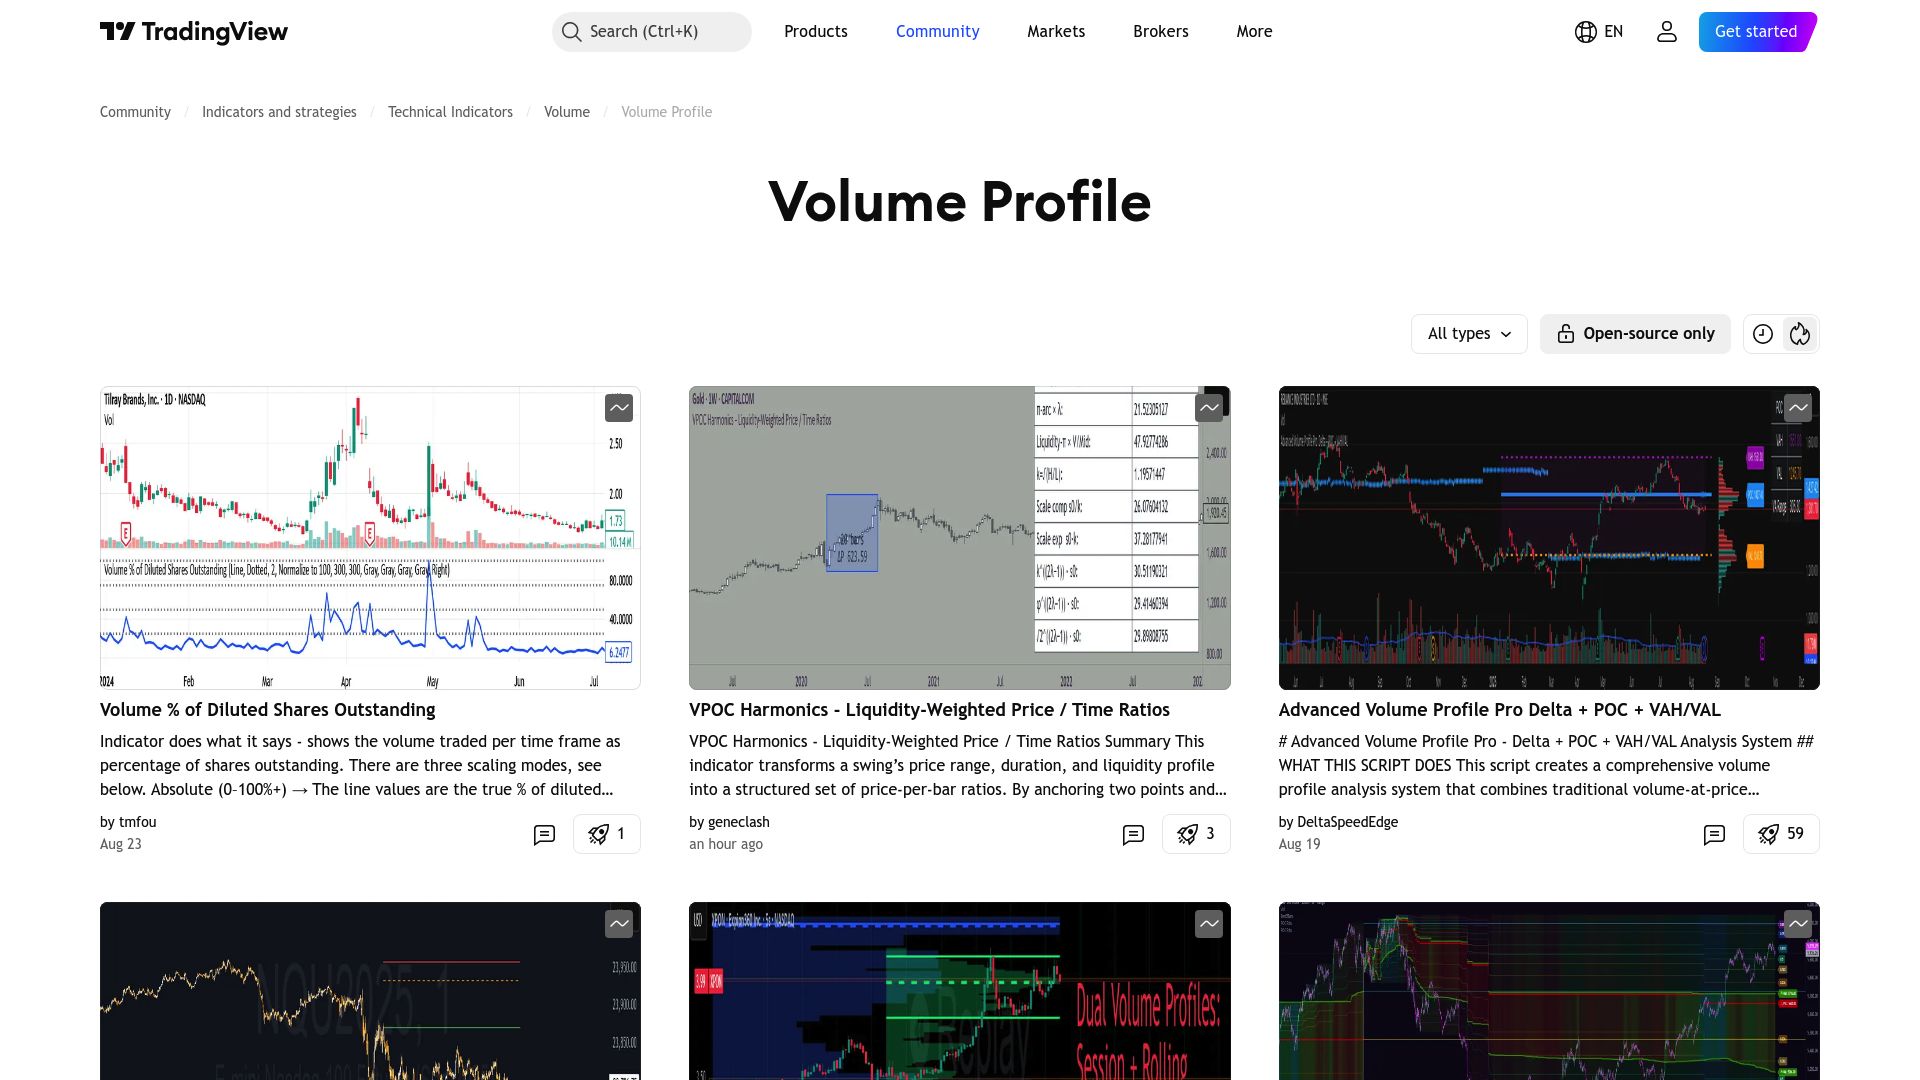
Core Features:
- Highlights value area and point of control
- Reveals high-activity price zones
- Not dependent on time, only price
Benefits:
It helps traders identify support and resistance, validate breakouts, and confirm trends. Volume Profile stands out among trading view indicators for its depth of market insight.
Ideal For:
Day traders, scalpers, and institutional players.
Pros:
- Granular insight
- Confirms accumulation/distribution
Cons:
- Can be complex for beginners
Example: Bitcoin traders spot accumulation phases before major breakouts using Volume Profile.
Simple/Exponential Moving Average (SMA/EMA)
SMA and EMA smooth price data to reveal trends, making them foundational trading view indicators. EMA responds faster to price changes, while SMA provides steady trend analysis.
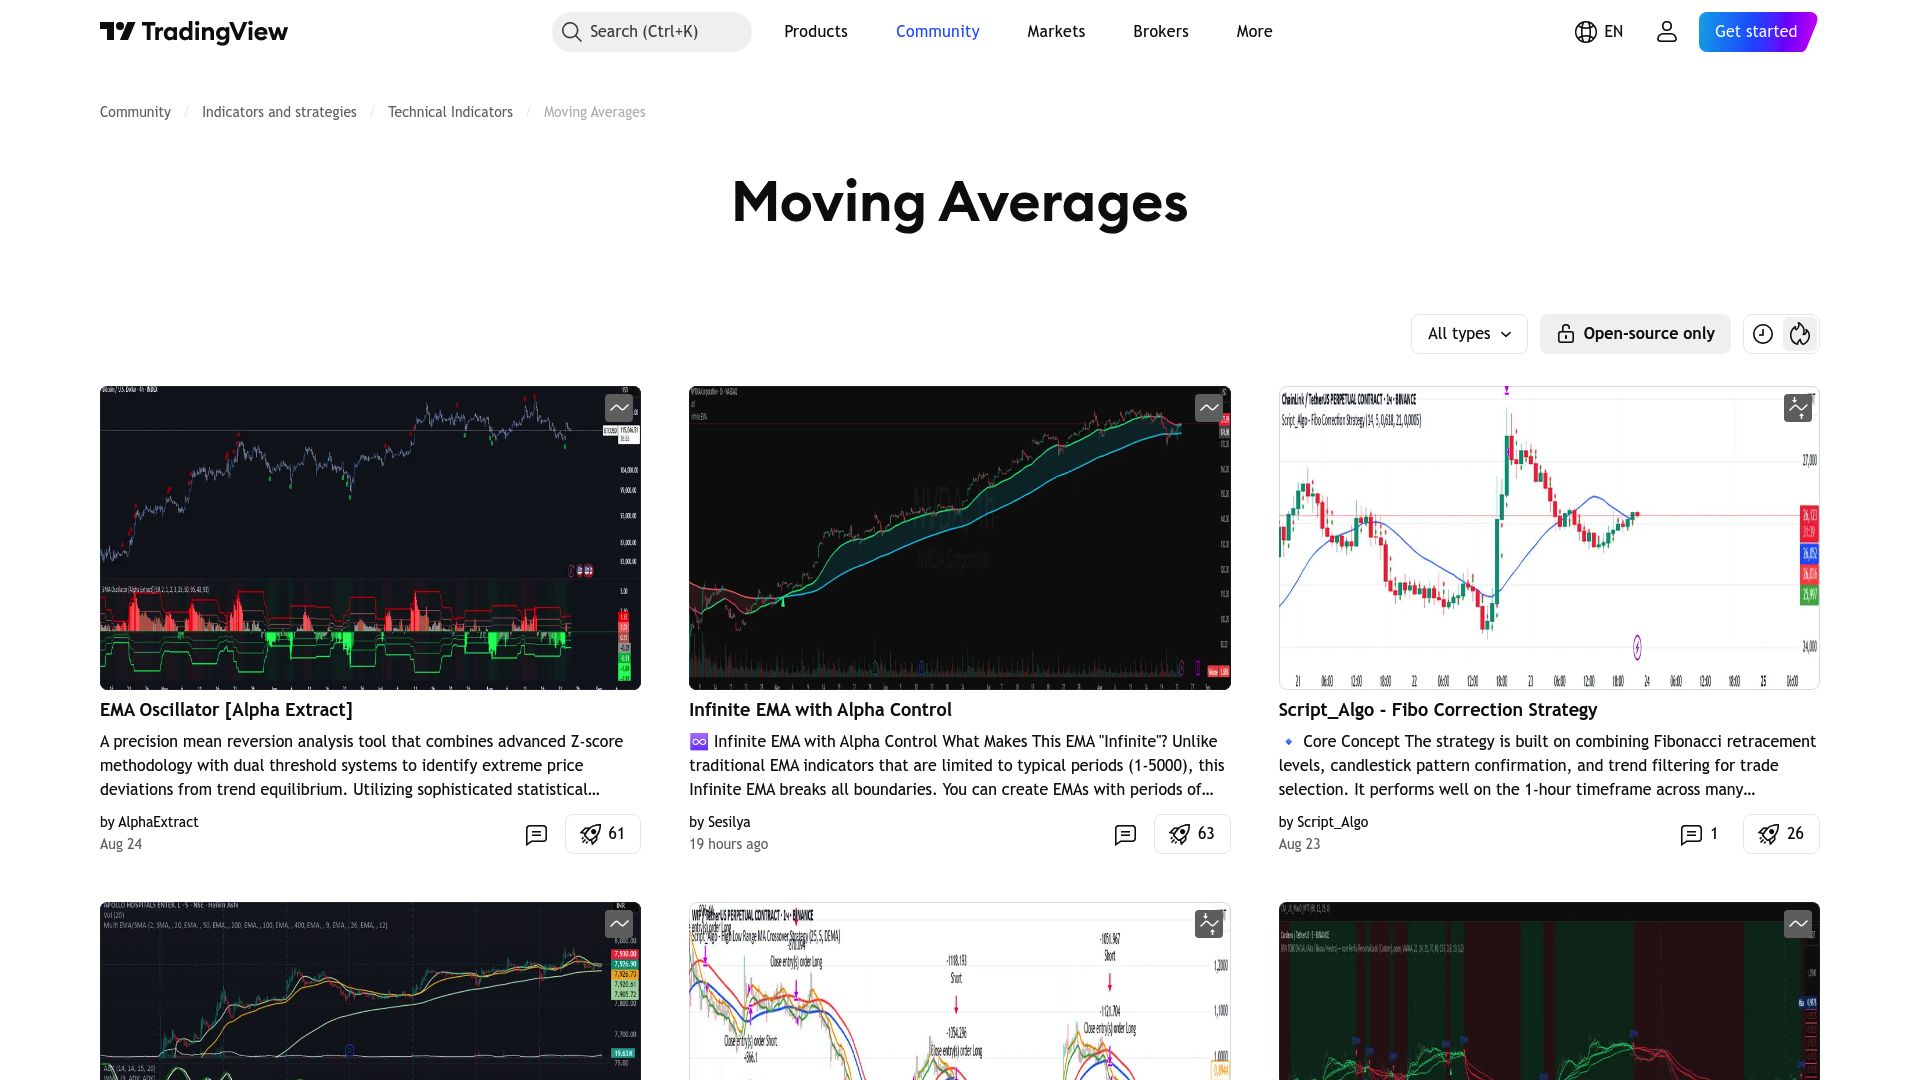
Core Features:
- Customizable periods
- Overlays directly on price charts
Benefits:
They help identify trend direction and dynamic support or resistance. Many traders combine them with other trading view indicators for confirmation.
Ideal For:
Trend followers, long-term investors, and scalpers.
Pros:
- Reduces market noise
- Easy to interpret
Cons:
- Lagging in fast markets
Example: The 200-period EMA often acts as support during bull runs on the S&P 500.
On-Balance Volume (OBV)
OBV is a volume-based indicator that tracks buying and selling pressure by adding or subtracting volume based on price direction. It’s a staple among trading view indicators for volume confirmation.
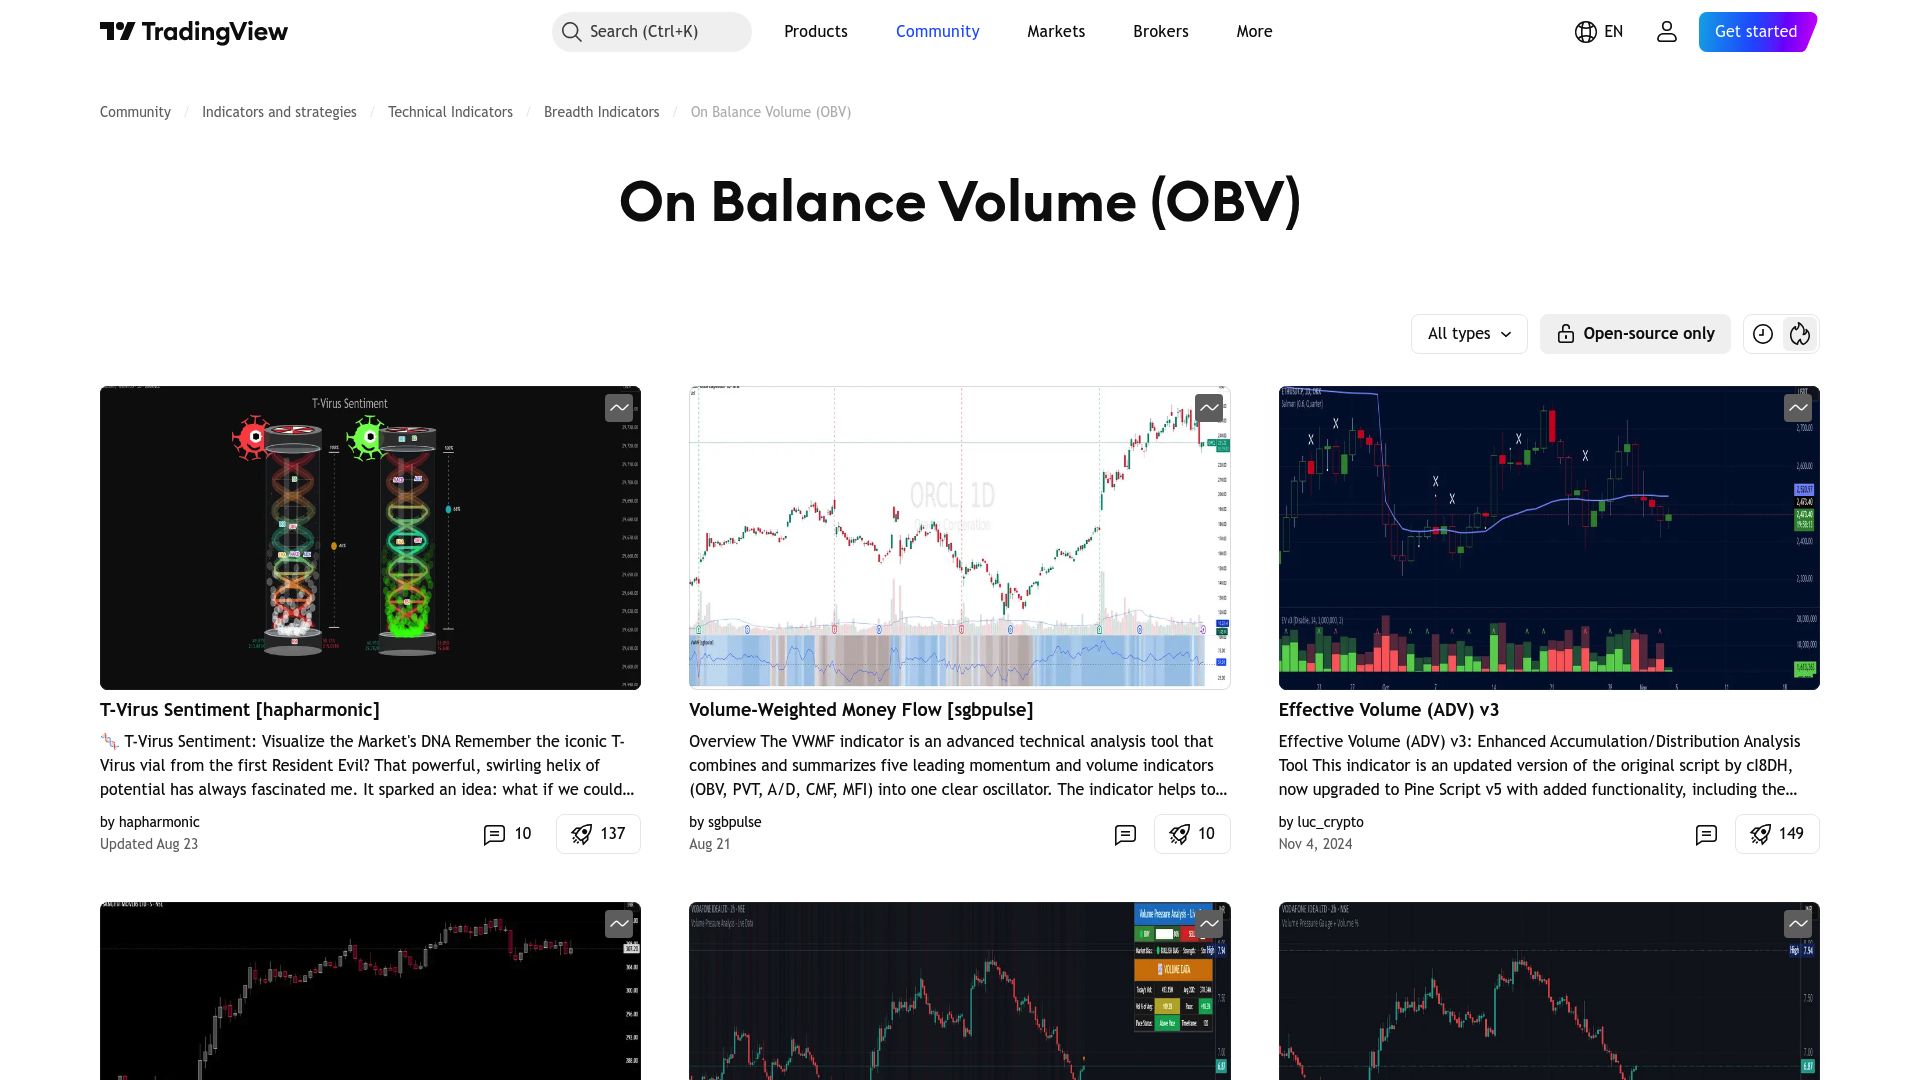
Core Features:
- Cumulative volume tracking
- Visual trend confirmation
Benefits:
OBV confirms price moves and detects accumulation or distribution phases. It’s a simple yet powerful addition to any trading view indicators toolkit.
Ideal For:
Traders validating breakouts and trend strength.
Pros:
- Straightforward calculation
- Effective for volume analysis
Cons:
- Less reliable in low-volume markets
Example: Tech stock traders use OBV to confirm bullish breakouts during earnings season.
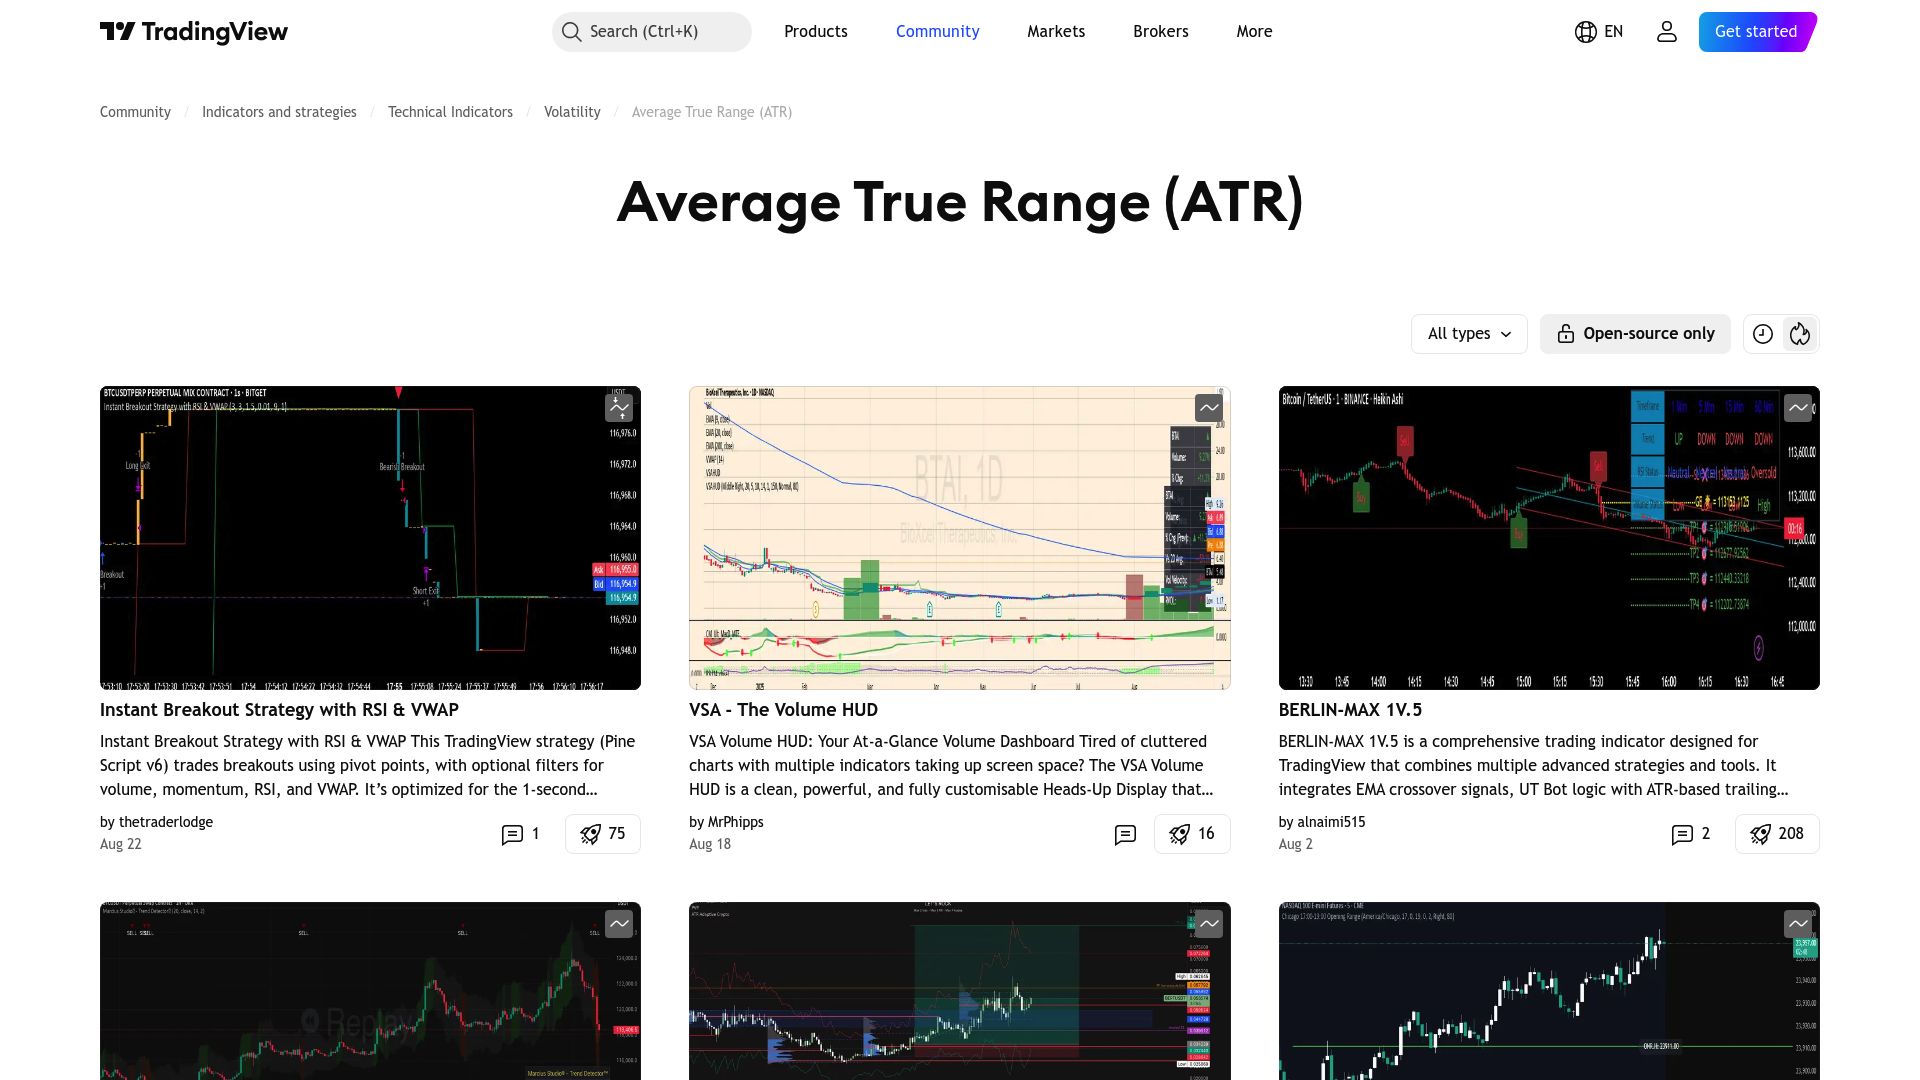
Average True Range (ATR)
ATR measures market volatility by averaging the range between high and low prices. It’s a must-have for risk management among trading view indicators.
Core Features:
- Line or histogram overlays
- Adjustable calculation period
Benefits:
ATR helps set stop-loss levels and adapt position sizing to volatility. It’s a key component for traders who use trading view indicators to manage risk.
Ideal For:
All markets—especially volatile assets.
Pros:
- Works everywhere
- Enhances risk control
Cons:
- Does not indicate trend direction
Example: Forex traders use ATR to set dynamic trailing stops in fast-moving pairs.
Want to explore more about these trading view indicators or discover advanced strategies? Check out this Best TradingView Indicators Guide for in-depth analysis, tips, and expert recommendations.
How to Combine Indicators for Maximum Edge in 2025
In the fast-paced world of trading, synergy is your secret weapon. The real edge with trading view indicators comes from combining them for smarter, more reliable signals. Instead of relying on a single tool, top traders carefully select a toolkit that covers all angles—trend, momentum, and volume.
Building a Winning Indicator Toolkit
A well-built toolkit starts with a balanced mix of trading view indicators. For example, you might use the EMA to spot the overall trend, RSI to gauge momentum, and Volume Profile to confirm price action. This combination helps filter out noise and false signals.
| Indicator Type | Example | Core Benefit |
|---|---|---|
| Trend | EMA | Direction confirmation |
| Momentum | RSI | Entry/exit signals |
| Volume | Volume Profile | Validation of moves |
Many pros use at least two indicators for every trade. Yet, “indicator overload” is a real risk. Start simple with two or three, then refine as you gain experience with trading view indicators.
Multi-Timeframe Analysis for Smarter Trades
Multi-timeframe analysis is a powerful way to filter out bad trades. By checking trading view indicators across several timeframes, you align your entries with the bigger trend. For instance, you might only take a 1H chart buy if the daily chart is bullish too.
TradingView makes this easy with built-in multi-timeframe support. This approach is a top trend among leading traders in 2025. Want to dive deeper? Explore Multi-Timeframe Trading Strategies for actionable methods using your favorite trading view indicators.
Customization and Alerts: Staying Ahead of the Market
Staying competitive means reacting quickly. Set up custom alerts for your trading view indicators so you never miss a trade—even while away from your screen. Mobile notifications for RSI crossing 30 or a MACD bullish crossover keep you in the loop.
Customizing indicator parameters to match your style is key. Over 80% of TradingView users say the alert system gives them an edge. With a personalized approach to trading view indicators, you’re always ready for whatever 2025’s markets throw your way.
If you’re ready to put these top TradingView indicators to work and really sharpen your edge in 2025, why not start with a tool that brings it all together? PipTrend uses AI to deliver real-time, crystal-clear buy and sell signals—no more second-guessing or missing out on trades because you’re overwhelmed by too many charts. Whether you’re trading forex, crypto, stocks, or indices, you’ll love how simple and powerful trading can feel with the right tools in your corner. Ready to level up your strategy? START USING PIPTREND