
Retail trading is booming, with more people than ever diving into the markets. The S&P 500 stands out as the gold standard for tracking the US stock market’s performance, attracting both new and experienced traders.
TradingView has emerged as the preferred charting platform for analyzing the S&P 500. Its intuitive design and powerful features make it accessible whether you’re just starting or already have some experience.
Learning how to use s&p 500 tradingview can open up a world of opportunities—even if you’re a complete beginner. With the right approach, you can quickly build skills and confidence.
This guide walks you through everything you need to know: S&P 500 basics, TradingView essentials, workspace setup, beginner-friendly strategies, risk management, and practical tips. Let’s get started on your path to trading success.
Understanding the S&P 500: What Every Beginner Needs to Know
The S&P 500 is at the heart of US financial markets. If you want to take your first steps in s&p 500 tradingview, understanding the basics of this index is essential. Let’s break down what makes the S&P 500 unique, why it’s so popular among traders, and how its movements create opportunities for everyone from beginners to pros.
What is the S&P 500?
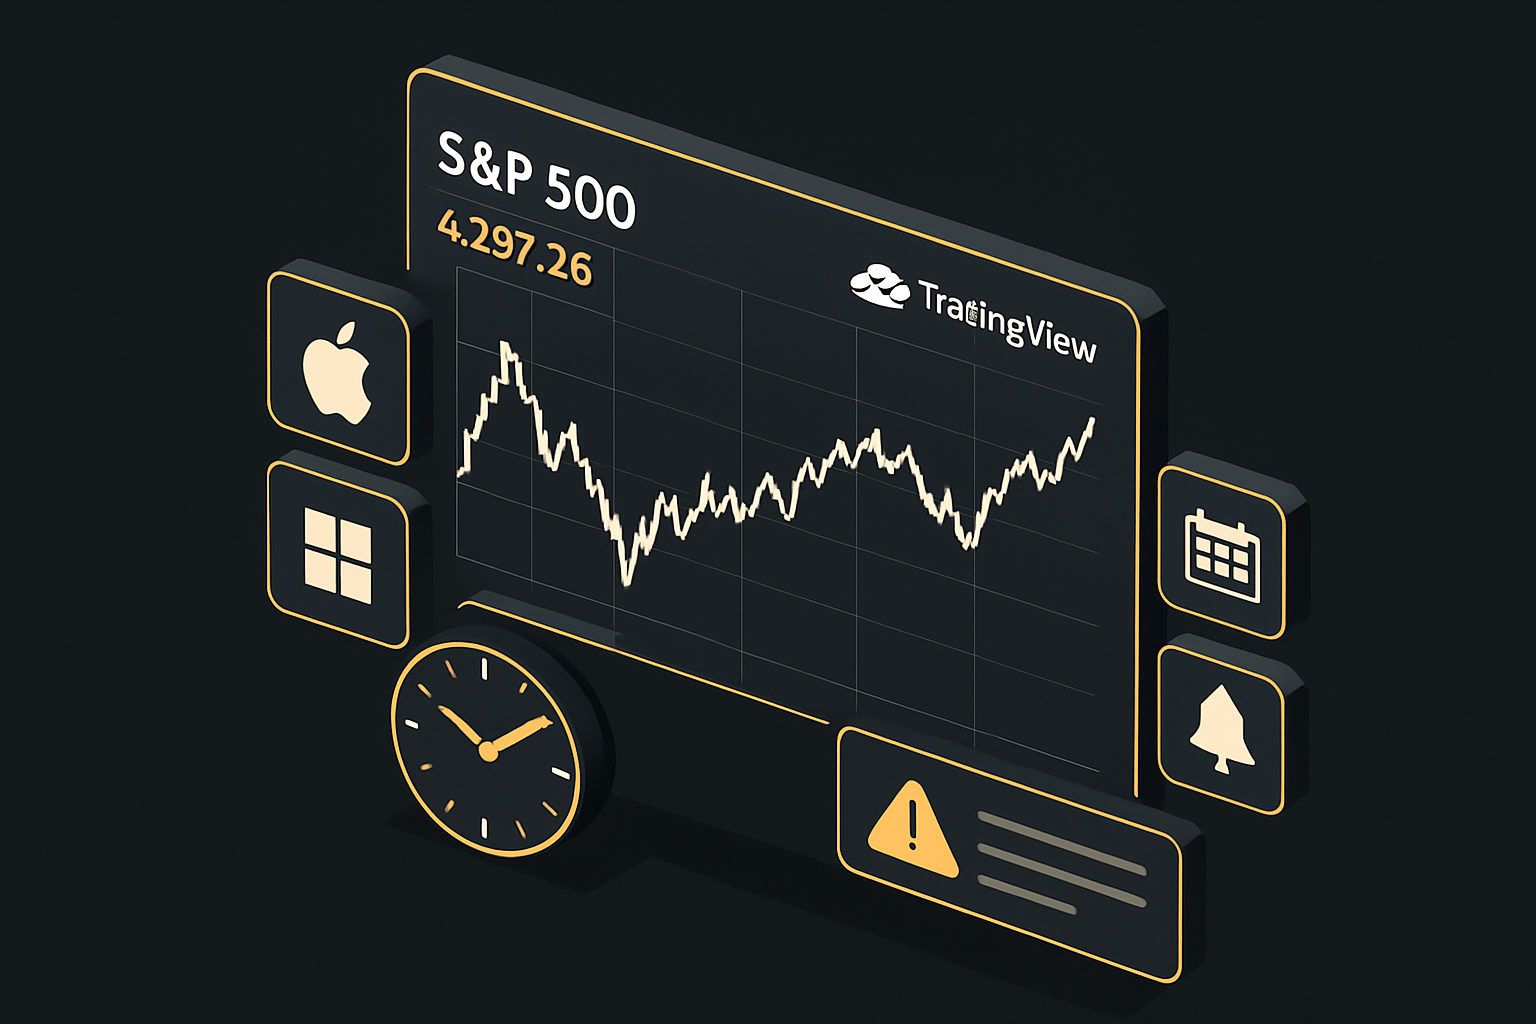
The S&P 500, short for Standard & Poor’s 500, is a stock market index tracking the performance of 500 of the largest publicly traded US companies. Launched in 1957, it has grown into the primary benchmark for US equities.
This index covers influential companies like Apple, Microsoft, and Amazon. Their price movements can significantly sway the entire index. The S&P 500’s broad coverage gives a reliable snapshot of the US stock market’s health.
Because it represents so many sectors, traders on s&p 500 tradingview use it to gauge overall market sentiment. Its reputation for stability and historical growth make it a favorite among investors and analysts alike.
Why Trade the S&P 500?
One major reason traders flock to the S&P 500 is liquidity. With millions of shares traded daily, spreads are tight, making it cost-effective to trade. The index also closely mirrors broader economic trends, so its movement often signals shifts in the overall market.
Retail traders can access the S&P 500 through popular CFDs, futures contracts, or ETFs. The SPY ETF is especially well-known, trading over 85 million shares daily in 2023. For a deeper dive into ETF options like SPY, IVV, and VOO, check out S&P 500 ETFs: 7 Ways to Play the Index.
Using s&p 500 tradingview, you can easily monitor these instruments and spot opportunities as they arise, whether you prefer short-term trades or longer-term investing.
S&P 500 Market Hours, Volatility, and Key Events
Knowing when the S&P 500 is most active is crucial for traders. The main market operates from 9:30 AM to 4:00 PM ET, but pre-market and after-hours sessions offer additional opportunities. Volatility often spikes during major economic releases like CPI, NFP reports, and Federal Reserve meetings.
Quarterly earnings seasons can lead to sharp moves in the index, especially when big tech companies report. The average daily move for the S&P 500 in 2023 was 1.2%, giving plenty of room for savvy s&p 500 tradingview users to capitalize on price swings.
By tracking key events and market hours, beginners can time their trades for when the action is hottest.
Core Factors That Move the S&P 500
Several main drivers influence S&P 500 price action. Macroeconomic indicators such as interest rates, inflation, and GDP set the broader tone. Company earnings and sector rotations can shift momentum within the index, while geopolitical events and overall market sentiment add another layer of complexity.
For example, the S&P 500 saw notable reactions to Federal Reserve rate hikes in 2023, creating both risks and opportunities for traders. News events can spark sudden volatility, and s&p 500 tradingview makes it easier for beginners to spot and respond to these shifts.
By understanding these core factors, you’ll be better prepared to analyze and trade the S&P 500 with confidence.
Getting Started with TradingView for S&P 500 Analysis
Getting started with s&p 500 tradingview is easier than most beginners expect. The platform is designed to be user-friendly, making it simple to access powerful tools for analyzing and trading the S&P 500. In this section, you’ll learn how to set up your account, navigate the interface, use essential charting tools, save layouts, set alerts, and leverage TradingView’s vibrant community.
Setting Up a Free TradingView Account
To begin your s&p 500 tradingview journey, head to TradingView’s website and click “Sign Up.” You can register using email, Google, or social accounts. After verifying your email, you’ll access the free plan, which offers robust charting tools for S&P 500 analysis.
Compare the free plan with Pro, Pro+, and Premium options—higher tiers offer more indicators and alerts. Free users can add up to three indicators per chart and set one alert at a time. For a detailed walkthrough, check out this Free TradingView account setup guide. Starting with a free account is perfect for testing features before upgrading.
Navigating the TradingView Interface
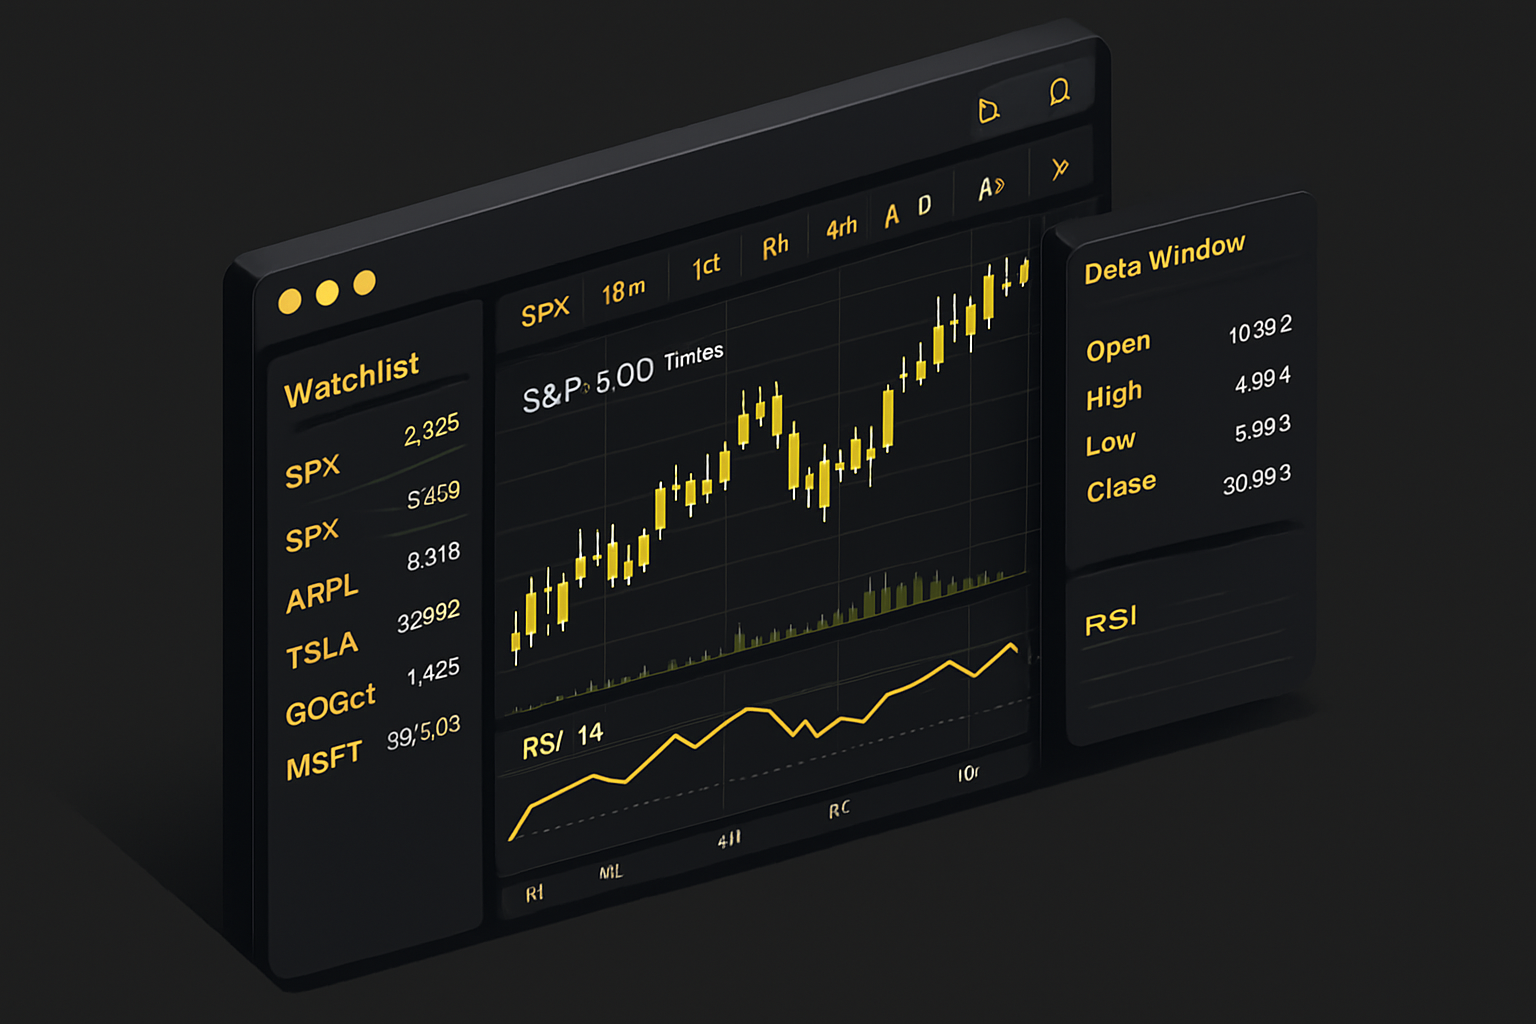
Once inside s&p 500 tradingview, you’ll see the main dashboard. The chart area dominates the center, while the left toolbar provides drawing tools. On the right, you’ll find your watchlist and alerts panel.
Searching for S&P 500 symbols is straightforward—type “SPX,” “SPY,” or “ES1!” into the symbol search bar. Add them to your watchlist for instant access. You can customize your workspace by rearranging windows, resizing panels, and saving your preferred layout for efficient S&P 500 analysis.
Essential Charting Tools & Features for Beginners
With s&p 500 tradingview, beginners can easily switch between timeframes, such as 5-minute, daily, or weekly charts. Use drawing tools like trendlines, support/resistance levels, and Fibonacci retracements to mark up your S&P 500 charts.
Popular indicators include Moving Averages, RSI, MACD, and Volume. To add an indicator, click the “Indicators” button and search by name. Customize settings for each indicator to fit your trading style. This flexibility helps you make informed decisions when analyzing S&P 500 price action.
Saving Layouts and Setting Alerts
A key feature of s&p 500 tradingview is the ability to save custom chart layouts. Click “Save Layout” at the top to preserve your settings and drawings. Loading saved layouts lets you quickly resume analysis without losing your customizations.
Setting alerts is equally simple. Right-click on the chart or indicator and select “Add Alert.” For example, set an alert for SPY crossing a key price level or when RSI hits overbought. Alerts can be delivered via email, SMS, or app notifications—keeping you informed of S&P 500 moves, whether you’re trading actively or holding positions.
Integrating Community Ideas and Scripts
The s&p 500 tradingview community is a goldmine for new traders. Browse public scripts and trading ideas shared by experienced members. Access these through the “Ideas” and “Scripts” tabs on your dashboard.
Before using a script, check ratings, comments, and author reputation. For example, try a popular S&P 500 volatility indicator and see how it fits your strategy. Engaging with top-rated contributors helps you learn faster, avoid common pitfalls, and discover creative approaches to S&P 500 trading.
Building Your S&P 500 Trading Workspace on TradingView
Creating an effective S&P 500 TradingView workspace is essential for both new and seasoned traders. A well-organized layout streamlines analysis, speeds up decision-making, and helps you focus on the most important signals in the fast-moving S&P 500 market.
Customizing Your Chart Layout
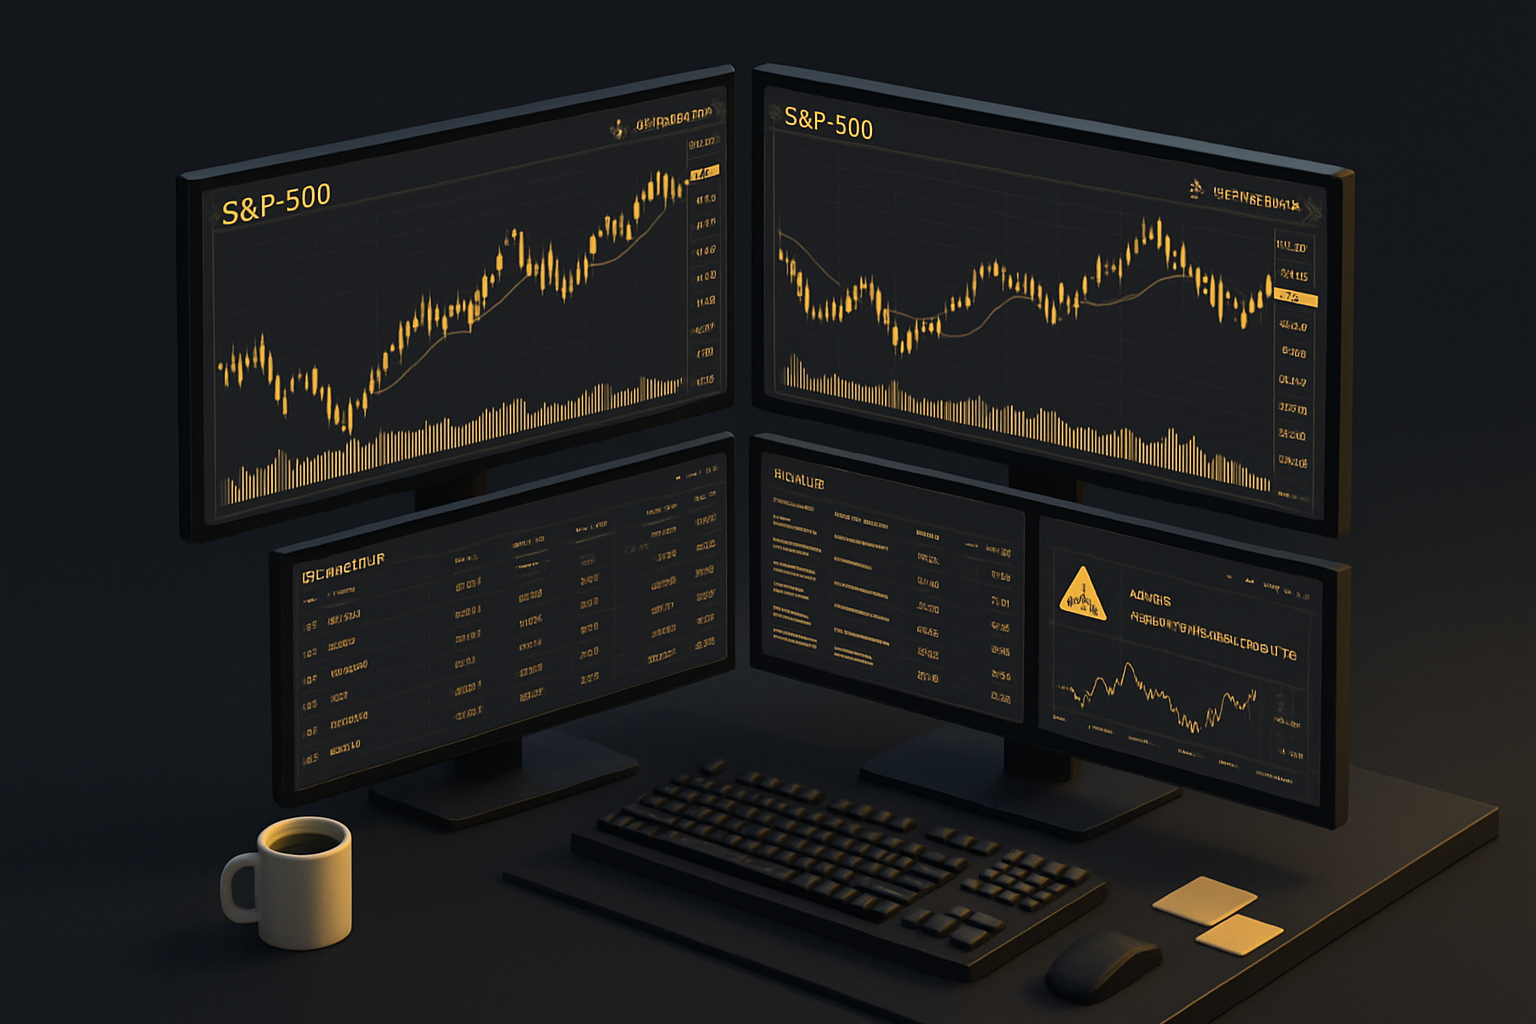
A customized chart layout is the foundation of your S&P 500 TradingView experience. Start by opening several chart windows to compare multiple timeframes—daily, hourly, and 5-minute charts side by side. This approach helps you spot trends and reversals faster.
Organize your watchlists by grouping S&P 500 stocks, ETFs like SPY, and futures such as ES1!. Give your workspace a unique name, making it easy to load whenever you log in.
- Use a clutter-free layout to reduce distractions.
- Keep only the essential tools visible.
- Arrange charts for quick comparison.
A focused s&p 500 tradingview workspace ensures you never miss important market moves while maintaining clarity amid market noise.
Selecting the Right Indicators for S&P 500 Trading
Choosing the best indicators is crucial for effective S&P 500 TradingView analysis. Most traders combine trend-following tools like moving averages with momentum indicators such as RSI.
| Indicator | Purpose | Typical Setting |
|---|---|---|
| EMA (50/200) | Trend direction | 50/200 periods |
| RSI | Overbought/oversold | 14 periods |
| MACD | Momentum & crossovers | 12-26-9 |
Try pairing a 50/200 EMA crossover with RSI for clear entry signals. If you want to explore more, check out the Best TradingView indicators guide for S&P 500 traders.
Using the right mix of tools on your s&p 500 tradingview charts can give you an edge in spotting high-probability setups.
Using Drawing Tools for Technical Analysis
Drawing tools bring your S&P 500 TradingView charts to life. Mark support and resistance zones, sketch trendlines, and plot chart patterns like triangles or flags.
Start with these essentials:
- Draw horizontal lines for key price levels.
- Use trendlines to connect highs and lows.
- Apply Fibonacci retracement to gauge potential pullbacks.
Color coding and labeling each line or pattern helps keep your workspace organized. For example, highlight a double top on the SPX 1-hour chart in red for quick recognition.
Mastering these visual tools on your s&p 500 tradingview workspace will sharpen your technical analysis and boost your trading confidence.
Optimizing Alerts and Notifications
Real-time alerts are a game changer on S&P 500 TradingView. Set up price and indicator-based alerts for SPY, ES1!, or any S&P 500 instrument.
Here’s a quick setup example:
Right-click on a chart level > Add Alert > Choose condition (e.g., price crossing 4600) > Select delivery method (email, app)
- Filter alerts to avoid information overload.
- Use custom alert names for clarity.
- Set up volatility spike alerts to catch big moves.
Smart alert management on your s&p 500 tradingview workspace keeps you informed without distraction, so you can act fast when opportunity knocks.
Leveraging TradingView’s Social Features
TradingView isn’t just a charting platform—it’s a thriving community. Follow top S&P 500 analysts, join discussions, and comment on trade ideas to accelerate your learning.
- Participate in idea sharing for fresh perspectives.
- Bookmark scripts or strategies that fit your style.
- Build a network of fellow S&P 500 traders.
Learning from others’ successes and mistakes can fast-track your progress. Engaging with the s&p 500 tradingview community gives you access to real-world insights and new strategies every week.
Step-by-Step: How to Trade the S&P 500 on TradingView
Ready to unlock the power of s&p 500 tradingview? Whether you’re a total beginner or just need a refresher, this step-by-step guide will walk you through the process of analyzing, executing, and managing trades on the S&P 500 using TradingView. For those eager to dive even deeper, you can also explore How to Trade the SP500 Index – Strategies, Platforms & Tools! for more strategy ideas.
Step 1: Analyzing the Market Environment
Before you place any trades on s&p 500 tradingview, always start by checking the broader market environment. Open your TradingView dashboard and review the economic calendar for upcoming events like CPI releases or Fed meetings. These can cause sharp moves in the S&P 500.
Switch to higher timeframes (daily or weekly) to spot the overall trend. Is the index bullish, bearish, or sideways? Use trendlines and moving averages to confirm the direction. This “big picture” view helps you avoid trading against major market momentum and keeps you one step ahead.
Step 2: Identifying Trade Setups
Once you understand the environment, it’s time to hunt for high-potential setups on s&p 500 tradingview. Look for key support and resistance zones using horizontal lines or rectangles. Watch for chart patterns like double tops, triangles, or flags that hint at a possible breakout or reversal.
Use technical indicators such as RSI or MACD to confirm your idea. For example, if SPY is testing support and RSI shows oversold, it may signal a bounce. Combining price action and indicators boosts your confidence before entering a trade.
Step 3: Placing and Managing Orders
TradingView offers both broker integration and paper trading for s&p 500 tradingview users. If your broker is supported, connect your account for live trading. Otherwise, use the paper trading feature to practice risk-free.
When placing orders, you’ll choose from:
| Order Type | Description |
|---|---|
| Market | Executes immediately at the best price |
| Limit | Executes at your chosen price or better |
| Stop | Triggers a market order at a set price |
For example, you might set a limit order to buy ES1! futures at a key support level. Always double-check your order size and type before confirming.
Step 4: Setting Stop Losses and Take Profits
Protecting your capital is crucial on s&p 500 tradingview. Before entering any trade, decide where to place your stop loss and take profit. A stop loss limits your downside if the market turns against you, while a take profit locks in gains at your target.
Calculate your position size based on your risk tolerance and the distance between entry and stop loss. For a 1:2 risk/reward ratio, risk $100 to aim for a $200 profit. Using TradingView’s built-in tools, draw your exit levels directly on the chart for visual clarity.
Step 5: Monitoring Trades and Adjusting Strategies
Active trade management is key on s&p 500 tradingview. Set up real-time alerts for price movements, indicator signals, or volatility spikes. TradingView lets you receive notifications via email, SMS, or app, so you’re always in the loop.
As the trade develops, adjust your stop loss to lock in profits or reduce risk. Consider using a trailing stop if the market is trending strongly. Stay flexible—sometimes the market changes, and you need to adapt your plan for the best results.
Step 6: Reviewing and Logging Your Trades
Growth as a trader happens when you reflect on your results. After closing trades on s&p 500 tradingview, review your entries, exits, and overall performance. Export your trade history or take screenshots of your chart setups.
Keep a trading journal noting why you entered, how you managed the trade, and what you learned. Reviewing a week’s worth of S&P 500 trades can reveal patterns in your decision-making and areas for improvement. This habit builds discipline and sharpens your edge.
Step 7: Avoiding Common Beginner Mistakes
New traders on s&p 500 tradingview often stumble over the same hurdles. Overtrading—jumping into too many setups—leads to emotional decisions and losses. Chasing trades after missing a move is another common pitfall.
Always stick to your plan and risk management rules. If you take a loss, avoid revenge trading. Remember, patience and discipline are your greatest assets. With practice, these habits will help you achieve long-term success in the S&P 500.
Popular S&P 500 Trading Strategies for Beginners
Curious about how to approach the market with s&p 500 tradingview? Let’s dive into the most popular beginner-friendly strategies—each designed for different trading styles but all easily accessible on TradingView.
Trend-Following Strategies
Trend-following is a staple for those starting with s&p 500 tradingview. The idea? Ride the market’s momentum by identifying the prevailing direction. Popular tools include moving average crossovers—such as the 20/50 or 50/200 EMA—and drawing clear trendlines.
For example, a 20/50 EMA crossover on the SPY 4-hour chart often signals a shift in trend. Many traders confirm with volume spikes or price action. According to backtests, trend-following strategies on the S&P 500 show consistent win rates, especially when combined with multi-timeframe analysis.
Want a deeper dive into charting and technical setups? Check out this S&P 500 futures chart analysis for advanced visuals and real-time examples.
Breakout and Range Trading
Breakout and range trading are perfect for traders who like to spot action before it happens. Using s&p 500 tradingview, you can easily mark consolidation zones—areas where the price bounces between support and resistance.
When price breaks out of these zones, it’s often followed by a sharp move. A classic example is trading a range breakout on SPX after a major economic news release. Filtering breakouts with volume indicators, like On-Balance Volume (OBV), helps avoid false signals and improves trade quality.
Don’t forget: Patience is key. Wait for confirmation before entering, and always set alerts for your breakout levels.
Momentum and Reversal Strategies
Momentum and reversal strategies thrive on price extremes. With s&p 500 tradingview, you can use indicators like RSI, MACD, and the Stochastic Oscillator to pinpoint when the market is overbought or oversold.
Spotting RSI divergences can help you catch reversals before others see them. For example, if SPX makes a new high but RSI fails to confirm, a potential reversal may be brewing. In 2023, intraday reversals on the S&P 500 occurred frequently—often after major news or at key technical levels.
These strategies work best with clear entry and exit rules. Use TradingView alerts to never miss your setup.
Swing Trading the S&P 500
Swing trading is about holding positions for several days to capture larger moves. On s&p 500 tradingview, this means using daily or 4-hour charts to identify strong support or resistance, then entering when price reacts at these levels.
A simple swing setup might involve waiting for price to bounce off daily support, confirming with a bullish candlestick pattern. For beginners, swing trading offers flexibility and less screen time. If you’re interested in cash account-friendly strategies, explore SPX Trading Strategies for Cash Accounts: A Beginner's Guide to Smarter Trades for more detailed examples.
Remember: Swing trading requires discipline and a well-defined plan to manage risk and lock in profits.
Day Trading Techniques
Day trading the S&P 500 is fast-paced and exciting. Using s&p 500 tradingview, you can focus on the 1-minute to 15-minute charts during the US market open for the most volatility.
Some traders prefer scalping—taking quick profits from small moves—while others ride intraday trends. For instance, a 5-minute chart setup might involve waiting for the first pullback after the opening bell, then entering with confirmation from moving averages and volume.
Did you know? In 2023, the average S&P 500 intraday volatility by session made day trading especially attractive for those who thrive on action. Always use stop-losses and stay alert to market news for the best results.
Essential Tips, Tools, and Resources for S&P 500 Success
Staying ahead in s&p 500 tradingview requires more than just technical skills. To maximize your trading potential, you’ll need to combine ongoing education, community engagement, disciplined psychology, and the right set of tools. Here’s how to build a solid foundation for long-term success.
Continuous Learning and Staying Updated
To excel at s&p 500 tradingview, continuous learning is essential. The financial markets never stand still, and new economic reports, earnings releases, and breaking news can move the S&P 500 in seconds.
Make it a habit to follow trusted news sources like Bloomberg and CNBC, and always keep an eye on the economic calendar. For those just starting out, How to Invest in Stocks as a Beginner: A Guide for 2025 is a great resource that covers the basics and explains why S&P 500 ETFs are ideal for broad exposure.
- Track important data releases (like CPI, NFP, Fed meetings).
- Review market summaries and earnings season highlights.
- Set aside time each week to review new trading concepts.
Understanding how these factors impact s&p 500 tradingview will help you adapt your strategies and spot new opportunities.
Community and Social Trading on TradingView
The s&p 500 tradingview ecosystem thrives on community interaction. Engaging with other traders can accelerate your learning and expose you to new strategies.
Join idea contests, comment on trade setups, and follow top S&P 500 analysts to see how others interpret market moves. The collaborative environment helps you validate your ideas and learn from both successes and mistakes.
- Share your own trading ideas and get feedback.
- Participate in discussions on recent S&P 500 moves.
- Build a network of like-minded traders for support.
By staying active in the s&p 500 tradingview community, you’ll sharpen your skills and build confidence faster than going it alone.
Risk Management and Psychology
Success in s&p 500 tradingview is impossible without strong risk management and the right mindset. Most beginners struggle with emotions like fear and greed, which can lead to costly mistakes.
Set realistic goals and always use stop losses to protect your capital. Proper position sizing ensures that no single trade can wipe out your account. Remember, even the best traders lose sometimes—what matters is how you respond.
- Avoid revenge trading after a loss.
- Stick to your trading plan and review it regularly.
- Keep a journal to track your decisions and emotions.
Mastering risk management and psychology in s&p 500 tradingview will keep you disciplined and help you grow steadily over time.
Useful Add-Ons and Tools for S&P 500 Traders
Unlocking the full potential of s&p 500 tradingview often means using add-ons and custom tools. TradingView offers economic event indicators, scripts, and automated alerts to streamline your workflow.
Explore community-created scripts and extensions to enhance your analysis. For example, understanding Multi-timeframe trading strategies can take your charting to a new level, allowing you to view trends from different perspectives.
- Install custom indicators for S&P 500 volatility or breadth.
- Set up automated alerts for key market events.
- Use scripts to visualize support/resistance or trend strength.
By equipping your s&p 500 tradingview setup with the right tools, you’ll save time and make smarter decisions with greater confidence.
Now that you’ve got a solid foundation for trading the S&P 500 on TradingView, it’s time to make your trading decisions even smarter and more confident. Imagine having real-time, AI-powered buy and sell signals right at your fingertips—no more second-guessing or staring at charts for hours. With PipTrend, you get instant alerts and clear analysis that help you act quickly and stay focused on what matters most: consistent results. Ready to see how much easier and more effective your trades can be? See Your Trading Improve With PipTrend