The VWAP Indicator: A Trader's Real Playbook
On this page
What Is VWAP and Why It Matters
Institutional traders get graded on VWAP.
Literally.
A fund manager who buys 400,000 shares at an average price below the day’s volume weighted average price did their job well; one who paid above it has some explaining to do.
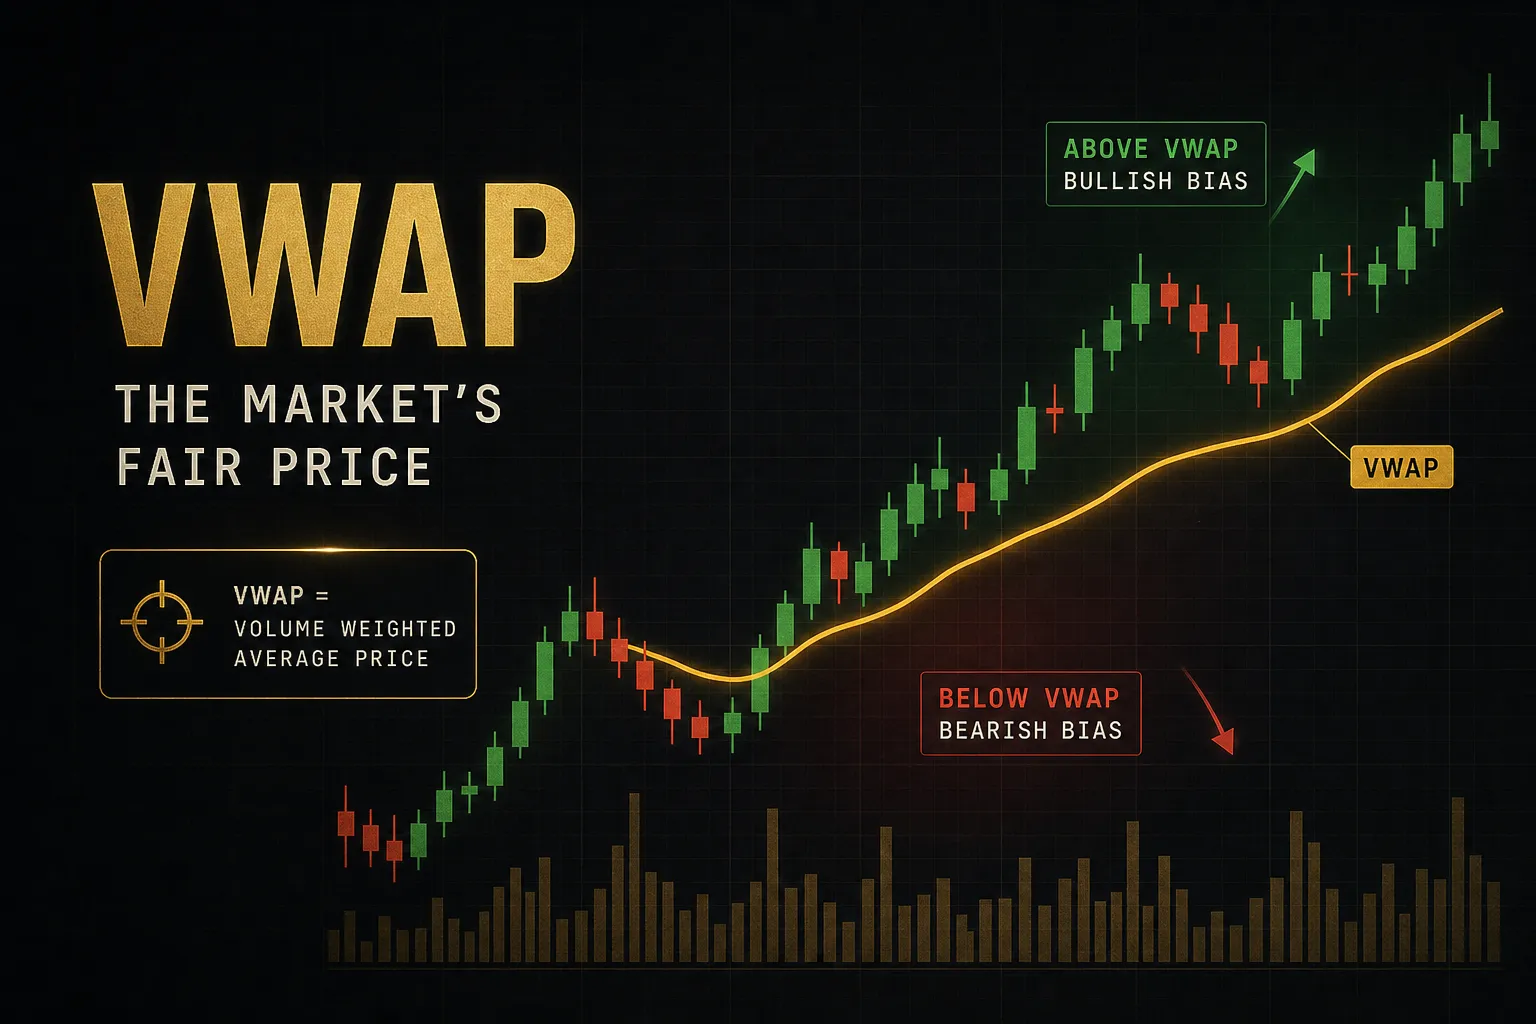
That’s the origin story most retail traders never hear. VWAP (Volume-Weighted Average Price) is the running average price an instrument has traded at during a session, weighted by volume rather than by time.
Every share that changes hands pulls the line toward that price.
The distinction matters more than it sounds. A 20-period simple moving average treats a candle that traded 50,000 shares exactly the same as one that traded 5 million.
VWAP doesn’t.
It tracks where the money actually went.
Before it became an intraday chart tool, VWAP was an execution benchmark. Desks used it to measure fill quality on large orders and to slice those orders into the day’s liquidity without moving the market.
Retail adoption came later, and with it came a lot of oversimplification.
“Above VWAP is bullish, below VWAP is bearish” is the trading equivalent of “buy low, sell high.” Technically true. Practically useless without context.
This guide goes further than that. You’ll get the actual calculation with a worked example, how session resets change what you’re looking at, why the same stock shows different VWAP values on different platforms, which markets have volume data trustworthy enough to make VWAP meaningful, and specific setups with defined invalidation rules.
One thing to accept upfront: VWAP is a lagging indicator. It’s built entirely from price and volume that already happened.
That makes it excellent evidence for a thesis and a poor standalone trigger.
How VWAP Is Actually Calculated
Most traders use VWAP for years without ever seeing the math. That’s a mistake, because the formula explains almost every quirk you’ll run into on a live chart.
The VWAP Formula Explained
VWAP is a cumulative calculation with three steps. First, each candle gets a typical price: (High + Low + Close) ÷ 3.
This is a rough proxy for where trading activity was centered during that bar.
Second, multiply that typical price by the candle’s volume. The result is sometimes called dollar volume or PV (price × volume), and it represents the approximate capital that changed hands in that bar.
Third, sum every PV value since the session began, then divide by the sum of all volume since the session began.
VWAP = Cumulative (Typical Price × Volume) ÷ Cumulative Volume
Notice what’s missing: any reference to future data. Each VWAP value uses only the current candle and everything before it.
That’s why it lags.
It can’t lead, and any strategy that assumes it will is fighting arithmetic.
A Full Worked Example
Here’s a hypothetical stock opening at 9:30 AM, tracked over six five-minute candles. Watch how the VWAP line moves toward the price levels where the heaviest volume traded.
| Candle | High / Low / Close | Typical Price | Volume | PV (TP × Vol) | Cumulative PV | Cumulative Volume | VWAP |
|---|---|---|---|---|---|---|---|
| 1 (9:30) | 50.60 / 49.80 / 50.20 | 50.20 | 500,000 | 25,100,000 | 25,100,000 | 500,000 | 50.20 |
| 2 (9:35) | 50.90 / 50.10 / 50.80 | 50.60 | 300,000 | 15,180,000 | 40,280,000 | 800,000 | 50.35 |
| 3 (9:40) | 51.40 / 50.70 / 51.30 | 51.13 | 700,000 | 35,791,000 | 76,071,000 | 1,500,000 | 50.71 |
| 4 (9:45) | 51.50 / 50.90 / 51.00 | 51.13 | 200,000 | 10,226,000 | 86,297,000 | 1,700,000 | 50.76 |
| 5 (9:50) | 51.10 / 50.20 / 50.30 | 50.53 | 900,000 | 45,477,000 | 131,774,000 | 2,600,000 | 50.68 |
| 6 (9:55) | 50.50 / 49.90 / 50.00 | 50.13 | 1,200,000 | 60,156,000 | 191,930,000 | 3,800,000 | 50.51 |
Two things stand out. Candle 4 pushed to a new high of 51.50, but it only traded 200,000 shares.
VWAP barely moved, rising just five cents.
That’s a low-conviction probe, and the indicator said so in real time.
Candle 6, by contrast, traded 1.2 million shares, more than the first three candles combined, and dragged VWAP down 17 cents.
Heavy volume at lower prices resets the day’s average cost basis. Price closed at 50.00, decisively below the 50.51 VWAP.
Also note the anchoring effect. By candle 6, cumulative volume was 3.8 million shares.
A single new candle of 300,000 shares can barely budge that average. VWAP gets progressively “heavier” as the session goes on, which is why it’s a fast-moving line at 9:35 and a sluggish one at 3:30.
Why and When VWAP Resets
The cumulative sums zero out at the start of each new session. That reset is the entire reason VWAP is a session-specific tool rather than a continuous average.
Without the reset, the calculation would eventually include so much historical volume that a single day’s trading couldn’t move it. It would flatten into a nearly useless horizontal line.
The reset keeps VWAP relevant to today’s participants and today’s cost basis.
Regular vs Extended Trading Hours
Here’s where identical charts disagree. If your platform calculates VWAP using regular trading hours only, the cumulative sums begin at 9:30 AM ET.
If it includes premarket and after-hours data, they begin at 4:00 AM.
On a stock that gapped up on earnings with 2 million shares traded premarket at prices well above the open, those two settings produce meaningfully different lines. It’s not unusual to see a 30 to 80 cent gap on a volatile mid-cap.
Neither is wrong.
But if you’re trading a VWAP reclaim and your broker’s fill logic uses a different session definition than your chart, you’re managing a level that doesn’t exist.
Check the setting once, then keep it consistent.
Most active intraday traders use RTH-only for equities, because that’s where the institutional benchmark orders actually execute.
Overnight Futures and Custom Sessions
Futures complicate things further. ES, NQ, and CL trade nearly 23 hours a day, so “the session” is a choice, not a fact.
Some platforms reset at the 6:00 PM ET globex open, others at the 9:30 AM cash open, and the resulting lines can sit hundreds of ticks apart on a trend day.
A futures trader watching the 9:30 reset sees the average price paid by the US cash session crowd. One watching the 6:00 PM reset sees the average paid by everyone since Asia opened.
Different information, different trades.
Custom session templates let you anchor to something specific: the Asia open, the London open, or a CME contract rollover. Choose the template that matches the participants you’re trying to track.
Choose the wrong one and the line is technically accurate and practically meaningless.
Session, Rolling, and Anchored VWAP
Three tools share the “volume weighted” label and behave nothing alike. Confusing them is one of the most common sources of bad VWAP trades.
Session VWAP vs Rolling VWAP vs VWMA
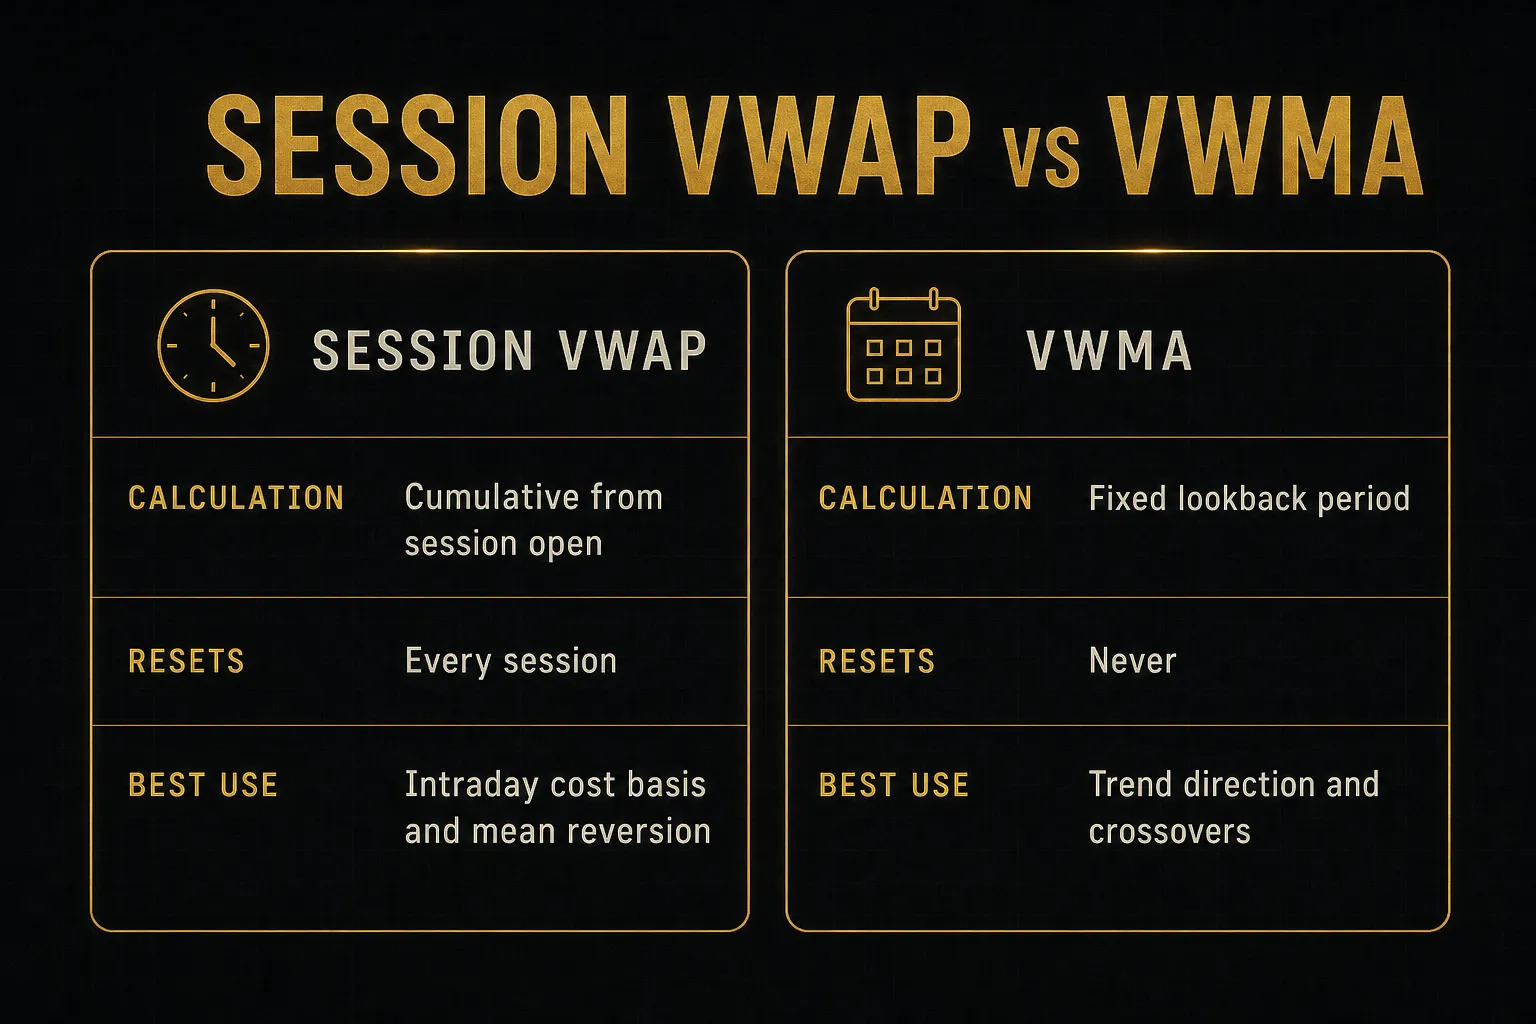
Session VWAP is what everything above described: cumulative from the session open, reset daily.
It answers one question well. What is the average price paid today, and where is the current price relative to it?
Rolling VWAP uses a fixed lookback window (say, the last 200 bars) and never resets. It slides forward, dropping old bars as new ones arrive.
Because it doesn’t accumulate weight through the day, it stays responsive and works better on higher timeframes where a daily reset would fragment the line.
VWMA (Volume-Weighted Moving Average) is a different animal entirely. It’s a moving average over a fixed period where each price is weighted by its volume, but it’s not cumulative and it has no session concept.
Functionally it behaves like a slightly smarter SMA or EMA, useful for trend confirmation and crossovers.
The practical difference: VWAP tells you about cost basis. VWMA tells you about trend direction.
Don’t ask either one to do the other’s job.
Worth mentioning here: TWAP (Time-Weighted Average Price) ignores volume completely and just averages price over time. Execution algos use it when volume data is unreliable or when a trader deliberately wants to avoid clustering fills around high-volume periods.
Anchored VWAP: When to Use It
Anchored VWAP is where the tool stops being an intraday gadget and becomes genuinely useful for swing traders.
Instead of resetting at the session open, you manually anchor the calculation to a specific candle.
An earnings gap.
A major swing low.
The day a merger was announced.
From that bar forward, the line tracks the average price paid by everyone who has traded since that event.
That’s powerful because it maps to real positioning. If a stock gapped up on earnings six weeks ago and price is now sitting just above the earnings-anchored VWAP, every buyer since the news is collectively at breakeven.
That level tends to attract defense on the way down and supply on the way up.
Common anchor points that earn their keep: earnings gaps, 52-week highs and lows, the low of a capitulation volume spike, IPO day, and the start of a clean impulse leg.
Anchor to events that changed the story, not to arbitrary dates.
Volume Quality Across Markets
VWAP is only as honest as the volume feeding it.
And volume quality varies wildly.
US equities and centralized futures are the gold standard. Trades clear through regulated venues and consolidated tape, so reported cumulative volume is close to complete.
VWAP on ES futures or a large-cap stock reflects nearly all activity.
Forex is the problem child.
There is no central exchange, so there’s no true volume figure. What your platform shows as “volume” on EURUSD is tick count from one broker’s feed, a rough proxy at best.
VWAP built on that is directionally suggestive and quantitatively unreliable.
Crypto sits in between.
Real volume exists, but it’s fragmented across dozens of exchanges with differing liquidity and, in some cases, inflated reporting. A VWAP on one exchange’s BTC chart reflects that venue only.
Aggregated indices help, but check what your data source actually includes before trusting the level.
Trading Setups Around VWAP
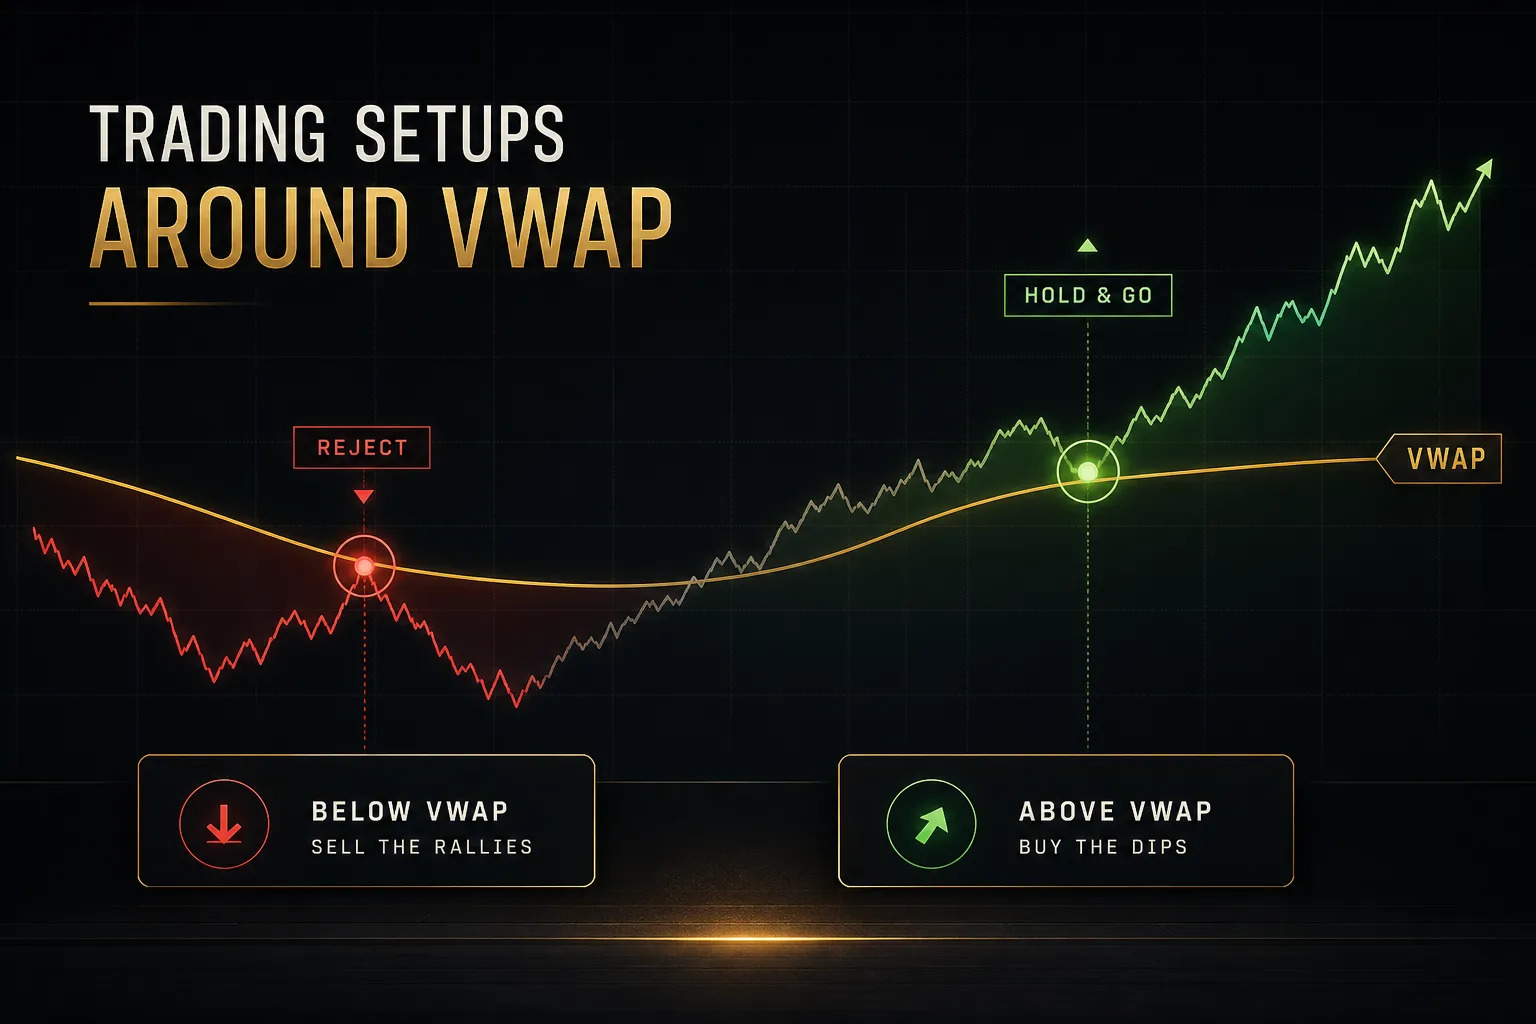
Price above VWAP.
Bullish, right?
Not necessarily, and this is where most VWAP accounts blow up.
Reading VWAP Slope and Volume
Three checks turn “above VWAP” from a slogan into a signal.
First, slope. A rising VWAP means the average price paid is climbing, which means new buyers keep stepping up.
A flat VWAP with price hovering above it means the day is balanced and you’re likely in a range.
Price above a declining VWAP is often just a bounce inside a downtrend.
Second, relative volume. Compare current volume to the average for that time of day.
A VWAP reclaim on 40% of normal volume is a low-conviction drift that reverses on the first real seller. The same reclaim on 200% relative volume means participants are committing capital.
Third, extension. If price is two or three standard deviations above VWAP, the easy part of the move is over.
VWAP bands exist precisely to measure this, and buying at the upper band because “we’re above VWAP” is how traders end up long at the high of the day.
Reclaims, Breakdowns, and Failed Tests
Three price-action patterns around the line carry real information.
A failed reclaim happens when price breaks above VWAP, holds for a few candles, then gets rejected back below. Buyers made an attempt at the day’s average cost and couldn’t hold it.
That’s a supply signal, and it often precedes a push to the lower band or the session low.
A failed breakdown is the mirror image. Price cracks below VWAP, triggers stops, then snaps back above within a few bars, usually on a volume spike.
Sellers had their chance and blew it.
These reversals tend to be sharp because trapped shorts have to cover.
Then there’s the repeated test. Price touches VWAP four, five, six times without a decisive break in either direction.
That’s not a setup, that’s a warning.
It means neither side has conviction and the day is compressing. Trading breakouts from that state produces a high rate of chop and slippage.
Wait for expansion.
Entries, Stops, Targets, and Invalidation
Here’s an objective long framework you can actually test, using the failed-breakdown-into-reclaim scenario.
Context filter: VWAP slope flat to rising, price has traded above VWAP for the majority of the session, and the instrument is liquid with clean volume data.
Entry: price closes back above VWAP on a candle with relative volume above 1.5x the time-of-day average, ideally at a level that also lines up with prior support and resistance or a volume profile node.
Stop: below the low of the reclaim candle, not below VWAP itself. VWAP moves; your stop shouldn’t drift with it.
Target: the prior session high, the upper VWAP band, or the next visible liquidity zone above. Take partials at the first, trail the rest.
Invalidation: if price closes back below VWAP on the very next candle, the reclaim failed. Exit. Don’t renegotiate with the chart.
That last rule is the whole edge.
Clean trade invalidation is what separates a rule from a hope.
Separately, remember VWAP’s original job. If you scaled into a position across the session, compare your average fill to the current VWAP.
Bought 3,000 shares at an average of 50.40 while VWAP sits at 50.68? You executed better than the market’s average participant.
That’s an execution benchmark question, not a directional one, and it’s worth tracking on every multi-fill trade.
Confirming Signals and Avoiding False Reads
A VWAP line on an otherwise naked chart will generate dozens of “signals” a day.
Most of them are noise.
The filtering is the work.
Indicators That Pair Well With VWAP
VWAP answers “where is price relative to today’s average cost.” It doesn’t answer momentum, structure, or higher-timeframe direction.
Pair it accordingly.
- Relative volume: the single most valuable companion. It tells you whether a VWAP cross represents real participation or a thin drift.
- Market structure: higher highs and higher lows on the 15-minute chart give a VWAP reclaim directional context. Reclaiming VWAP inside a series of lower highs is a much weaker trade.
- Volume profile: point of control and value area edges often sit near VWAP. When they overlap, the level gets significantly more defended.
- Momentum readings: RSI or a simple rate-of-change filter helps flag when a move into the upper band is exhausted rather than accelerating.
- Multi-timeframe confirmation systems: platforms like PipTrend treat VWAP as one of several precision entry levels alongside a timeframe alignment table, so a VWAP reclaim only becomes actionable when directional bias and timeframe agreement both confirm. The line proposes; the system disposes.
Why VWAP Sometimes Gives False Signals
Standard deviation bands are the first trap. In high volatility, the bands widen dramatically, and price can ride the upper band for hours during a genuine trend.
Traders who treat every band touch as a mean reversion short get run over on exactly the days that matter most.
Bands measure dispersion, not exhaustion.
Sustained trade outside them signals a trending regime, not an automatic reversal.
Other reliable sources of bad reads:
- Thin or low-float names: a single 50,000-share block can whip VWAP several percent. The line becomes an artifact of one order rather than a consensus price.
- Futures contract rollover: as volume migrates from the front month to the next, both contracts show distorted VWAPs for a day or two. Trade the contract that holds the liquidity.
- Crypto data gaps: exchange outages, delisted pairs, and inconsistent aggregation produce cumulative volume figures that simply don’t reflect the market.
- Higher-timeframe charts: on a daily or weekly chart, the intraday session reset makes VWAP look erratic and disconnected. Use rolling or anchored VWAP above the 1-hour timeframe.
Backtesting a VWAP Strategy
Backtested VWAP strategies look spectacular.
Live ones frequently don’t.
The gap is almost always methodology.
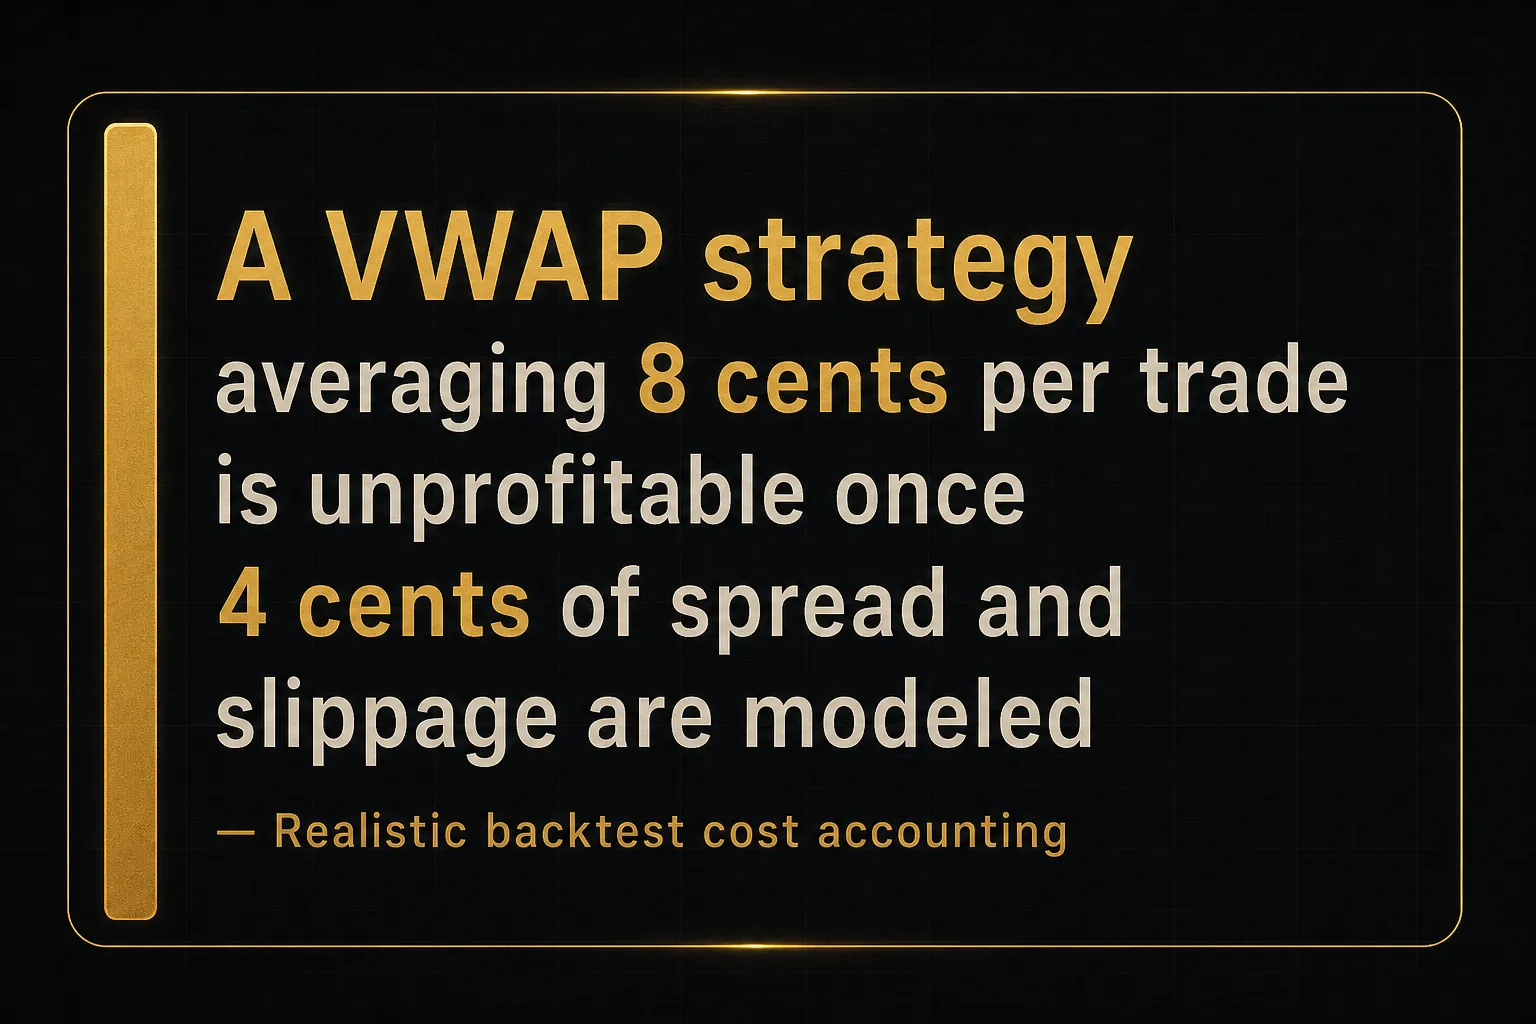
- Model real costs. Subtract commissions, the bid-ask spread, and realistic slippage. VWAP reclaims trigger during fast moves, which is exactly when slippage is worst. A strategy averaging 8 cents per trade dies at 4 cents of friction.
- Eliminate look-ahead bias. Use only data available at candle close. If your test enters at the reclaim candle’s close but uses that candle’s full high in the exit logic, you’ve invented an edge that doesn’t exist.
- Account for survivorship bias. Testing on today’s index constituents ignores every company that got delisted or acquired. Use point-in-time universes.
- Segment by market regime. Run trending, ranging, and high-volatility periods separately. VWAP pullback entry setups tend to perform well in trends and poorly in chop, and a blended result hides both facts.
- Fix your session definition. Test with the exact RTH or extended-hours setting you’ll trade live. Mismatched sessions invalidate the entire result.
- Demand a sane sample. Two hundred trades across at least a year, spanning multiple instruments. Thirty winning trades in one quarter is a story, not evidence.
VWAP Questions Traders Ask Most
How do you use the VWAP indicator in trading?
Use VWAP as a reference for the session’s average cost basis and as confirmation for a thesis you already have. Check the slope first, then whether volume supports the current move, then how extended price is relative to the bands.
The most reliable applications are pullback entries toward a rising VWAP in an uptrend and reclaim or rejection trades at the line with clear invalidation. Institutions also use it purely as an execution benchmark to grade fill quality on large orders.
Is VWAP good for day trading?
Yes, VWAP is one of the better intraday trading tools, but only on centralized, liquid instruments during regular session hours. Large-cap US equities and major index futures give it the complete volume data it needs.
It performs poorly on forex, where there’s no true volume, and inconsistently on fragmented crypto pairs. It also degrades on low-float or thinly traded stocks, where a single block trade distorts the line.
What is the best setting for VWAP?
VWAP has no adjustable period because it’s cumulative from the session open, not a lookback average. The only real settings are your session definition and your band configuration.
For equities, most intraday traders use regular trading hours only. For bands, 1, 2, and 3 standard deviations is standard: the first band frames normal rotation, the second flags extension, the third marks genuine outliers.
Should I buy when price is above or below VWAP?
Neither position is a signal on its own. Price above a rising VWAP with strong relative volume suggests buyers are in control; price above a falling VWAP is often just a bounce in a downtrend.
Better questions: is the slope rising, is volume confirming, and how far from the line is price? Buying three standard deviations above VWAP because you’re “above the line” is chasing, not trading.
What is the difference between VWAP and a moving average?
VWAP weights price by volume and resets each session; a moving average weights by time over a fixed period and runs continuously. An SMA treats a 50,000-share bar identically to a 5-million-share bar.
VWAP does not.
This makes VWAP a cost-basis measure and the SMA or EMA a trend-smoothing measure. VWMA sits in between: volume-weighted, but still a fixed-period average that behaves like a trend-following line.
Can VWAP be used for swing trading?
Standard session VWAP is not suitable for swing trading because the daily reset destroys any multi-day relevance.
Anchored VWAP is the correct tool.
Anchor to an event that changed the story: an earnings gap, a capitulation low, a 52-week high. The resulting line tracks the average price paid by every participant since that moment, which frequently acts as support or resistance for weeks or months.
Put VWAP in Its Proper Place
One takeaway matters above all others.
A VWAP reclaim or rejection is evidence to add to a trade thesis, never a trigger by itself.
Here’s the concrete next step. Pick one liquid instrument you already follow.
Add session VWAP with 1 and 2 standard deviation bands, confirm your session setting matches how you’ll actually trade it, and paper-track ten reclaim or breakdown setups.
For each one, note three things: the VWAP slope, the relative volume on the signal candle, and whether market structure agreed. Then check which outcomes correlated with which conditions.
The pattern will be obvious within ten samples.
Most traders who struggle with VWAP aren’t misreading the line. They’re reading it correctly and acting on it alone.
The line is one layer in a confirmation process, and it works exactly as well as the layers you build around it.
Sources
Risk Disclaimer: Trading involves risk. Past performance doesn't guarantee future results. Only trade with money you can afford to lose. PipTrend is a tool to assist your trading decisions, not financial advice.