
In today’s rapidly evolving markets, mastering technical tools like the moving average convergence divergence indicator can give traders a distinct advantage. As volatility becomes the new norm, understanding how to leverage this powerful indicator is essential for consistent results.
This guide breaks down the moving average convergence divergence indicator, making it accessible for traders at every level. You will discover its origins, core components, calculation steps, and interpretation methods.
We will also explore advanced strategies, integration with AI-powered tools, and common mistakes to avoid. Apply these insights to trade smarter, boost your confidence, and stay ahead in 2026’s fast-paced trading landscape.
Understanding the MACD Indicator: Origins, Components, and Core Concepts
Mastering the moving average convergence divergence indicator begins with understanding its origins, inner workings, and vital concepts. This foundation empowers traders to interpret signals effectively and apply the moving average convergence divergence indicator across asset classes.
Historical Background and Development
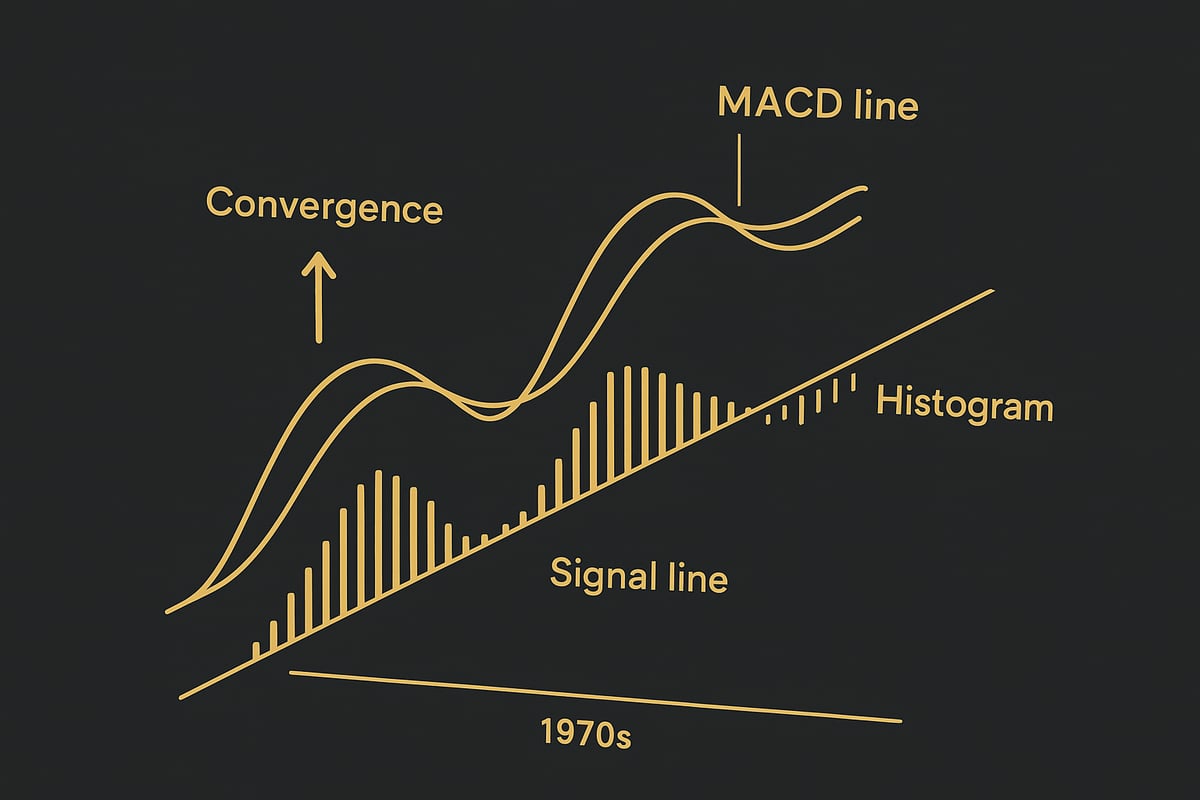
The moving average convergence divergence indicator was developed by Gerald Appel in the late 1970s. Appel designed it to help traders capture both trend and momentum in a single tool, which was groundbreaking at the time.
Since then, the moving average convergence divergence indicator has become a staple in technical analysis. Its adoption spread rapidly from stock markets to forex, commodities, indices, and, more recently, cryptocurrencies. Over the decades, the indicator evolved as charting technology advanced, making it accessible to retail traders worldwide.
Key milestones in the development of the moving average convergence divergence indicator include:
- 1970s: Creation by Gerald Appel for stock trading.
- 1980s: Adoption by professional traders and analysts.
- 1990s: Integration into electronic charting platforms.
- 2000s: Expansion into global and digital markets.
- 2010s-2020s: Widespread use in algorithmic and AI-driven trading systems.
The unique ability of the moving average convergence divergence indicator to bridge trend-following and momentum analysis has cemented its importance in both manual and automated trading strategies.
Core Components of MACD
At its core, the moving average convergence divergence indicator consists of three main elements: two exponential moving averages (EMAs), the MACD line, the signal line, and the MACD histogram.
| Component | Calculation | Function |
|---|---|---|
| 12-period EMA | Average of closing prices over 12 periods | Captures short-term price action |
| 26-period EMA | Average of closing prices over 26 periods | Reflects longer-term trend |
| MACD Line | 12-period EMA minus 26-period EMA | Main indicator line |
| Signal Line | 9-period EMA of the MACD line | Smooths MACD for signal clarity |
| Histogram | MACD line minus Signal line | Visualizes momentum and signal strength |
For example, a standard MACD chart displays the MACD line fluctuating above and below the signal line, with the histogram bars expanding or contracting according to the distance between them.
A simple MACD line calculation might look like this:
MACD = EMA_12 - EMA_26
The histogram rises as the gap between the MACD and signal line widens, signaling strong momentum. For a detailed breakdown of each component, see the MACD indicator explained guide.
Key Concepts: Convergence, Divergence, and Oscillation
The moving average convergence divergence indicator derives its power from three essential concepts: convergence, divergence, and oscillation.
- Convergence: Occurs when the two moving averages move toward each other, indicating a potential weakening of the current trend.
- Divergence: Happens when the moving averages move apart, signaling strengthening momentum or an upcoming trend change.
- Oscillation around the zero line: The MACD line oscillates above and below zero, which helps traders identify bullish or bearish momentum shifts.
For instance, if the MACD line rises above the zero line while the histogram expands, it can signal an emerging uptrend. Conversely, a falling MACD line below zero with a contracting histogram may warn of a downtrend or weakening momentum.
It is important to note that the moving average convergence divergence indicator is not bounded, so it does not directly indicate overbought or oversold conditions. Instead, it excels at capturing shifts in momentum and trend direction, providing timely insights for traders monitoring price action.
How to Calculate and Plot the MACD: Step-by-Step Guide
Mastering the calculation and plotting of the moving average convergence divergence indicator is crucial for any trader aiming for precision. This section offers a clear, step-by-step walkthrough so you can confidently apply the moving average convergence divergence indicator to your charts and strategies.
Step 1: Choosing the Right Moving Averages
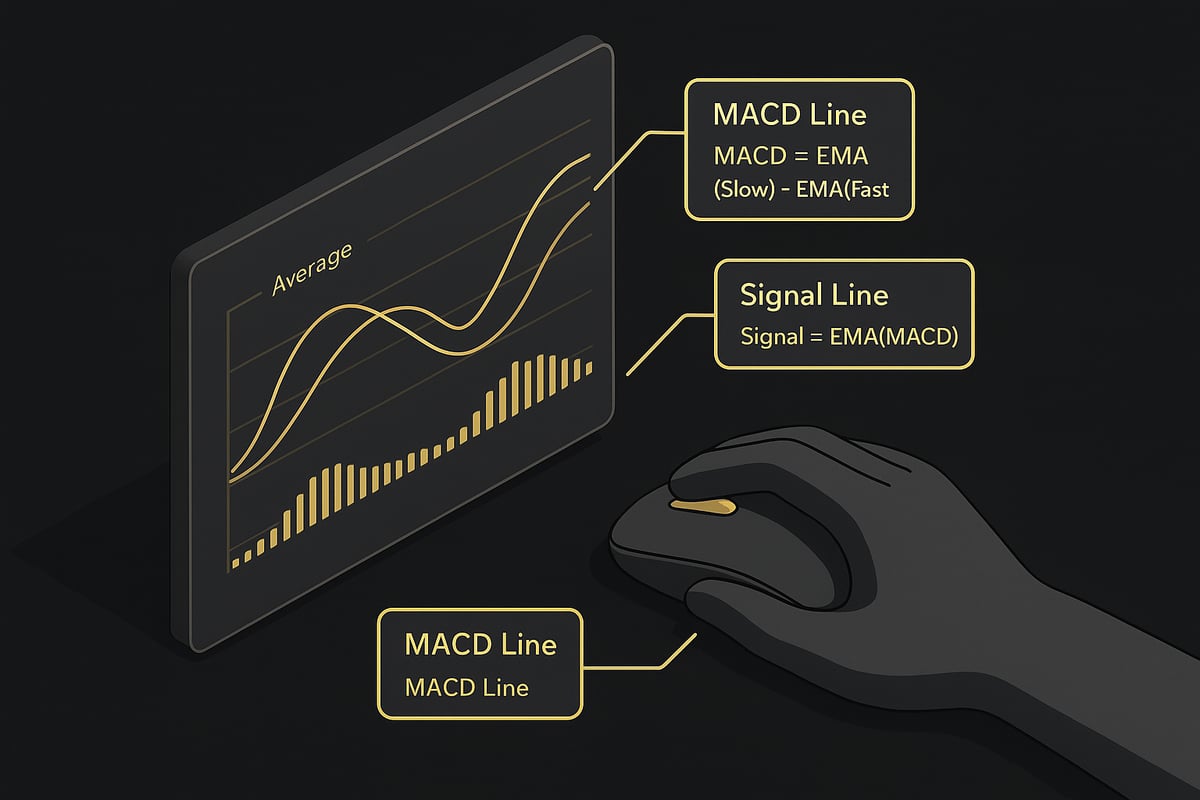
The calculation of the moving average convergence divergence indicator starts with selecting two exponential moving averages (EMAs). The standard setup uses a 12-period EMA for the short-term view and a 26-period EMA for the long-term trend. Adjusting these periods can fine-tune the indicator’s sensitivity to price changes. Traders working with volatile assets may shorten the periods for quicker signals, while those preferring fewer false alarms can lengthen them.
For deeper understanding of moving averages and their role in technical analysis, see the Moving average indicator basics guide. Your choice of periods will impact how responsive the moving average convergence divergence indicator is, so align your settings with your asset and trading style.
Step 2: Calculating the MACD Line
The core of the moving average convergence divergence indicator is the MACD line. It is calculated by subtracting the 26-period EMA from the 12-period EMA:
MACD Line = 12-period EMA − 26-period EMA
For example, if the 12-period EMA is 120.5 and the 26-period EMA is 118.0, the MACD line would be 2.5. This value represents the difference in momentum between the short and long-term price movements. Tracking this line allows traders to spot shifts in momentum using the moving average convergence divergence indicator.
Step 3: Computing the Signal Line
Next, calculate the Signal line, which acts as a smoother for the MACD line. The default setting uses a 9-period EMA of the MACD values:
Signal Line = 9-period EMA of MACD Line
If the previous MACD line values over the last nine periods average to 1.8, then the Signal line will reflect this smoothed value. The Signal line helps filter out noise, making it easier to spot actionable signals from the moving average convergence divergence indicator.
Step 4: Creating the MACD Histogram
The MACD Histogram visually represents the difference between the MACD line and the Signal line. The formula is straightforward:
MACD Histogram = MACD Line − Signal Line
When the histogram bars expand, it signals increasing momentum. When they contract, it suggests momentum is fading. For instance, if the MACD line is 2.0 and the Signal line is 1.5, the histogram bar would be 0.5. This visual tool helps traders anticipate shifts using the moving average convergence divergence indicator.
Step 5: Plotting MACD on Trading Platforms
Most trading platforms, such as TradingView and MetaTrader, make it easy to add the moving average convergence divergence indicator to your charts. Simply select MACD from the indicator list, adjust the periods if needed, and customize colors or overlays for clarity.
An annotated MACD chart typically displays the MACD line, Signal line, and Histogram, each in distinct colors. Customization options let you tailor the display to your preferences, ensuring you can quickly interpret the moving average convergence divergence indicator’s signals in real time.
Interpreting MACD Signals: Strategies and Real-World Applications
Decoding the signals from the moving average convergence divergence indicator can dramatically improve trading outcomes. Understanding how to interpret MACD’s core signals is essential for both new and experienced traders in 2026. This section explores the main strategies and real-world applications, helping you recognize actionable patterns and avoid common traps.
Signal Line Crossovers
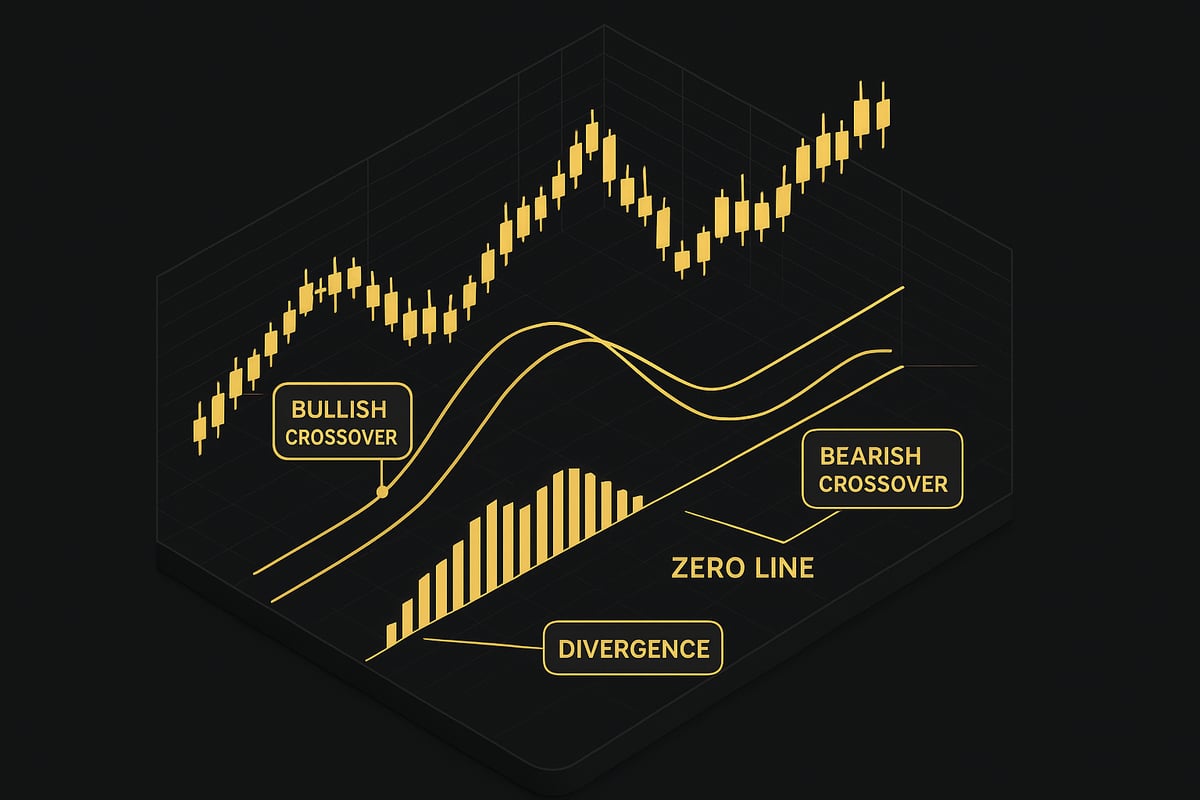
One of the most popular strategies using the moving average convergence divergence indicator is the signal line crossover. This occurs when the MACD line crosses above or below its signal line, indicating potential buy or sell signals.
A bullish crossover happens when the MACD line moves above the signal line, suggesting upward momentum. Conversely, a bearish crossover occurs when the MACD line crosses below the signal line, often signaling a downward trend.
Here is a quick comparison:
| Crossover Type | Description | Typical Action |
|---|---|---|
| Bullish | MACD > Signal Line | Consider buying |
| Bearish | MACD < Signal Line | Consider selling |
For example, after a bullish crossover, traders might enter a long position. However, not every crossover leads to a profitable trade. Filtering these signals with volume or other indicators can help reduce the risk of false entries. Always remember, the moving average convergence divergence indicator should be used as part of a broader strategy.
Centerline (Zero Line) Crossovers
The centerline, or zero line, is another critical aspect of the moving average convergence divergence indicator. When the MACD line crosses above the zero line, it indicates that the short-term momentum is overtaking the long-term trend, often confirming a bullish market phase.
A cross below the zero line signals that momentum has shifted bearish. This can be especially useful for traders looking to confirm the start of a new trend or a significant reversal.
For instance, if a MACD bullish crossover is followed by a move above the zero line, it strengthens the case for a sustained uptrend. In volatile markets, centerline crossovers help filter out noise and confirm real momentum shifts. Yet, traders should be cautious, as false signals can still occur, especially in choppy price environments.
Divergences: Spotting Momentum Shifts
Divergence is a powerful concept within the moving average convergence divergence indicator framework. Bullish divergence occurs when prices make new lows, but the MACD forms higher lows, hinting at a potential reversal to the upside. Bearish divergence is the opposite, with prices reaching new highs as MACD prints lower highs, often preceding a downward move.
A real-world case study: Imagine a stock in a steady decline, but the MACD histogram begins to rise, forming a higher low as the price sets a lower low. This divergence can be a precursor to a trend reversal, offering a valuable entry point.
However, not all divergences lead to immediate reversals. Sometimes, the market can remain in a divergent state for an extended period. It is important to combine divergence signals with other forms of analysis and not rely solely on the moving average convergence divergence indicator.
The Role of the MACD Histogram
The MACD histogram offers a dynamic visual of the difference between the MACD line and the signal line. When the bars expand, it reflects increasing momentum, while contracting bars signal weakening momentum.
For traders, histogram peaks and troughs can provide early warnings of trend changes. For example, if the histogram starts to shrink after a strong rally, it may indicate that buying power is fading, even before a crossover occurs.
A practical approach is to watch for the histogram to change direction, as this often precedes a reversal in price action. The moving average convergence divergence indicator’s histogram is especially valuable for visual learners and those seeking to time entries and exits with more precision.
Combining MACD with Other Indicators
To increase the reliability of signals from the moving average convergence divergence indicator, many traders combine it with other tools like the Relative Strength Index (RSI), volume, or additional moving averages. Multi-indicator strategies help filter out false positives and confirm the strength of a signal.
For example, a bullish MACD crossover that aligns with an RSI reading above 50 can provide stronger confirmation for a long trade. This layered approach reduces the chance of acting on misleading signals.
If you’re interested in learning more about how the RSI can complement MACD, explore RSI indicator strategies for practical examples and advanced tactics.
Timeframe Considerations
The moving average convergence divergence indicator adapts to multiple timeframes, but its signals behave differently across intraday, daily, and weekly charts. For scalpers, shorter periods may capture quick moves but generate more noise. Swing traders might prefer daily charts for clearer trends, while investors often look at weekly data for long-term signals.
For example, a bullish crossover on the hourly chart might be insignificant if the daily MACD is still bearish. Always align your MACD analysis with your trading style and time horizon.
Comparing signals across timeframes can reveal stronger opportunities and help avoid conflicting trades. Adjusting MACD settings to fit each asset and timeframe is key to maximizing its effectiveness.
Advanced MACD Strategies for 2026: Adapting to Modern Markets
Staying ahead in trading requires evolving your approach with the latest techniques. In 2026, mastering advanced strategies for the moving average convergence divergence indicator is essential for navigating fast-changing markets. Let’s explore how to optimize, automate, and adapt MACD for today’s volatile trading landscape.

Customizing MACD Settings for Market Conditions
The moving average convergence divergence indicator is versatile, but its default settings may not fit every asset or market condition. Traders often adjust the 12, 26, and 9-period EMAs to better match volatility or asset class.
For high-volatility assets like cryptocurrencies, shorter EMAs (e.g., 8 and 18) can increase responsiveness. In contrast, longer periods smooth out noise in stable markets. Fine-tuning these settings helps balance sensitivity and signal quality.
Backtesting is crucial. Run historical tests with various EMA combinations to find what delivers the best results for your trading style. For those seeking a deeper, mathematical understanding of the indicator’s structure, the Operator Analysis of MACD provides valuable insights into its equivalence to a band-pass filter.
A summary table for quick reference:
| Asset Type | Short EMA | Long EMA | Signal EMA |
|---|---|---|---|
| Crypto | 8 | 18 | 6 |
| Forex | 10 | 21 | 8 |
| Stocks | 12 | 26 | 9 |
| Indices | 14 | 30 | 10 |
Experiment with these settings, but always validate with forward and backward tests.
Multi-Timeframe MACD Analysis
Analyzing the moving average convergence divergence indicator across several timeframes provides a powerful filter against false signals. For example, if the MACD shows a bullish crossover on both the daily and 4-hour charts, the probability of a strong trend increases.
Start by identifying the primary trend on a higher timeframe (like weekly or daily). Then, look for MACD confirmation on a lower timeframe for precise entry. This alignment reduces the risk of trading against the prevailing trend.
A step-by-step approach:
- Identify trend direction with MACD on the higher timeframe.
- Wait for the same signal on the lower timeframe.
- Enter trades only when both timeframes align.
Multi-timeframe analysis is particularly effective in volatile periods, helping traders avoid conflicting signals and whipsaws.
Automated and Algorithmic Trading with MACD
Algorithmic trading has made it easier to implement disciplined strategies based on the moving average convergence divergence indicator. By coding specific MACD logic, traders can automate entries and exits, removing emotion from the process.
A simple MACD-based trading algorithm might look like this:
if macd_line > signal_line and previous_macd_line <= previous_signal_line:
 # Buy signal
 execute_trade('buy')
elif macd_line < signal_line and previous_macd_line >= previous_signal_line:
 # Sell signal
 execute_trade('sell')
Modern trading bots can incorporate additional filters, such as volume or RSI, to further refine signals. Automated systems can also scan multiple assets and timeframes simultaneously, ensuring no opportunity is missed.
Integrating the moving average convergence divergence indicator into your trading bot can provide consistency, speed, and scalability for your strategy.
MACD in Volatile and Sideways Markets
The moving average convergence divergence indicator excels in trending markets but can generate false signals during sideways or choppy conditions. To adapt, traders should apply filters or combine MACD with other indicators, such as Bollinger Bands or ATR, to confirm trend strength.
In range-bound markets, it’s wise to:
- Reduce position size to limit risk.
- Wait for strong momentum signals (e.g., large histogram expansion).
- Avoid trades when MACD lines are flat or frequently crossing.
Filtering out low-quality signals helps minimize whipsaws and protects your capital. Always monitor the broader market context and adjust your approach as volatility changes.
Case Studies: MACD Successes and Failures
Learning from real-world outcomes is vital for any trader using the moving average convergence divergence indicator. Consider a scenario where a trader customized MACD settings for a highly volatile crypto asset, backtested the approach, and achieved a 60% win rate over 100 trades.
In another case, a trader ignored timeframe alignment and suffered repeated losses due to conflicting MACD signals on different charts. These examples highlight the importance of both strategy customization and disciplined risk management.
Historical data shows that combining MACD with filters or multi-timeframe analysis often improves win/loss ratios. Review your trades regularly and adjust your strategy to maximize the indicator’s strengths.
Integrating MACD with AI-Powered Trading Tools
Artificial intelligence is rapidly changing how traders use technical indicators like the moving average convergence divergence indicator. AI brings a new level of speed, accuracy, and adaptability to market analysis. By processing vast amounts of data in real time, AI can help traders overcome human biases and spot patterns that might otherwise go unnoticed.
AI-powered systems are not just about automation. They enhance the moving average convergence divergence indicator by providing smarter, context-aware signals. For example, AI can adjust to current market volatility, filter out market noise, and help traders avoid false signals. Many modern platforms leverage AI to blend the moving average convergence divergence indicator with other technical indicators, making analysis more robust. This integration is especially valuable in fast-moving markets where split-second decisions matter. For a broader understanding, you can explore technical indicators for trading and how they fit into the modern trader’s toolkit.
How AI-Powered Tools Like PipTrend Enhance MACD Trading
PipTrend is a prime example of how AI-powered tools are advancing the moving average convergence divergence indicator for traders. This innovative platform uses artificial intelligence to deliver clear, actionable buy and sell signals, combining the moving average convergence divergence indicator with other smart algorithms.
PipTrend’s strength lies in its multi-timeframe analysis. The AI engine evaluates the moving average convergence divergence indicator across different chart intervals, reducing the risk of conflicting signals. Instant alerts and automated trend detection help traders act quickly when a MACD crossover or divergence emerges. For instance, if the moving average convergence divergence indicator signals a bullish crossover, PipTrend’s AI confirms the trend by analyzing additional factors, increasing the probability of a successful trade.
Retail traders benefit from PipTrend’s integration with platforms like TradingView, as it supports forex, crypto, stocks, and indices. The result is a simplified, reliable approach to using the moving average convergence divergence indicator, regardless of market conditions.
Best Practices for Combining MACD with AI Tools
To maximize the value of the moving average convergence divergence indicator, traders should use AI-generated signals as a confirmation tool rather than a replacement for manual analysis. Combining human insight with AI’s data-driven approach helps filter out false positives and enhances decision-making.
Here are some best practices for integrating AI tools with the moving average convergence divergence indicator:
- Customize alerts and filters to match your trading style and risk tolerance.
- Always cross-check AI signals with your own MACD analysis.
- Use multi-indicator strategies, pairing the moving average convergence divergence indicator with RSI or volume for better confirmation.
- Continuously review AI performance and adjust settings as markets evolve.
A typical workflow might involve setting up PipTrend to monitor for MACD crossovers, then confirming those signals with your manual chart analysis. This hybrid approach leverages the speed of AI with the nuanced judgment of the trader. By following these steps, traders can increase consistency and confidence when using the moving average convergence divergence indicator alongside AI-powered tools.
Common Mistakes and Pitfalls When Using MACD (and How to Avoid Them)
Mastering the moving average convergence divergence indicator can be challenging, especially in the fast-paced markets of 2026. Many traders fall into common traps that reduce the effectiveness of their analysis and lead to costly errors. Recognizing these pitfalls is the first step to leveraging MACD with confidence and accuracy.
Over-Reliance and Ignoring Market Context
One of the most frequent mistakes is relying solely on the moving average convergence divergence indicator without evaluating the broader market environment. MACD is powerful, but it performs best when used alongside other tools and fundamental analysis. For example, during unexpected news events, MACD signals may lag or give conflicting cues. Always consider macroeconomic factors and price action before acting on a signal. Integrating additional indicators, such as RSI or volume, can help provide a more complete market view.
Misinterpreting Crossovers and Timeframes
Misreading signal line and centerline crossovers is another common pitfall, especially in volatile or choppy markets. A bullish crossover does not always guarantee a sustained uptrend, and a bearish crossover can quickly reverse. Traders often overlook the importance of aligning the moving average convergence divergence indicator signals across multiple timeframes. Without this alignment, signals can conflict, leading to confusion and poor entries. Adjust your analysis to the asset’s volatility and trading style for optimal results.
Incorrect Settings and Neglecting Risk Management
Failing to adjust MACD settings to suit different assets or market conditions can result in misleading signals. Cryptocurrency, forex, and equities each have unique volatility profiles, so default settings may not always be appropriate. Additionally, neglecting risk management—such as using stop-loss orders—can turn small errors into significant losses. According to research on the Effectiveness of RSI and MACD Indicators, traders who combine MACD with robust risk controls and proper settings achieve higher accuracy in volatile markets.
Whipsaws, False Signals, and Best Practices
A classic scenario is being whipsawed by a false signal: the moving average convergence divergence indicator flashes a buy, only for the price to reverse immediately. This is especially common in sideways or low-liquidity markets. To reduce whipsaws, always seek confirmation from other indicators or price structure. For instance, Combining Bollinger Bands and MACD has been shown to filter out many weak signals. Additionally, backtesting and continuous learning can help refine your approach and adapt to changing market dynamics.
| Best Practices for MACD Usage | Benefit |
|---|---|
| Use confirmation indicators | Reduce false signals |
| Align signals across timeframes | Improve entry/exit accuracy |
| Adjust settings for asset volatility | Enhance signal reliability |
| Apply strict risk management | Limit potential losses |
| Backtest and review performance | Continuous improvement |
By applying these best practices, traders can maximize the moving average convergence divergence indicator’s effectiveness and avoid the most common pitfalls. Stay disciplined, remain adaptive, and always put risk management at the forefront of your trading plan.
You’ve just explored how mastering the MACD indicator can transform your approach to trading—whether you’re navigating forex, crypto, stocks, or indices. By applying these strategies and understanding the role of AI-powered tools like PipTrend, you can make more confident, data-driven decisions and avoid common pitfalls. If you’re ready to put these insights into action and see real improvements in your results, why not take the next step? Experience how real-time signals and multi-timeframe analysis can simplify your trading routine and boost your confidence.