
You watch XAUUSD break a key level on the Daily chart, enter on the 5-minute, and watch price reverse 30 pips against you before hitting your stop. Sound familiar? Most gold traders know direction but fail at entries because they treat them as the same decision. They're not. Gold moves fast, spreads widen during news, and liquidity gaps can destroy your risk-reward ratio before your trade idea even plays out. The difference between profitable gold traders and break-even traders isn't market knowledge. It's separating trend direction from precise entry timing across multiple timeframes with a repeatable system.
Why Gold Traders Need Multi-Timeframe Confirmation
Gold trading isn't like EUR/USD or GBP/JPY. XAUUSD moves in explosive bursts tied to macroeconomic events, central bank policy shifts, and institutional flows tracked by organizations like the London Bullion Market Association. A single Federal Reserve statement can move gold 200 pips in minutes. That volatility creates opportunity, but only if you're reading multiple timeframes correctly.
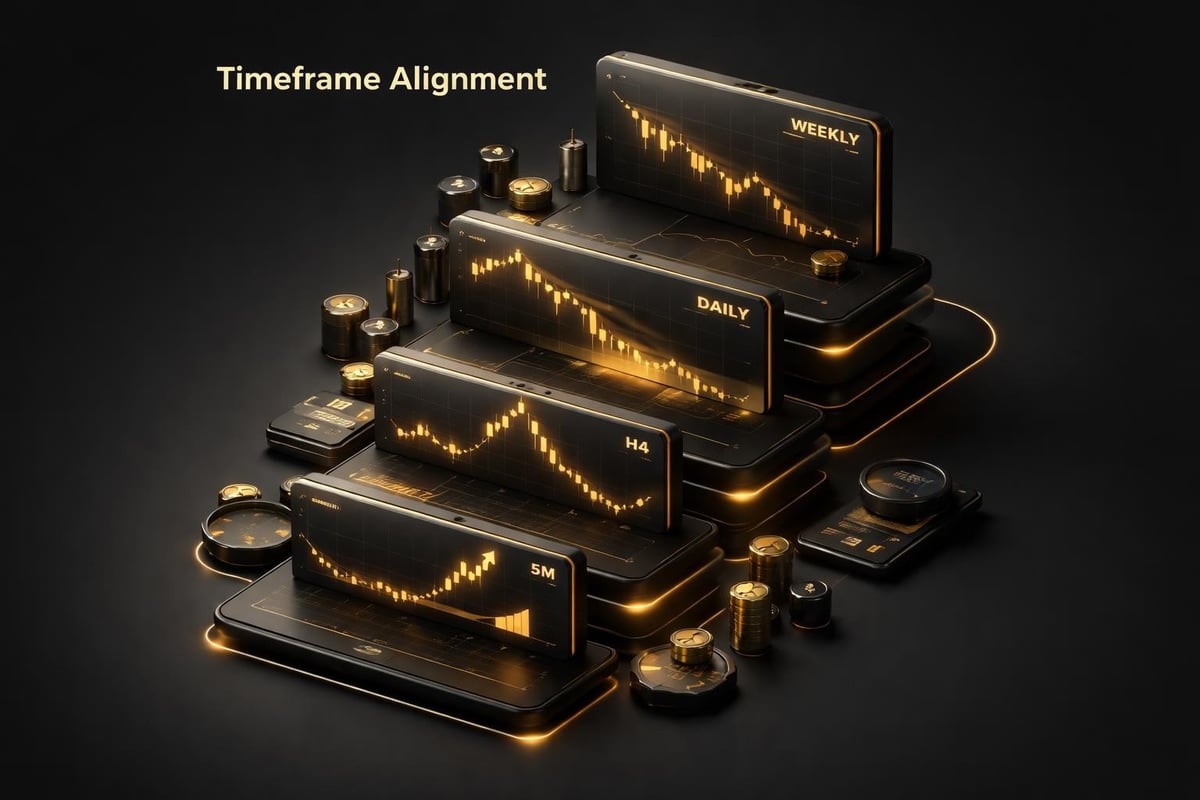
Start with the Weekly chart to identify the primary trend. Is gold in an uptrend, downtrend, or range? Mark major support and resistance levels that institutions watch. These aren't arbitrary lines. They're price zones where billions in contracts change hands, studied extensively by the World Gold Council’s research division. Next, drop to the Daily chart. Look for swing structure. Are you seeing higher highs and higher lows, or is structure breaking down? This is your directional bias. Nothing else matters until this is clear.
Here's where most gold traders fail. They see Daily uptrend, spot a 5-minute bullish candle, and enter immediately. No confirmation from H4 or H1. No check on whether the 15-minute chart shows exhaustion. No validation that the 5-minute entry aligns with higher timeframe liquidity zones. You need at least three timeframes aligned before you risk capital. Weekly for context, Daily for bias, H4 or H1 for setup, and 5-minute or 15-minute for execution.
The Direction vs. Entry Problem Gold Traders Face
You can be right on direction and still lose money. This is the core issue. Gold trends higher all week, but your entries get stopped out because you bought at resistance instead of waiting for a pullback to support. Direction tells you which way to trade. Entry tells you when and where to execute. They are separate decisions requiring separate analysis.
Direction comes from higher timeframes. Use Daily, H4, and H1 to establish bias. Look for BUY or SELL signals that don't repaint after the candle closes. Repainting indicators show you a signal in real-time, then remove it after the bar completes. You think you had confirmation, but the signal vanishes. Useless for live trading. Non-repainting signals give you confirmation only after the close, which means you can trust them for directional bias.
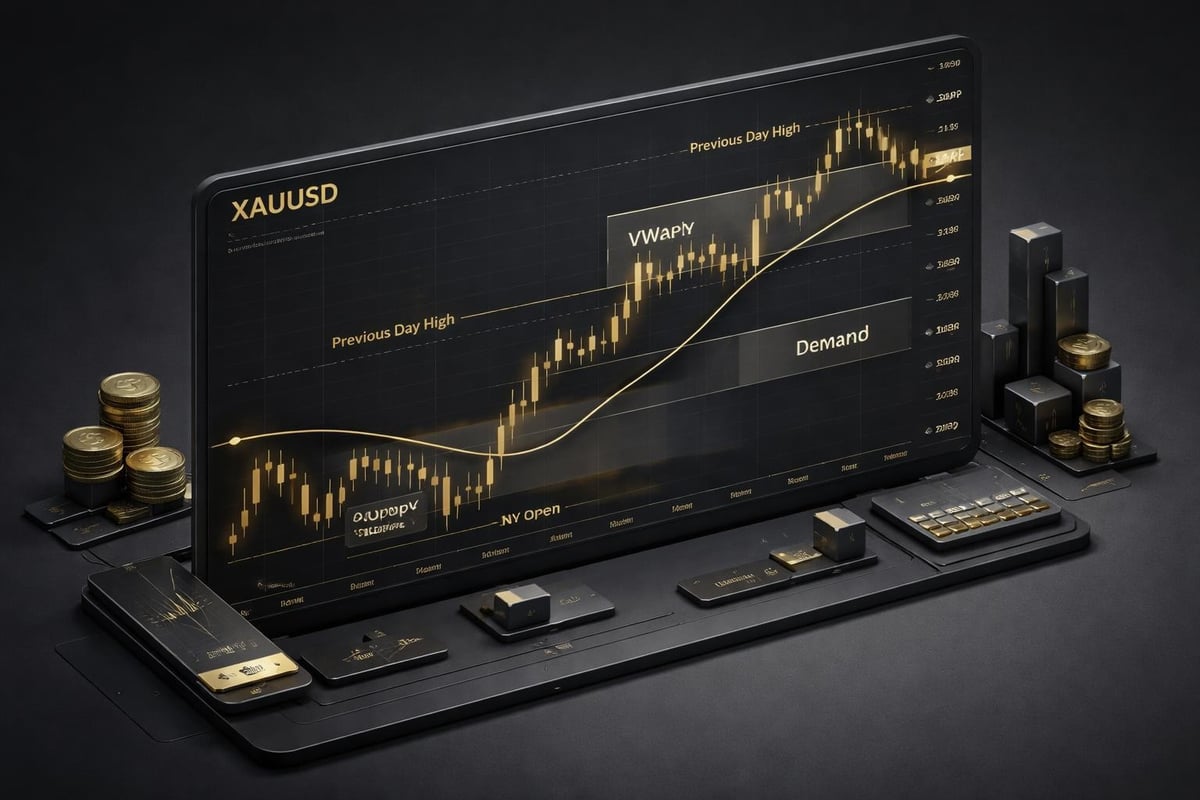
Entry precision requires institutional levels. VWAP (Volume Weighted Average Price), previous day's high and low (HOD/LOD), session opens, and supply/demand zones. These are where large orders sit. When gold pulls back to VWAP during an uptrend on the Daily chart, that's your entry zone, not random price. When price taps the London session open during a downtrend, you're selling into institutional liquidity, not guessing.
Track this on lower timeframes. Once your H1 or H4 gives directional confirmation, switch to 15-minute or 5-minute charts to watch for price interaction with these levels. Does gold reject VWAP with a strong bullish candle? That's your entry signal. Does it break and retest the previous day's low in a downtrend? That's confluence. Entry isn't about patterns or indicators alone. It's about where institutional money is positioned and how price reacts when it arrives.
Systematic Gold Trading Across Multiple Assets
Gold traders don't only trade spot gold (XAUUSD). You can trade gold futures, gold mining stocks, gold ETFs, and even crypto-gold hybrids. Each asset has different volatility, spread costs, and timeframe efficiency. XAUUSD on Forex offers tight spreads and 24-hour access. Gold futures provide leverage and institutional depth tracked by exchanges like the Dubai Gold & Commodities Exchange. Mining stocks correlate with gold but add equity beta. Choose based on your trading style and capital.
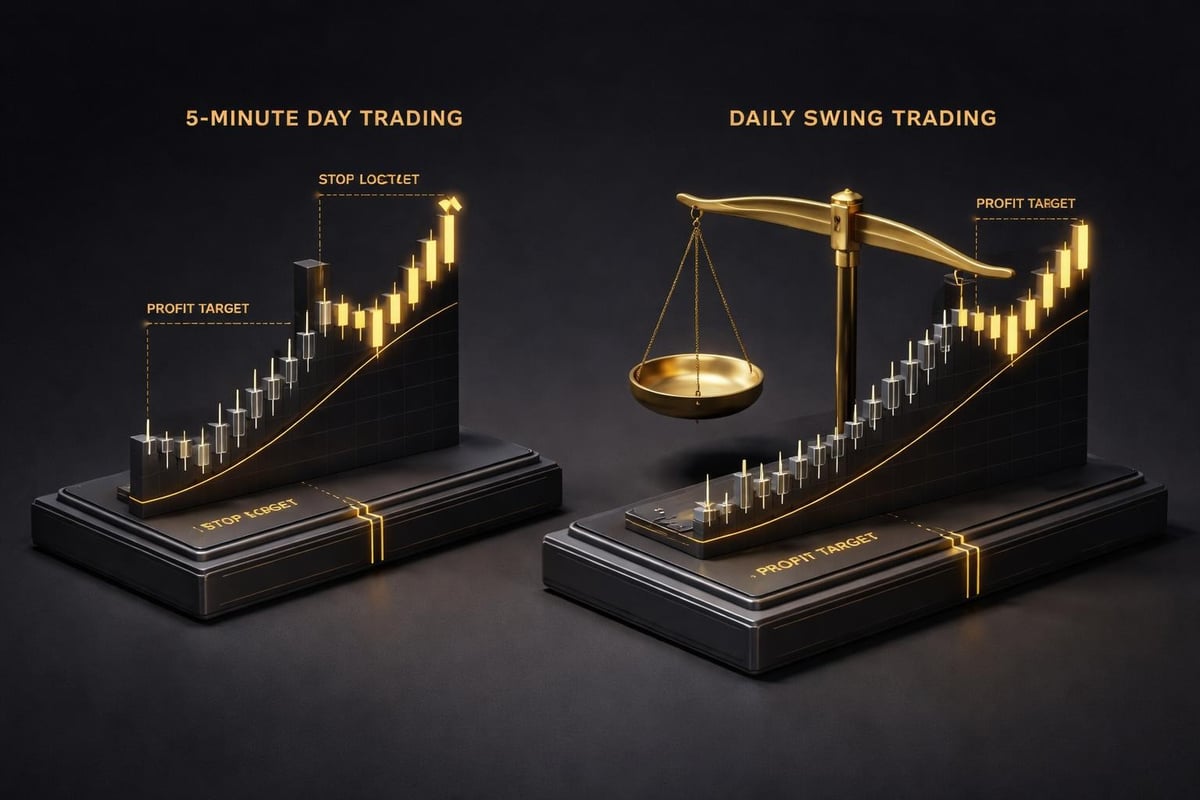
For day traders, XAUUSD on the 5-minute to H1 timeframes works best. Use the London and New York session overlaps for highest liquidity. Target 20-50 pip moves with 2:1 or 3:1 risk-reward ratios. Set stops below the nearest swing low or institutional level, not arbitrary pip distances. If your entry is at 2,015 and the swing low is 2,010, your stop is 5 pips below that at 2,004.50. Your take profit for a 2:1 RR would be at 2,026. Simple math, repeatable process.
Swing traders operate on H4, Daily, and Weekly charts. You're holding positions for days or weeks, targeting 200-500 pip moves. Your stops are wider, often 50-100 pips, but your RR ratios improve to 4:1 or 5:1. Check Daily structure every morning. If gold is trending higher and pulls back to a key Daily support zone, you're looking for H4 confirmation before entering. Don't rush. Let price come to your level.
Long-term investors use Weekly and Monthly charts. You're positioning for major macroeconomic shifts-inflation spikes, currency devaluation, geopolitical instability. Gold's role as a safe haven becomes your edge. But even long-term trades need precise entries. Buying gold at the top of a Weekly range because "it's going higher eventually" leaves you underwater for months. Wait for the pullback to support, confirm with Monthly structure, then deploy capital.
| Timeframe | Trader Type | Typical Hold Time | Target (pips) | Stop (pips) | RR Ratio |
|---|---|---|---|---|---|
| 1m – 5m | Scalper | Minutes to hours | 10-20 | 5-10 | 2:1 |
| 15m – H1 | Day Trader | Hours to 1 day | 20-50 | 10-20 | 2:1-3:1 |
| H4 – Daily | Swing Trader | Days to weeks | 200-500 | 50-100 | 4:1-5:1 |
| Weekly | Position Trader | Weeks to months | 500-1500 | 100-300 | 5:1-7:1 |
How Prop Firm Gold Traders Stay Disciplined
Prop firm challenges demand consistency. You can't blow 5% of your account chasing one XAUUSD breakout because you ignored your system. Prop firms fund traders who prove they can follow rules under pressure. Gold trading fits prop firm models well because volatility creates opportunity, but that same volatility punishes emotional decisions.
Your edge in prop firm challenges is a systematic approach. Define your setup criteria before the market opens. Example: you only take Daily uptrend + H4 pullback to VWAP + 15-minute bullish engulfing candle at that level. Write it down. If all three conditions aren't met, you don't trade. No exceptions. This eliminates the "I think it'll bounce here" trades that destroy accounts.
Track every trade in a journal. Record entry price, stop loss, take profit, timeframe alignment, and whether all conditions were met. Review weekly. You'll spot patterns. Maybe you win 70% of trades when all timeframes align but only 45% when you skip H4 confirmation. The data tells you what works. Prop firms want traders who adapt based on evidence, not gut feelings.
Drawdown management separates funded traders from failed challenges. Most prop firms cap daily loss at 3-5% and total drawdown at 8-10%. Gold's volatility can hit those limits in one trade if you overleverage. Use position sizing calculators. If your stop is 20 pips and you're risking 1% of a $100,000 account, your position size is 5 mini lots (0.5 standard lots). Not 2 standard lots because you "feel confident." Math over emotion, every trade.
Price Action Patterns Gold Traders Actually Use
Candlestick patterns work on gold, but context matters more than the pattern itself. A bullish engulfing candle at random price means nothing. A bullish engulfing at VWAP during a Daily uptrend with H1 confirmation? That's a high-probability setup. Price action isn't magic. It's reading order flow at key levels.
Pin bars (hammers and shooting stars) show rejection. When gold tests a major resistance level on the H4 chart and prints a shooting star, that's sellers defending the level. If your Daily trend is down, this confirms continuation. Your entry is on the 15-minute chart after the shooting star closes, with a stop 10 pips above the wick and a target at the next support zone. Measure your RR before entering. If it's less than 2:1, skip the trade.
Inside bars signal consolidation before continuation or reversal. Gold often prints inside bars on H1 after a strong move. Price is digesting the previous impulse. Your job is to determine direction after the break. If the inside bar forms at a key support level during a Daily uptrend, you're waiting for an upside break to enter long. If it forms at resistance during a downtrend, you're shorting the downside break. The pattern alone doesn't tell you direction. Timeframe context does.
Support and resistance aren't lines. They're zones. Gold rarely respects exact price levels because of spread, slippage, and order clustering. When marking Daily support at 2,000, think of it as 1,998-2,002. Price might wick to 1,998.50 and reverse. If your stop is exactly at 2,000, you get stopped out on a valid level test. Give your stops room to breathe within the zone, typically 5-10 pips below support or above resistance depending on the timeframe.
Real Gold Trading Scenarios With Timeframe Confirmation
Let's walk through a live example. It's March 2026. Gold is trending higher on the Weekly and Daily charts, driven by central bank buying and inflation concerns covered in recent gold market research. You're trading XAUUSD on TradingView. Weekly chart shows clear higher highs and higher lows. Daily chart confirms the uptrend with structure intact. Your bias is long only.
You drop to the H4 chart. Gold pulled back from 2,085 to 2,065 over the past 12 hours, retracing into a previous resistance zone that should now act as support. VWAP on H4 sits at 2,066. This is your entry zone. You switch to the 15-minute chart and wait. Price tests 2,066, prints a bullish engulfing candle, and closes above VWAP. That's your entry signal. You enter long at 2,067 with a stop at 2,062 (5 pips below the swing low) and a target at 2,082 (previous high). Risk is 5 pips, reward is 15 pips, giving you a 3:1 RR.
Trade management begins immediately. You don't just set and forget. Check the H1 chart every hour. Is price respecting the 15-minute structure? Are higher timeframes still aligned? If the H4 prints a strong bearish reversal candle, you exit at breakeven or small profit even if your target wasn't hit. Conditions changed. Your edge is gone.
Now a losing trade. Same setup, same timeframes. You enter long at 2,067, but price immediately drops, hits your stop at 2,062, and then reverses back up to hit your original 2,082 target without you. Frustrating, but correct execution. Your stop was placed based on structure. The market invalidated your setup by breaking the swing low. You followed the system, took the loss, and preserved capital for the next trade. That's discipline.
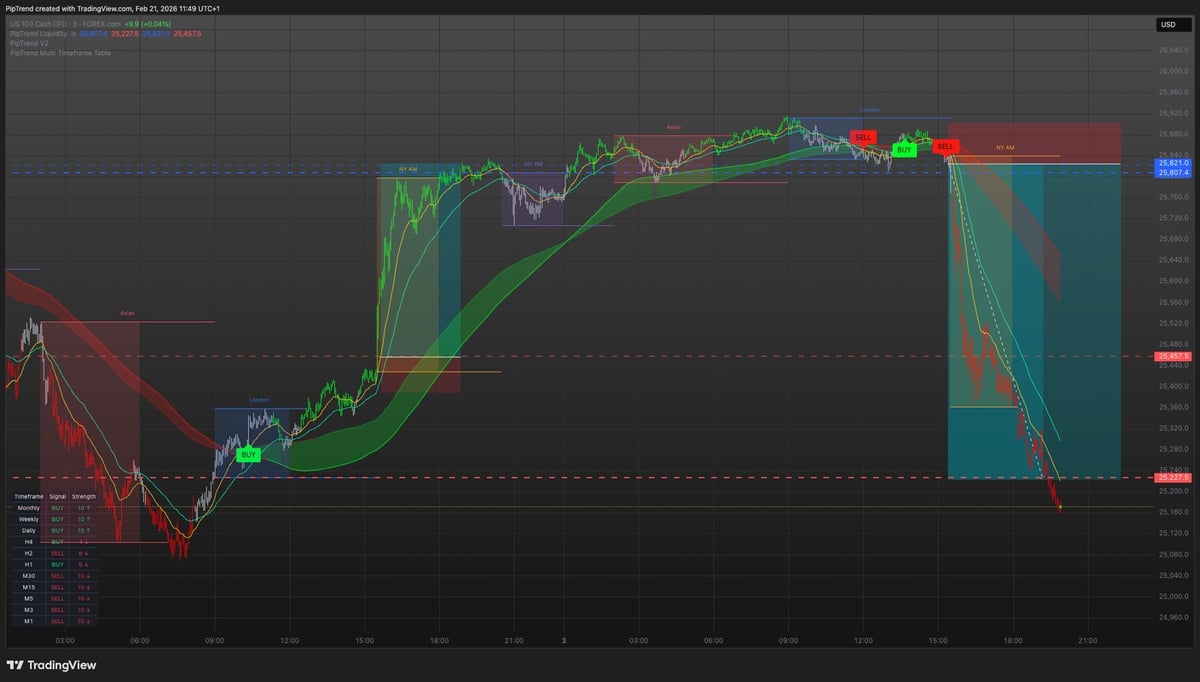
This is where unified systems help. Instead of juggling separate tools for trend direction, entry levels, and trade management, you need confirmation across all three at a glance. PipTrend addresses this by combining directional signals, institutional entry zones, and a multi-timeframe table showing 12 timeframes simultaneously. When your Weekly, Daily, H4, H1, and 15-minute charts all align, you see it instantly. When they don't, you stay flat. It's the separation of direction and entry built into one repeatable workflow, backed by verified trade results and designed specifically for intermediate traders who understand the concepts but struggle with execution consistency. You can explore how this systematic approach works through a 3-day free trial at PipTrend.
Managing Gold Trades Across 12 Timeframes
You can't watch 12 charts manually in real-time. By the time you check Monthly, Weekly, Daily, H8, H4, H1, M30, M15, M5, and M1, the setup is gone or conditions changed. You need a system that aggregates timeframe confirmation into one view. This is critical for gold because XAUUSD moves fast. A bullish setup on H1 can turn bearish in 15 minutes if M5 structure breaks.
Multi-timeframe tables solve this. Imagine a dashboard showing BUY, SELL, or NEUTRAL for every timeframe at once. Monthly shows BUY, Weekly shows BUY, Daily shows BUY, H4 shows BUY, but H1 shows SELL. That divergence tells you to wait. Don't trade against the lower timeframe until it flips. When all timeframes from Daily down to M15 show BUY, your conviction increases. Your position size can increase slightly (within risk limits) because confluence is strong.
Use this for trade management too. You're in a long trade from 2,067 targeting 2,082. Price hits 2,077, and you check your timeframe table. H1 just flipped to SELL. H4 is still BUY, but M30 and M15 both show SELL. That's early warning of a reversal. You don't wait for your stop or target. You exit at 2,077, locking in a 10-pip gain instead of risking a reversal back to breakeven or a loss.
Timeframe divergence also prevents bad entries. You see a bullish setup on M5, but H1, H4, and Daily all show SELL. That M5 setup is a trap. You're buying into a larger downtrend. Even if the M5 move works for 10 pips, the higher timeframe pressure will likely reverse it. Skip the trade. Wait for alignment. Patience is your edge when timeframes disagree.
Gold Trading Psychology and Systematic Execution
Emotional trading kills gold traders faster than bad setups. Gold's volatility triggers fear and greed. You see a 50-pip move and jump in without confirmation, or you hold a losing trade hoping for a reversal instead of taking your stop. Both destroy accounts. The solution isn't willpower. It's a system that removes decisions.
Define your rules once. Write them down. Example: I only trade XAUUSD when Daily and H4 trends align, price is at VWAP or a session liquidity level, and the 15-minute chart confirms with a rejection candle. My stop is always 5 pips below structure. My target is always 2:1 minimum RR. I risk 1% per trade. These aren't suggestions. They're laws. Every trade, same process, zero exceptions.
Pre-trade checklists prevent emotional entries. Before clicking BUY or SELL, run through your list. Is Daily trend aligned? Yes. Is H4 confirming? Yes. Is price at a liquidity level? Yes. Is the 15-minute candle closed and confirmed? Yes. Is my RR at least 2:1? Yes. All boxes checked? Execute. One box unchecked? Walk away. This takes 30 seconds and saves you from 90% of bad trades.
Post-trade reviews build competence. Every Friday, review the week's trades. Calculate win rate, average RR, and whether you followed your rules. You'll notice patterns. Maybe you win 80% when you wait for all timeframes to align but only 50% when you rush entries. The data doesn't lie. Adjust your process based on results, not feelings. Research shows that systematic approaches using advanced forecasting techniques improve gold trading outcomes significantly compared to discretionary methods.
| Metric | Target | Review Frequency | Action If Below Target |
|---|---|---|---|
| Win Rate | 55-65% | Weekly | Check setup quality and entry timing |
| Average RR | 2:1 minimum | Weekly | Improve exits and stop placement |
| Rule Adherence | 95%+ | Weekly | Identify emotional triggers |
| Max Daily Drawdown | <3% | Daily | Reduce position size immediately |
| Max Account Drawdown | <8% | Monthly | Stop trading, review system |
Gold Trading on Crypto, Indices, and Stocks
Gold isn't isolated. It correlates inversely with the US dollar, moves with inflation expectations, and often trends opposite to risk assets like the S&P 500. Understanding these relationships gives you edge. When DXY (US Dollar Index) strengthens, gold typically weakens. When indices sell off during risk-off events, gold rallies as a safe haven. Use this for confluence.
You can trade gold exposure through multiple assets beyond XAUUSD. GLD (gold ETF) tracks spot prices and trades on stock market hours. GC (gold futures) offers leverage and tight spreads but requires futures account approval. Gold mining stocks like NEM or GOLD amplify gold's moves but add company-specific risk. Choose based on your account size, timeframe, and risk tolerance.
Crypto markets now include gold-backed tokens. These trade 24/7 like Bitcoin but track physical gold reserves. Useful for traders who want gold exposure with crypto liquidity. Apply the same multi-timeframe analysis. Daily trend, H4 setup, 15-minute entry, institutional levels. The asset class changes, but the methodology stays consistent.
Indices like XAU/USD (gold spot against US dollar) and ratios like gold/silver provide relative strength insights. When gold outperforms silver, it signals defensive positioning. When silver catches up, it suggests risk appetite returning. These relationships add context to your directional bias. You're not trading in isolation. You're reading the broader market structure and positioning accordingly.
Avoiding Common Gold Trading Mistakes
Overtrading gold is the fastest way to lose. XAUUSD moves all day across sessions tracked globally through markets like the Chinese Gold and Silver Exchange Society. That doesn't mean you should trade every move. Most price action is noise. Wait for your setup. If your system requires Daily uptrend + H4 pullback + VWAP test + 15-minute confirmation, you might only get 2-3 valid setups per week. That's enough. Quality over quantity.
Ignoring spreads and commissions destroys RR ratios. XAUUSD spread during London session might be 0.5 pips. During thin Asian hours, it widens to 2-3 pips. If you're targeting 10 pips and your spread is 3 pips, you need 13 pips of movement just to hit target. Your effective RR drops. Trade during high-liquidity sessions. Avoid news events unless your system specifically trades volatility.
Revenge trading after a loss compounds damage. You take a valid stop loss on a gold trade, feel frustrated, and immediately enter another trade without confirmation because you want to "get it back." This breaks your system. After a loss, step away for 30 minutes. Review the trade. Did you follow your rules? If yes, the loss is acceptable. If no, identify the mistake and avoid it next time. Never enter a new trade while emotional.
Not adapting to changing volatility kills accounts. Gold might average 50-pip daily ranges during quiet periods, then explode to 200-pip ranges during Fed announcements or geopolitical shocks. Your position sizing and stop distances must adjust. If normal volatility allows 20-pip stops, but today's ATR (Average True Range) is triple the norm, widen your stops or reduce position size to maintain the same dollar risk. Static approaches fail in dynamic markets.
Building a Repeatable Gold Trading Process
Consistency comes from repetition. Trade the same setups, same timeframes, same risk parameters until execution becomes automatic. You don't think about whether to enter. You check your criteria, see alignment, execute. Your brain shifts from decision-making to pattern recognition. This is where edge lives.
Document your process in a trading plan. Include market bias (long/short), timeframe confirmation requirements (which timeframes must align), entry criteria (specific price levels and confirmation signals), stop placement rules (pips below structure), target selection (RR ratio or next key level), and position sizing formula (1% risk per trade based on stop distance). Print this. Keep it visible. Reference it before every trade.
Backtest your process, but prioritize forward testing. Backtesting shows what worked historically. Forward testing proves it works now in live market conditions. Research into benchmark-neutral alpha strategies demonstrates the value of rigorous testing over extended periods. Paper trade your system for 30 days. Record every setup, entry, exit, and result. If your win rate and RR targets hold up, start with small live capital. Scale up only after proving consistency across 100+ trades.
Community and accountability accelerate improvement. Trading is isolated, but learning shouldn't be. Join groups where traders share setups, review trades, and hold each other to standards. Not signal groups where someone tells you what to trade. Peer groups where you dissect your own trades and get feedback. You learn faster when you explain your process to others and defend your decisions with data.
Gold trading rewards systematic thinking. Direction from higher timeframes. Entries at institutional levels. Management across multiple confirmations. Risk controlled through position sizing. Emotions removed through rules. This isn't complex. It's disciplined repetition of a proven process. Master the separation of direction and entry, respect your timeframe alignment, and execute with precision every time.
Gold trading success comes down to systematic execution across multiple timeframes with clear separation between directional bias and entry precision. Build your process around non-repainting signals, institutional liquidity levels, and multi-timeframe confirmation. PipTrend unifies these elements into one system-directional signals that don't repaint, session liquidity zones for precise entries, and a 12-timeframe table for instant confirmation. Whether you're trading Forex, Crypto, Indices, or Stocks, the same repeatable approach works. Start your 3-day free trial and see how a unified system eliminates guesswork.