
You open EUR/USD on the 5m chart. RSI says oversold. MACD crossed bullish. Volume is climbing. You enter long. Price drops 30 pips and stops you out. Then it rallies exactly where you thought. The problem wasn't your analysis. You confused direction with entry. Most traders stack indicators hoping for confirmation but end up with conflicting signals and late entries. The best trading indicators day trading professionals use in 2026 don't just show where price might go. They tell you when to pull the trigger and when to stay flat.
Understanding Direction vs. Entry Timing
Direction and entry are separate decisions. You need both. Most indicators only solve one.
A moving average crossover tells you the trend changed. It doesn't tell you where to enter. You chase price, enter at resistance, and watch your stop get hit before the move continues without you. MACD and RSI work the same way. They show momentum shifts but not precise entry zones. You need institutional levels for that.
Your 1-hour chart shows a bullish trend. Your 5-minute chart shows a bearish pullback. Which do you trade? If you enter on the 5m reversal signal without checking higher timeframes, you're selling into a freight train. If you wait for all timeframes to align perfectly, you miss the entry. The solution is a system where direction comes from higher timeframes and entries come from lower timeframe liquidity zones.
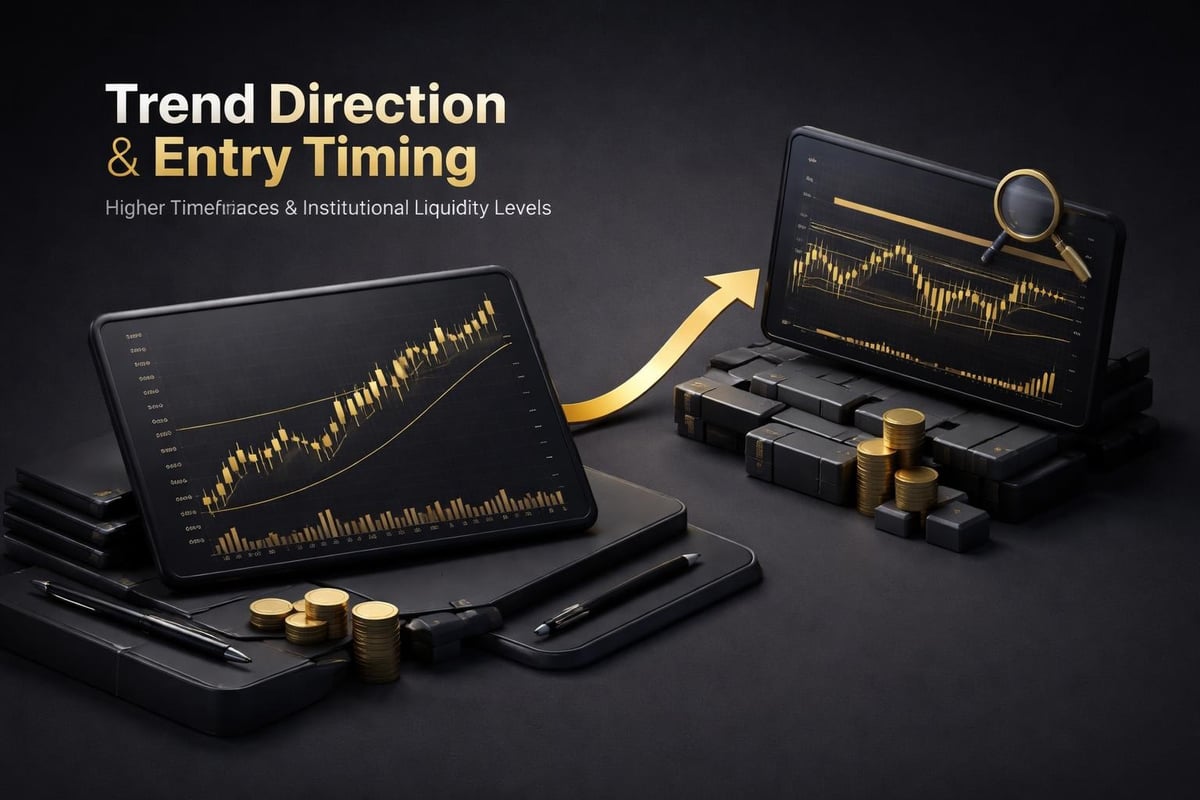
Timeframe Layering for Consistency
Use the Daily chart for bias. Use H8 or H1 for structure. Use 5m or 1m for entries. This isn't theory. It's how you avoid fighting the trend while still catching intraday moves.
If Daily shows an uptrend on EUR/USD, you only take longs on lower timeframes. If H1 shows price rejecting a supply zone, you wait. When 5m shows price tapping into VWAP or session lows with a bullish signal, you enter. Your risk-reward improves because you're buying at discount prices within a confirmed trend.
The Multi-Timeframe approach also tells you when not to trade. If Daily is bullish but H1 just broke structure to the downside, you're in no-man's-land. Sitting out bad setups is as important as taking good ones. Prop firm traders know this. One revenge trade after a stop-out can cost you 5% in a single session.
Weekly and Daily timeframes show you the bigger picture, but you can't enter there unless you're swinging. H8 and H4 give you swing structure. H1 gives you day trade structure. 5m and 1m give you scalp entries. If you're day trading, your bias comes from H1 or higher and your entries come from 5m or 1m. Always.
Core Indicators for Trend Direction
The best trading indicators day trading setups rely on start with non-repainting signals. Repainting indicators show you a buy signal in real-time, then remove it after the candle closes. You think you have confirmation. You don't. The signal was fake. By the time the candle closes, the opportunity is gone or reversed.
Moving averages don't repaint, but they lag. A 50-period EMA on the 5m chart is already 250 minutes behind. MACD detects momentum shifts but gives late entries. You see the crossover after price already moved 20 pips. RSI shows overbought and oversold conditions, but price can stay overbought for hours in a strong trend. You short into strength and get wrecked.
What you need is a signal that confirms after the candle closes, doesn't repaint, and integrates with higher timeframe bias. Directional systems like PipTrend Core and V2 solve this by giving you BUY or SELL labels only after confirmation. No guessing. No repaints. No second-guessing whether the signal will disappear.
How to Read Momentum Without Lagging
Momentum tells you if the move has energy. Price can trend up on weak momentum and collapse. It can pullback on strong momentum and resume. The Stochastic Oscillator compares closing price to the range. When it's above 80, price is near the top of its range. When it's below 20, price is near the bottom. But this doesn't mean reversal. In a strong uptrend, Stochastic stays above 80 for hours.
RSI works similarly. Above 70 is overbought. Below 30 is oversold. In a trending market, RSI can stay above 70 or below 30 indefinitely. If you short every time RSI hits 70, you'll get stopped out repeatedly. The better play is to use RSI for divergence. Price makes a higher high but RSI makes a lower high. That's momentum weakness. Now you have a reason to consider a reversal trade, not just an arbitrary number.
Volume confirms momentum. A breakout on low volume is weak. A breakout on high volume is strong. But volume alone doesn't give you entries. It's a filter. If your trend signal appears with strong volume, you take it. If volume is dead, you pass. Combine volume with directional signals and you filter out 40% of losing trades.
Entry Precision with Institutional Levels
Direction gets you in the right market. Entry gets you in at the right price. The difference is 10 pips or 50 pips of risk. That changes your risk-reward ratio from 1:1 to 1:5.
Institutional traders don't enter randomly. They enter at VWAP, session highs and lows, and supply and demand zones. These are liquidity levels where orders stack. When price taps into these zones, it either bounces or breaks. If you enter at these levels with the trend, your stop is tight and your target is wide.
VWAP is the average price weighted by volume. Institutions use it as a benchmark. If price is above VWAP, buyers are in control. If it's below, sellers are in control. When price pulls back to VWAP in an uptrend, that's your entry. Your stop goes just below VWAP. Your target is the next resistance level. Risk 10 pips to make 30. That's a 1:3 RR.
Session liquidity works the same way. The high of the day (HOD) and low of the day (LOD) are magnets. Price often retests these levels. If you're trading the London session and price breaks above the Asian session high, you wait for a pullback to that level. When price taps it and holds, you enter long. If it breaks, you stay out. This single filter eliminates emotional entries.
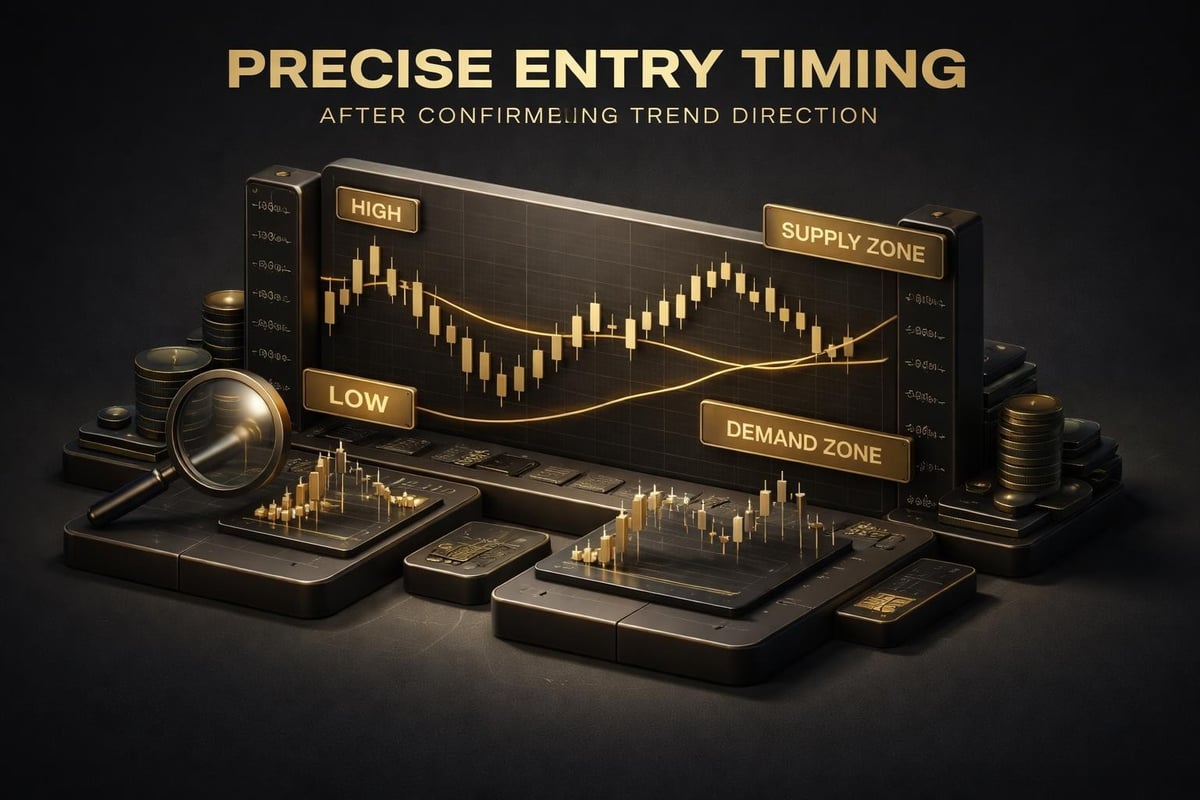
Supply and Demand Zones vs. Support and Resistance
Support and resistance are lines. Supply and demand are zones. This matters because price doesn't reverse on a single pip. It reverses in a range. A demand zone is where buyers previously overwhelmed sellers and price rallied sharply. When price returns to that zone, buyers are likely to step in again.
You don't enter at the top of a demand zone. You enter when price taps into it and shows rejection. On a 5m chart, that's a bullish engulfing candle or a hammer with strong volume. On a 1m chart, it's a series of higher lows after the initial tap. You're not predicting. You're reacting to institutional behavior.
Donchian Channels help you identify these zones automatically. The upper band is the highest high over X periods. The lower band is the lowest low. When price breaks above the upper band, that's a new supply zone forming. When it breaks below the lower band, that's a new demand zone. You mark these on your chart and wait for retests.
The key is to combine these zones with your directional bias. If the H1 chart shows an uptrend and price pulls back into a demand zone on the 5m chart, you take the long. If the H1 is in a downtrend and price rallies into a supply zone, you short. You're not fighting the trend. You're entering at the best possible price within the trend.
Managing Trades Across Multiple Timeframes
You enter on the 5m chart. Do you manage on the 5m chart? No. If you do, you'll get shaken out by noise. Your stop needs to respect the structure of the timeframe that gave you direction. Your target needs to align with the next key level on that timeframe.
Let's say you entered long on EUR/USD at 1.0850 based on a 5m bullish signal at a demand zone. Your directional bias came from the H1 chart, which showed an uptrend with the next resistance at 1.0920. You don't set your target at 1.0870 just because the 5m chart shows a small resistance there. You set your target at 1.0920. Your stop goes below the demand zone at 1.0835. That's 15 pips risk for 70 pips reward. RR is 1:4.67.
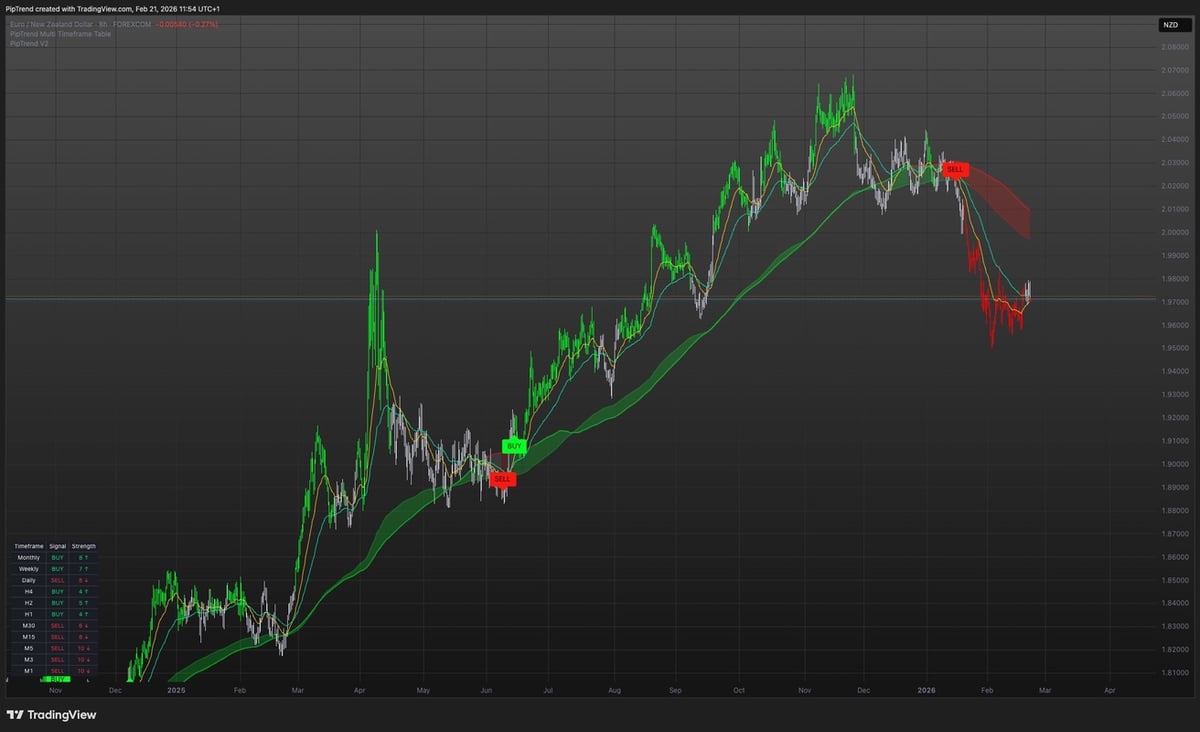
But what if the H1 chart starts showing weakness while you're in the trade? Maybe it breaks below a key support level or a lower timeframe shows a strong reversal signal. This is where a Multi-Timeframe Table becomes critical. You see all 12 timeframes at once. If 1m, 5m, and 15m flip bearish while H1 and H4 are still bullish, you tighten your stop. If H1 flips bearish, you exit immediately. You don't wait for your target. You adapt.
Position Sizing Based on Timeframe Risk
Your position size should match your timeframe. A 15-pip stop on a 5m chart isn't the same as a 15-pip stop on a Daily chart. The Daily stop has more weight. It's less likely to get hit by noise. The 5m stop is tighter but more vulnerable.
If you're risking 1% of your account per trade, your position size changes with your stop distance. A 15-pip stop on a $10,000 account risking 1% means you can trade 6.67 mini lots. A 50-pip stop means you can only trade 2 mini lots. Tighter stops from precise entries let you trade larger size with the same risk. This is how you scale without blowing your account.
Prop firm traders live by this. A 5% daily drawdown limit means you can't afford wide stops. You need tight entries at institutional levels. If your average stop is 50 pips, you can only take two 1% trades before you're close to your limit. If your average stop is 15 pips, you can take six trades. More trades mean more opportunities to hit your profit target and pass the challenge.
The best day trading indicators give you the precision you need to keep stops tight. But precision without a system is luck. You need repeatable rules that work on Forex, Crypto, Indices, and Stocks. The same entry logic on EUR/USD should work on BTC/USD or NAS100. If it doesn't, your edge is fragile.
Building a Repeatable System for Consistency
The best trading indicators day trading professionals use fit into a system, not a collection. You don't need fifteen indicators. You need three roles: direction, entry, and management. Each role has a tool. Each tool works together.
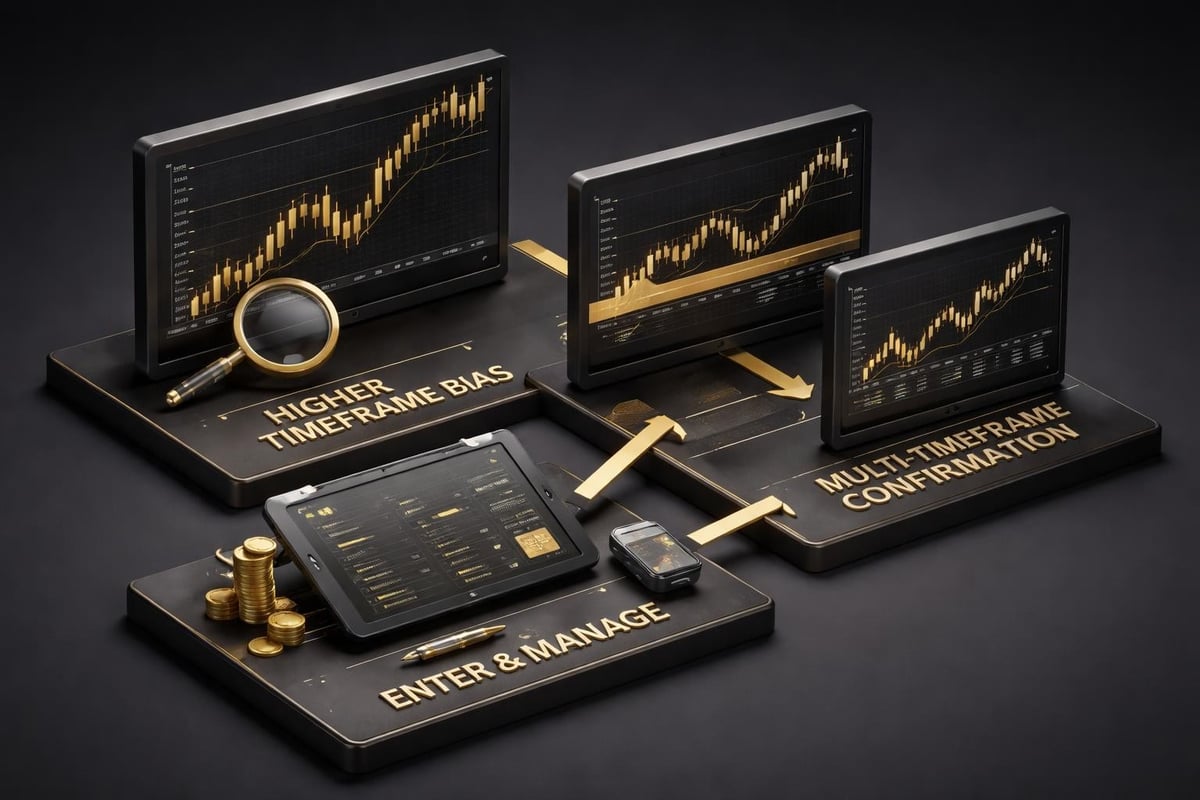
Direction comes from a non-repainting signal on a higher timeframe. Entry comes from liquidity levels on a lower timeframe. Management comes from multi-timeframe confirmation and RR targets. If any piece is missing, your system has a hole. You'll make money randomly but lose it back systematically.
Here's a repeatable process. Step one: check the Daily and H1 charts for bias. If both are bullish, you only look for longs. Step two: drop to the 5m chart and mark VWAP, session highs/lows, and demand zones. Step three: wait for price to tap one of these levels and show a bullish signal. Step four: enter with a stop below the zone and a target at the next H1 resistance. Step five: monitor the Multi-Timeframe Table. If lower timeframes flip, tighten your stop. If higher timeframes flip, exit.
This process works on any pair, any session, any market condition. You're not discretionary trading. You're following a checklist. Discretionary traders have good days and bad days. Systematic traders have consistent days. Even losing days follow the plan.
Real Numbers from Real Trades
A 1:3 RR means you risk 10 pips to make 30. If you win 50% of the time, you're profitable. Win 10 trades and lose 10 trades. You lose 100 pips and win 300 pips. Net profit: 200 pips. That's the math. But most traders don't hit 50% because they take low-quality setups. They enter without confirmation. They trade against the trend. They move their stop.
If you only take setups where all timeframes align, your win rate climbs to 60% or higher. Now you win 12 trades and lose 8. You lose 80 pips and win 360 pips. Net profit: 280 pips. The difference between 200 pips and 280 pips over a month is the difference between a $2,000 account and a $10,000 account in six months with proper compounding.
These aren't backtested numbers. They're forward-tested results from traders who follow a system. Backtests lie because they optimize for past data. Forward tests show you what happens in live market conditions with slippage, spread, and emotion. If your system works forward, it's robust. If it only works backward, it's curve-fitted.
Adapting Indicators Across Asset Classes
Forex, Crypto, Indices, and Stocks all move differently, but the principles stay the same. Trend direction, precise entry, and multi-timeframe management work across all of them. The settings change slightly, but the logic doesn't.
Forex pairs like EUR/USD and GBP/USD respect support and resistance more cleanly than Crypto. Bitcoin can rip through levels on a single news event. But VWAP still works. Session liquidity still works. The difference is your stop needs to be slightly wider on Crypto to account for volatility. A 15-pip stop on EUR/USD might be a 50-pip stop on BTC/USD.
Indices like NAS100 and US30 trend stronger than Forex. Once they start moving, they keep moving. Your RR targets can stretch to 1:5 or 1:6 because the momentum carries. But the entry logic is identical. Wait for a pullback to VWAP or a demand zone, confirm the direction on the H1 chart, and enter on the 5m chart.
Stocks require more filtering. Not every stock is liquid enough to day trade. You need volume. You need volatility. You need a catalyst. But once you find a stock with those conditions, the same system applies. Check the Daily for bias. Mark key levels. Enter at liquidity zones. Manage with multi-timeframe confirmation.
Session-Specific Strategies for Forex
London session is the most volatile. New York session has the most liquidity. Asian session is the quietest. If you're trading EUR/USD, you want to be active during London and New York overlap. That's when the big moves happen. During Asian session, price chops. Your signals are less reliable.
Session liquidity levels reset every session. The high and low of the London session are different from the high and low of the New York session. When New York opens and price breaks above the London high, that's a breakout setup. When it pulls back to the London high and holds, that's a retest setup. Both are high-probability if your directional bias supports them.
Some traders only trade the first two hours of London. Others only trade New York open. The session you choose depends on your schedule, but the system stays the same. You adapt your timeframes and your targets, not your rules.
For Crypto, sessions don't exist the same way, but liquidity patterns do. Bitcoin volume spikes during U.S. hours. It dies during Asian hours. If you're trading BTC/USD, you trade when volume is high. Low volume equals low probability. Your system should tell you when to sit out, not just when to enter.
Avoiding Common Indicator Mistakes
Most traders add indicators until their chart looks like a Christmas tree. Eight moving averages, three oscillators, two volume tools, and a Fibonacci grid. They think more information equals better trades. It doesn't. It equals confusion.
Every indicator you add introduces a new decision point. If the 50 EMA says buy but the 200 EMA says sell, which do you follow? If RSI says oversold but MACD says bearish, what's your play? You freeze. You second-guess. You enter late or not at all. Simplicity beats complexity every time.
Another mistake is ignoring timeframe hierarchy. Your 1m chart will always be noisier than your Daily chart. If you let the 1m chart override your Daily bias, you'll lose. The Daily chart sets the context. The 1m chart gives you entries within that context. Never flip that relationship.
Traders also chase signals. They see a buy signal and enter immediately without checking structure. Price is at resistance. Volume is low. Higher timeframes are bearish. But the signal is green, so they enter. This is how you turn a 60% system into a 40% system. Signals are tools, not commands. You still need discretion within your rules.
Free Indicators vs. Unified Systems
Free indicators show you one thing. RSI shows momentum. MACD shows crossovers. VWAP shows average price. You have to interpret how they fit together. You have to decide which timeframe to prioritize. You have to manage the trade manually. That's fine if you have years of experience. If you don't, you're stitching together pieces that weren't designed to work as one.
A unified system like PipTrend solves this by integrating direction, entry, and management into one workflow. You don't need to guess whether your 5m signal conflicts with your H1 bias. The system shows you. You don't need to manually check twelve timeframes. The table does it for you. You're trading a process, not a collection of tools.
This approach works especially well for prop firm traders who need tight risk management and repeatable setups. One bad trade can violate drawdown limits. You can't afford to wing it. You need a system where every trade follows the same rules. Same entry logic. Same stop placement. Same exit criteria. The only variable is the market condition, and your system adapts to that automatically.
Combining Indicators for Confirmation
Confirmation doesn't mean waiting for every indicator to agree. It means checking that your direction, entry, and management all support the trade. If your H1 chart shows a bullish trend, your 5m chart taps a demand zone, and your Multi-Timeframe Table shows alignment, that's confirmation. If any piece is missing, you wait.
Layering works better than stacking. Stacking means using three momentum indicators to confirm momentum. That's redundant. Layering means using one tool for direction, one for entry, and one for management. Each tool has a distinct role. No overlap. No redundancy. No confusion.
Some traders use Bollinger Bands with RSI. When price hits the lower band and RSI is oversold, they buy. That works in ranging markets. In trending markets, price can ride the lower band for hours while RSI stays oversold. You end up catching a falling knife. The better approach is to use Bollinger Bands as a volatility filter. When the bands are wide, volatility is high. When they're tight, volatility is low. You trade breakouts when bands are tight and reversals when bands are wide. That's layering, not stacking.
When to Exit Based on Indicator Signals
Your exit isn't just your target. It's also your stop, your breakeven adjustment, and your trailing stop. If you set a 1:3 RR and walk away, you miss opportunities to lock in profit or cut losses early.
When price moves 1R in your favor, move your stop to breakeven. You risked 10 pips to make 30. Once you're up 10 pips, your stop goes to entry. Now the trade is risk-free. If price reverses, you lose nothing. If it continues, you still get your 30 pips. This single adjustment increases your profitability by 15-20% over a year.
When price moves 2R in your favor, trail your stop. You're up 20 pips on a 30-pip target. Move your stop to +10 pips. If price reverses, you still walk away with 10 pips. If it hits your target, you get the full 30 pips. You're protecting profit while letting the trade breathe.
If a higher timeframe flips before your target, exit immediately. Don't hope. Don't hold. The market is telling you the move is over. If you ignore it, your 20-pip profit turns into a 10-pip loss. Trust your system over your emotions.
The best trading indicators day trading systems use don't work in isolation. They work together: direction from higher timeframes, entry at institutional liquidity levels, and management through multi-timeframe confirmation. When you separate these roles and follow repeatable rules, your consistency improves and your drawdowns shrink. PipTrend gives you that system in one package with non-repainting signals, session liquidity tools, and a 12-timeframe table, so you're trading a proven process instead of guessing. Start your 3-day free trial and see how a unified approach changes your results.