
You spot what looks like a perfect hammer on the Daily chart. You enter long. Price drops 50 pips before you hit your stop. This happens because you saw direction but ignored the entry timing. A hammer candlestick chart pattern tells you sentiment might reverse, but it doesn't tell you where to get in or when higher timeframes confirm. Most traders blur these two decisions together and wonder why textbook patterns fail. The hammer shows potential. Your job is to verify it across timeframes and find the precise entry level where institutional liquidity sits.
What Makes a Hammer Candlestick Chart Pattern Valid
A hammer forms when price opens, drops significantly during the session, then rallies to close near the open. The lower wick should be at least twice the length of the body. The body sits at the top of the candle range. No upper wick or a very small one. This structure shows sellers pushed price down hard, then buyers stepped in with enough force to reclaim nearly all the lost ground before the candle closed.
The hammer candlestick pattern’s reliability depends on where it appears. You need a prior downtrend. A hammer at resistance or mid-range holds no weight. A hammer at a Weekly support level after a 300-pip decline carries real information. The context defines the signal strength.

Check the body color. Green or red doesn't matter as much as the wick-to-body ratio and the close location. A red hammer where price closed above the open by only 5 pips still qualifies if the lower wick shows strong rejection. A green hammer with a massive lower wick works even better. You're reading the battle between buyers and sellers, not just the final scoreboard.
Volume adds confirmation but isn't required. Higher volume on the hammer candle shows more participation in the reversal attempt. Low volume hammers can still work if they form at significant support confluences. Don't discard a hammer just because volume looks average. Verify the price action structure first, then add volume as extra evidence.
Timeframe Selection Changes Everything
Direction and entry are separate decisions. The Daily chart shows a hammer at support, so you know the potential direction is bullish. That doesn't mean you enter on the Daily close. You drop to H1 or H4 to find where price tests the hammer low, holds, then shows strength. Your entry comes when shorter timeframes confirm the Daily bias with their own bullish structure.
Run the same hammer through multiple timeframes before you commit capital. If the Daily shows a hammer but H8 is still in a clear downtrend with lower highs, you wait. If H4 shows a hammer at the same level and then breaks above the previous H4 high, now you have alignment. Understanding candlestick patterns across timeframes prevents you from fighting conflicting signals.
| Timeframe | Role | What You Check |
|---|---|---|
| Weekly/Daily | Direction bias | Hammer at major support/resistance |
| H8/H4 | Trend confirmation | Higher lows forming after hammer |
| H1/5m | Entry precision | Retest of hammer low, rejection, break of structure |
Your 1m and 5m charts handle execution. You see the Daily hammer, confirm H4 aligns, then watch 5m for a retest of the hammer low. When 5m holds that low and breaks the previous 5m high, you enter. Your stop sits below the hammer low. Your target comes from the next resistance level identified on H4 or Daily. This layered approach turns a simple pattern into a systematic process.
Swing traders focus on Daily and H4 hammers with H1 entries. Day traders use H1 hammers with 5m entries. Scalpers might trade 5m hammers confirmed by 1m, but the risk-reward gets tighter. Match your timeframe selection to your trading style and the time you can monitor positions.
Where to Enter After Spotting the Hammer
You don't enter on the hammer candle close. You wait for confirmation. Confirmation means the next candle opens, price tests the hammer low without breaking it, and then moves higher. Or the next candle immediately breaks above the hammer high with momentum. Both scenarios confirm that buyers defended the level shown by the hammer's rejection wick.
The retest entry offers better risk-reward. Price comes back down to the hammer low, forms a bullish engulfing or another small hammer on a lower timeframe, then reverses. Your entry is at that reversal point with a stop 10-20 pips below the hammer low depending on the pair's average true range. Your reward potential stays large because you entered near the absolute low rather than chasing after price already moved.
Breakout entries work when you can't afford to wait. The candle after the hammer closes above the hammer high. You enter the break with a stop below the hammer low. Your risk increases because you're further from your stop level, but you gain certainty that buyers have control. For prop firm traders managing tight drawdown limits, the retest entry preserves capital better. The breakout entry works when momentum is your edge.
Avoid entering inside the hammer body. That's no man's land. You don't know if price will test the low again or break the high. Wait for one of those two events to declare themselves. Patience here saves you from getting chopped out by indecision candles that follow weak hammers.
Institutional Liquidity Levels Improve Hammer Entries
Support and resistance alone miss half the picture. Price hunts liquidity. VWAP, session highs and lows, previous day highs and lows, and supply/demand zones all act as magnets where institutional orders sit. When your hammer forms exactly at one of these levels, the probability of follow-through increases.
A hammer at the London session low tells you European market makers defended that level. A hammer at VWAP during New York session shows where the day's average participants stepped in. A hammer at a monthly support level that has held for three months carries the weight of long-term positioned traders. You're not just reading a pattern. You're reading where big money decided to act. Learning how liquidity drives price action turns patterns from discretionary art into systematic edges.

Plot your session high/low lines on every chart. Mark VWAP if your platform supports it. Identify the last three swing highs and lows on Daily. When a hammer appears at the exact confluence of Daily support, H4 demand zone, and the previous week's low, you just found a high-probability setup. Your entry becomes the retest of that level on H1 with a stop below it. Your target is the next session high or the opposing supply zone.
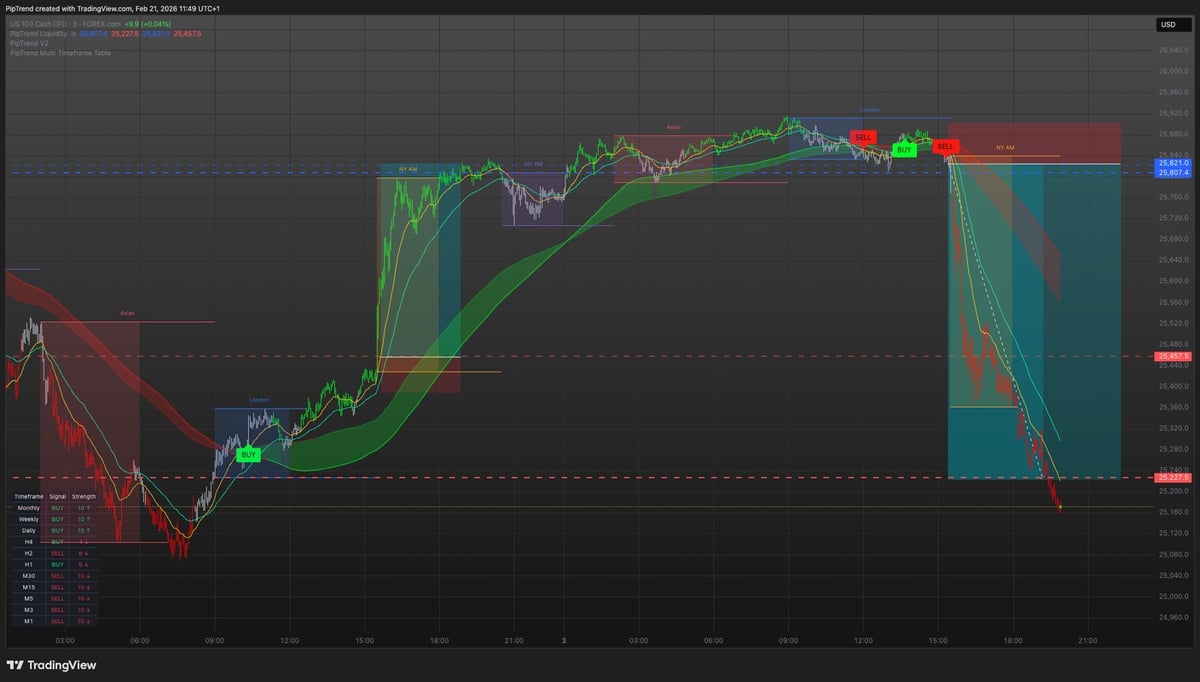
This is where having a unified system helps. Trying to manually track direction on one indicator, liquidity levels on another, and multi-timeframe confirmation on spreadsheets creates errors. For traders who want this integrated without chart clutter, PipTrend’s Session Liquidity component plots these institutional levels automatically while the Core indicator shows direction and the Multi-Timeframe Table confirms alignment across 12 timeframes simultaneously. You see the hammer, check if it's at a marked liquidity level, verify higher timeframes agree, and execute with your predefined stop and target.
Risk Management Numbers That Work
Your position size should risk 1-2% of your account on any single hammer setup. If you're trading a $10,000 account, that's $100-$200 risk per trade. Measure the distance from your entry to your stop in pips. Divide your dollar risk by pip value to get your lot size. A 30-pip stop with $100 risk on EUR/USD means 0.33 lots.
Target minimum 2:1 reward-to-risk. If your stop is 30 pips below the hammer low, your target needs to be at least 60 pips above your entry. Better setups offer 3:1 or 4:1. A hammer at Daily support with the next resistance 150 pips away and your stop only 40 pips gives you 3.75:1. Those are the setups you load size into, not the marginal 1.5:1 trades where the next resistance sits too close.
Prop firm traders need tighter discipline. Most firms cap daily loss at 5% and total drawdown at 10%. Three losing hammer trades at 2% risk each puts you at 6% total drawdown. You can't afford sloppy entries. Wait for the retest. Confirm with higher timeframes. Enter only when all three align: hammer at key level, higher timeframe agreement, lower timeframe entry trigger. This keeps your win rate high enough that drawdown stays controlled even when you hit normal losing streaks.
Scale your position based on confluence. A hammer at one support level gets 1% risk. A hammer at the confluence of Weekly support, Daily demand zone, and previous month low gets 2% risk because probability increased. Don't scale past 2% on a single setup. Even perfect setups fail. Risk management keeps you in the game when they do.
Combining Hammers with Trend Structure
A hammer against the trend is a fade. A hammer with the trend is a continuation entry. Know which one you're trading. If the Weekly chart shows a clear uptrend with higher highs and higher lows, and price pulls back to Weekly support where a Daily hammer forms, you're trading trend continuation. Your probability just jumped because you have both pattern and structure aligned.
Hammer candlestick patterns in context of market structure matter more than the pattern alone. Check if the hammer forms at a higher low in an uptrend. That's a buy signal. A hammer at a lower high in a downtrend might be a short-term bounce, but the primary trend still points down. You can trade the bounce, but your targets should be conservative and your stop tight.
Trend lines and moving averages add clarity. If price is above the 200 EMA on Daily and forms a hammer at the 50 EMA, you have a defined support level and trend confirmation. Your entry is the retest of the hammer low. Your stop goes below the hammer and the 50 EMA. Your target is the previous Daily high or the next resistance zone.
Counter-trend hammer trades require faster exits. You're catching a bounce in a downtrend. Set your target at the nearest resistance, take profit when you hit 2:1, and don't expect the reversal to turn into a full trend change. The majority of hammers in strong trends are just pauses, not reversals. Respect the larger structure.
Reading Failed Hammers Before They Cost You
Not every hammer works. Failed hammers teach you what to avoid. A hammer forms, the next candle opens and immediately breaks below the hammer low with momentum. That's a failed hammer. It signals that the selling pressure was stronger than the hammer suggested. Your job is to recognize this quickly and either avoid the trade or exit immediately if you already entered.
Volume precedes failure. A hammer on declining volume with the next candle showing a volume spike to the downside tells you sellers are in control despite the hammer's appearance. Compare the hammer candle volume to the average volume of the prior 10 candles. If it's below average, treat the signal skeptically.
Higher timeframe context reveals weak hammers. A 5m hammer looks perfect until you check H1 and see price is in the middle of a range with no support nearby. That 5m hammer has no structural backing. It's noise. Only trade hammers that align with support or demand zones on at least one higher timeframe.

Watch the candle immediately after the hammer. If it's a doji or inside bar, the market is undecided. If it's a strong bullish engulfing that closes above the hammer high, you have confirmation. If it's a bearish candle that closes below the hammer midpoint, your signal is already negated. Let the market tell you whether the hammer holds weight before you commit capital.
Practical Hammer Setups Across Asset Classes
Forex pairs with clear ranges work best for hammer patterns. EUR/USD, GBP/USD, and USD/JPY show defined support and resistance where hammers form repeatedly. Exotic pairs with erratic spreads and low liquidity produce more false hammers. Stick to majors and major crosses until you've proven your hammer strategy works consistently.
Crypto markets respect hammers at psychological levels. BTC/USD at $30,000, $40,000, or $50,000 often shows hammer formations when price tests these round numbers. The volatility is higher, so your stop needs more room. A 50-pip stop on EUR/USD might translate to a 200-pip stop on BTC/USD depending on the timeframe. Adjust your position size accordingly to maintain the same percentage risk.
Indices like SPX, NAS100, and US30 print reliable hammers at session lows and previous day lows. Day traders watch for hammers during the first hour of New York session when volatility peaks. Your entry is the retest on a 5m chart. Your stop sits below the session low. Your target is the previous session high or the day's VWAP.
Stocks require sector context. A hammer on a tech stock during a sector-wide selloff might fail because the broader trend overwhelms individual patterns. A hammer on a defensive stock during market uncertainty with sector rotation into safety has better odds. Check sector performance before trading stock hammers. Detailed analysis of hammer pattern performance shows this context dependency clearly across different markets.
Building a Repeatable Hammer Trading System
Write down your rules before you trade another hammer. Which timeframes will you scan for hammers? Daily and H4 only. What constitutes a valid hammer? Lower wick at least 2x the body, small or no upper wick, formed at identified support or liquidity level. What confirms the hammer? Next candle closes above hammer high or price retests hammer low and rejects. What's your entry trigger? Retest rejection on a lower timeframe. What's your stop? 10 pips below the hammer low on Forex, adjusted for volatility on other assets. What's your target? Minimum 2:1 RR to next resistance or supply zone.
Test your rules on 50 historical hammers before you risk live capital. Open your chart. Scroll back six months. Mark every valid hammer according to your rules. Record the entry price, stop, target, and outcome. Calculate your win rate and average RR. If you're not hitting at least 50% win rate with 2:1 average RR, your rules need refinement. Maybe your timeframe combination is off. Maybe you're not waiting for proper confirmation. The data will show you.
Track every live hammer trade in a journal. Screenshot the setup. Record the timeframe, the confluence factors (support level, liquidity zone, higher timeframe trend), your entry price, stop, target, and the reasoning. After 30 trades, review your journal. You'll see patterns in what works and what fails. Hammers at session lows might work better than hammers at mid-range support. Hammers with higher timeframe trend alignment might deliver better RR than counter-trend hammers. Use this feedback to tighten your rules.
Automation helps consistency. Set alerts when hammers form at your predefined support levels on your chosen timeframes. You don't need to watch charts all day. The alert fires, you check the setup against your rules, you execute if it qualifies. Alerts prevent you from forcing trades on patterns that don't meet your criteria. They also prevent you from missing valid setups because you weren't watching that particular pair.
Common Mistakes That Kill Hammer Profits
Entering on the hammer close without confirmation wastes RR potential. You enter at the high of the hammer instead of waiting for a retest near the low. Your stop still goes below the low, so your risk increased but your reward stayed the same. Wait one candle. Let price either break the high with momentum or retest the low. Both scenarios give you better entry prices.
Ignoring timeframe alignment turns winning patterns into losers. A perfect 5m hammer means nothing if H1 is still making lower lows. You're trading against the flow. Either wait for H1 to confirm with its own structure break or skip the trade entirely. Multi-timeframe confirmation isn't optional. It's the filter that separates systematic traders from gamblers.
Setting targets based on arbitrary pip counts instead of structure leaves money on the table or gets you stopped out prematurely. Your target should be the next resistance level, supply zone, or session high. If that's 150 pips away and your stop is 30 pips, you have a 5:1 setup. Take it. If the next resistance is only 40 pips away with a 30-pip stop, your 1.3:1 RR isn't worth the trade. Structure defines your targets, not round numbers.
Moving stops to breakeven too early kills trades that need room to breathe. Price retests the hammer low, you entered the rejection, then price chops around for three candles near your entry. You move your stop to breakeven. The next candle wicks down 15 pips (not hitting the original stop placement), then rallies 80 pips to your target. Your breakeven stop took you out. Let your original stop work until price moves at least 1:1 in your favor.
How Hammers Fit into Your Complete Trading Edge
The hammer candlestick chart pattern is one signal in a complete system. You need direction from higher timeframes. You need entry precision from liquidity levels. You need exit rules from resistance structure and RR targets. You need position sizing from your risk parameters. The hammer is the trigger, not the entire strategy.
Unlike tools that repaint signals after candles close, verified hammers are final when the candle closes. What you see is what you get. This transparency lets you backtest accurately and trust forward performance. Free chart patterns show you direction but don't integrate entry timing or multi-timeframe confirmation. You're left assembling pieces manually, which introduces errors and hesitation.
Systematic traders build checklists. Higher timeframe shows uptrend or support level? Check. Hammer formed at that level? Check. Lower wick at least 2x body? Check. Next candle confirms or retest rejects? Check. Entry trigger on execution timeframe? Check. Stop placement allows 2:1 minimum RR to next resistance? Check. All boxes checked means you trade. One box unchecked means you wait. This removes emotion and creates repeatability.
Prop firm traders benefit most from systematic hammer trading. You're not trying to hit home runs. You're stacking 2:1 and 3:1 wins while keeping drawdown under 5%. Hammer setups at clear levels with tight stops and defined targets fit that mandate perfectly. Your edge isn't the hammer. Your edge is the discipline to only trade the hammer when all your conditions align.
A hammer candlestick chart pattern gives you a potential reversal signal, but direction, entry timing, and multi-timeframe confirmation turn potential into profitable trades. The difference between spotting a hammer and systematically trading one separates consistent traders from those who struggle. If you want a unified system that shows you trend direction through non-repainting signals, pinpoints entries at institutional liquidity levels, and confirms alignment across 12 timeframes without cluttering your chart, explore how PipTrend integrates all three decisions into one repeatable process built for Forex, Crypto, Indices, and Stocks.