
You close a swing trade on EUR/USD after holding for four days. The direction was correct. The trend never reversed. But your entry timing cost you 80 pips of drawdown before the move finally came. You held through the pain because the H8 chart looked clean, but your 1:2 risk-reward ratio turned into breakeven after spread and sleepless nights. This is the swing trader's dilemma. Direction and entry are separate decisions, and most indicators only solve one. You need tools that show you when the trend is confirmed and where institutional liquidity sits so you're not guessing on a clean chart with price 200 pips away from your ideal entry.
Why Most Indicator Combinations Fail Swing Traders
Swing trading demands patience across 1-hour to Daily timeframes. You're not scalping 5-minute wicks. You're holding EUR/JPY for 3-7 days, targeting 150-300 pips while managing a prop firm's 5% daily drawdown limit. The challenge is not finding bullish divergence or an oversold RSI reading. The challenge is knowing which timeframe to trust when H1 says buy, H4 says wait, and Daily is mid-pullback.
Most traders stack moving averages, oscillators, and volume tools hoping confirmation will emerge. Instead, you get conflicting signals. The 50 EMA crosses the 200 EMA on the Daily chart, but the Stochastic Oscillator shows overbought on H4. Do you enter or wait? The answer depends on whether you're trading direction or timing an entry. These are not the same decision.
Understanding the Relative Strength Index helps you spot momentum shifts, but RSI alone won't tell you if institutional buyers are defending VWAP or if today's high is a liquidity grab. Free tools show lagging confirmation. You need leading context, and that requires knowing what each indicator actually measures.
Moving Averages and Trend Confirmation on Higher Timeframes
The best technical indicators for swing trading start with trend filters, not entry signals. You need to know if price is trending or chopping before you risk capital. Simple Moving Averages (SMA) and Exponential Moving Averages (EMA) serve this role, but only when you apply them correctly across multiple timeframes.
Use the 50 EMA and 200 EMA on the Daily chart to establish primary trend direction. When price trades above both and the 50 EMA sits above the 200 EMA, you have an uptrend. When price is below both and the 50 EMA is under the 200 EMA, you have a downtrend. Anything else is consolidation, and swing trades in choppy markets drain accounts through false breakouts and whipsaw losses.
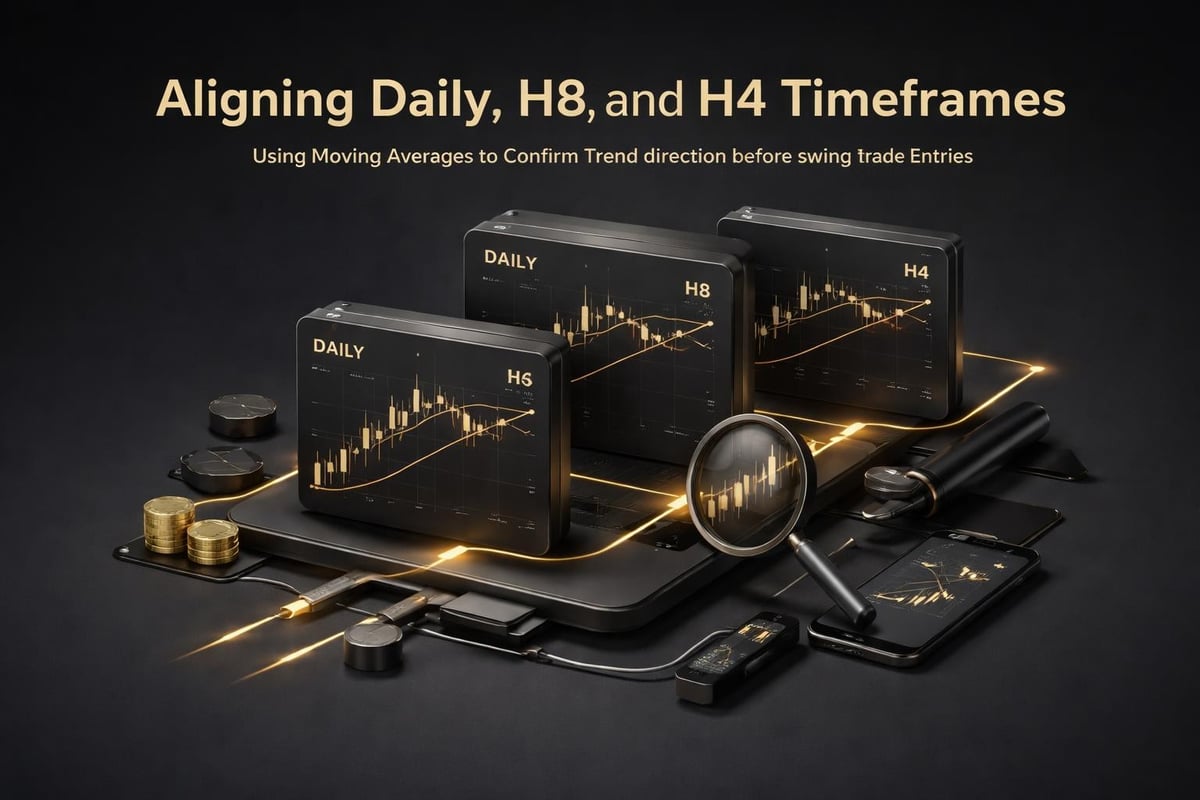
Once the Daily chart confirms trend direction, drop to H8 and H4 for entry timing. Look for pullbacks to the 20 EMA on H4 while the H8 chart holds structure. This is where many traders fail. They see the pullback and enter immediately, ignoring whether the pullback is stopping at a logical level. You're not trading the pullback. You're trading the reaction to the pullback at a level where institutions are likely positioned.
Combining EMAs With Price Action Levels
Your 20 EMA on H4 means nothing if it's sitting in the middle of a supply zone or 50 pips above the session VWAP. The Exponential Moving Average reacts faster to price changes, making it useful for dynamic support and resistance, but static levels matter more. Institutional orders cluster at round numbers, previous day highs and lows, and VWAP.
Mark these levels on your chart before you look at moving averages. If your 20 EMA pullback aligns with the previous session's low and VWAP, you have confluence. If the EMA is floating in dead space, wait. This is why direction and entry are separate. The trend can be bullish on Daily and H8, but if H4 price is pulling back into resistance instead of support, your entry timing will cost you drawdown even if the trade eventually works.
Oscillators That Actually Matter for Swing Entries
Oscillators measure momentum, not price levels. The Stochastic Oscillator compares current close to the recent range, giving you a 0-100 reading. When it drops below 20, price is oversold relative to recent action. When it climbs above 80, price is overbought. This sounds useful until you realize strong trends stay overbought or oversold for days.
You don't trade Stochastic signals in isolation. You use them to confirm divergence or spot exhaustion after you've identified trend direction and located your entry level. If GBP/USD is in a Daily uptrend, price pulls back to H4 support, and the Stochastic crosses up from oversold, you have a timing signal. If price is mid-range and Stochastic crosses up from 40, you have noise.
RSI for Divergence and Momentum Shifts
The Relative Strength Index measures momentum over 14 periods by default. Settings of 14 work across H1, H4, and Daily charts. RSI above 70 signals overbought conditions, below 30 signals oversold. Like Stochastic, RSI in isolation is useless for swing trading because trending markets ignore overbought and oversold readings.
RSI becomes valuable when it diverges from price. If EUR/USD makes a new high but RSI makes a lower high, momentum is weakening. This is bearish divergence, and it warns of a potential reversal or deep pullback. If price makes a new low but RSI makes a higher low, you have bullish divergence. Divergence doesn't give you an entry. It gives you a warning to tighten your stops or prepare for a trade in the opposite direction.
Combine RSI divergence with support and resistance. If you spot bearish divergence while price tests a major Daily resistance zone, you have a high-probability short setup. If divergence appears mid-trend with no structural resistance nearby, it's a yellow flag, not a red one.
Volatility Indicators for Position Sizing and Stop Placement
Swing trades fail when your stop is too tight for current volatility or your position size assumes calm markets during a news event. Average True Range (ATR) measures average candle range over 14 periods, showing you how much an asset typically moves per candle.
If EUR/USD's Daily ATR is 80 pips, you can't use a 30-pip stop and expect to survive normal price movement. Your stop needs to sit at least 1x ATR away from your entry, preferably 1.5x ATR if you're trading a prop firm account with strict drawdown rules. ATR also determines your position size. If your account risk per trade is 1% and your stop is 120 pips based on 1.5x ATR, you calculate lot size to lose 1% when price hits that 120-pip stop.
ATR changes with market conditions. During low-volatility Asian sessions, Daily ATR might drop to 60 pips. During NFP or Fed announcements, it spikes to 150 pips. Adjust your stops and position sizing based on current ATR, not your assumptions. This keeps you in trades during normal pullbacks and prevents overleveraging during volatile periods.
Bollinger Bands for Breakout and Mean Reversion Context
Bollinger Bands plot a moving average with upper and lower bands set at 2 standard deviations. When price touches the upper band, it's extended relative to the average. When it touches the lower band, it's compressed. Bands expand during volatility and contract during consolidation.
Use Bollinger Bands to distinguish between breakout and mean reversion environments. If bands are wide on the Daily chart and price is riding the upper band, you're in a trending breakout. Don't fade it. If bands are tight and price is oscillating between them, you're in a range. Trade the bounce off the bands back toward the middle.
For swing traders, Bollinger Bands work best on H4 and Daily charts. When price touches the lower band during a Daily uptrend, it signals a potential long entry if other factors align. When price breaks out of a contracted band with volume, it signals the start of a new swing move. You're not trading the bands themselves. You're using them to interpret whether price action is normal or abnormal for current conditions.
Trend Strength Indicators and Multi-Timeframe Confirmation
The Average Directional Movement Index (ADX) measures trend strength, not direction. ADX above 25 signals a strong trend. Below 20 signals weak trend or consolidation. ADX doesn't care if the trend is up or down. It only tells you if price is moving with conviction.
Pair ADX with directional indicators (DI+ and DI-) to separate strong uptrends from strong downtrends. When ADX is above 25 and DI+ is above DI-, you have a strong uptrend. When ADX is above 25 and DI- is above DI+, you have a strong downtrend. When ADX is below 20, don't swing trade. Wait for clarity.
Swing traders use ADX to filter trades. If your Daily chart shows ADX below 20, avoid new positions. The market is consolidating, and breakouts will likely fail. If ADX is climbing through 25 while price breaks structure, the trend has momentum. Your swing trade has room to run.
Managing Trades Across 12 Timeframes
You enter a swing trade on H4. The Daily chart confirms trend direction. But what about H8? What about the Weekly chart that's approaching a major resistance zone? What if the 5-minute chart is forming bearish divergence while you're holding long? Most traders check 2-3 timeframes before entry, then ignore everything else until the trade hits target or stop.
This is where a multi-timeframe confirmation table becomes critical. You need visibility into 12 timeframes simultaneously. When H1, H4, H8, Daily, and Weekly all align in the same direction, your swing trade has the highest probability. When lower timeframes like 5m and 15m start flipping bearish while you're holding a Daily long, you know to tighten your stop or take partial profits.
A unified system that shows all timeframes in one view eliminates guesswork. You're not switching between charts. You're seeing real-time confirmation or divergence across the entire timeframe spectrum. This is how you manage swing trades through pullbacks without panic-closing winners or holding losers through reversals.
Session Liquidity and Institutional Entry Levels
The best technical indicators for swing trading don't just show direction and momentum. They show you where institutions are positioned. Retail traders enter at market price. Institutional traders enter at liquidity levels where they can fill large orders without slippage. These levels are VWAP, previous session high and low (HOD/LOD), and supply/demand zones.
VWAP (Volume Weighted Average Price) is the average price weighted by volume. Institutions use it as a benchmark. When price pulls back to VWAP during an uptrend, buyers step in. When price rallies to VWAP during a downtrend, sellers defend. Mark VWAP on your H4 and Daily charts. When your moving average pullback or RSI oversold signal aligns with VWAP, you have a high-probability entry.
Session highs and lows act as magnets. Price often revisits the previous day's high or low before continuing the trend. If you're trading a Daily uptrend and price pulls back to the previous session's low on H4, that's your entry zone. Don't enter 50 pips above it hoping to catch the move early. Wait for price to react at the level.
Supply and Demand Zones for Precision Entries
Supply zones are areas where sellers overwhelmed buyers and price dropped sharply. Demand zones are areas where buyers overwhelmed sellers and price rallied sharply. These zones represent unfilled institutional orders. When price returns to a demand zone during an uptrend, buyers re-enter. When price returns to a supply zone during a downtrend, sellers re-enter.
Mark the origin of strong moves on your Daily and H8 charts. If EUR/USD rallied 200 pips from a tight consolidation zone, that consolidation is a demand zone. When price pulls back to it, you enter long if the Daily trend is still bullish. Your stop goes just below the zone, typically 1.5x ATR. Your target is the next supply zone or a 1:3 risk-reward ratio, whichever comes first.
Unlike lagging indicators, supply and demand zones are forward-looking. They tell you where price is likely to react before it gets there. This allows you to set limit orders and avoid emotional decisions when price is moving fast.
Building a Systematic Swing Trading Process
You've identified the best technical indicators for swing trading. Now you need a process that applies them consistently. Start with the Daily chart. Check trend direction using 50 EMA and 200 EMA. Confirm trend strength with ADX. If ADX is below 20 or price is between the EMAs, wait. No trade setup exists.
If the Daily trend is clear and ADX is above 25, drop to H8. Identify the most recent swing high or low. Mark VWAP and the previous session's high or low. Look for supply or demand zones where price previously reacted. These are your entry levels.
Switch to H4. Wait for price to pull back to one of your marked levels. Check RSI for divergence or oversold/overbought readings. Check Stochastic for a cross from oversold if you're looking for longs. Check that the 20 EMA is approaching the same level. When three factors align-level, oscillator signal, and moving average-you have an entry.
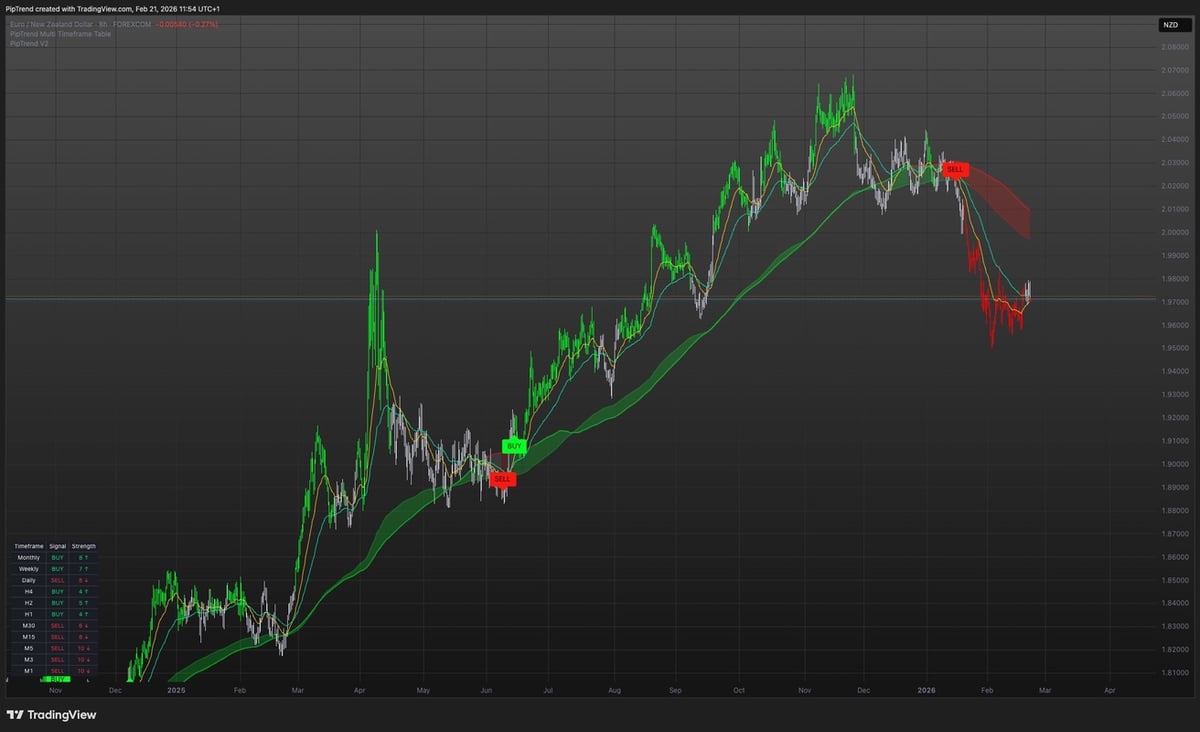
Many traders struggle with this process because it requires managing multiple indicators and timeframes manually. When signals conflict or you miss a level because you're juggling charts, opportunities slip away or bad trades sneak in. PipTrend is a unified trading indicator system that handles all three steps-trend direction through non-repainting BUY/SELL signals, precise entries at institutional liquidity levels like VWAP and supply/demand zones, and trade management with a 12-timeframe confirmation table. Built for intermediate Forex, Crypto, Indices, and Stock traders, it replaces scattered tools with one repeatable system backed by verified trade results, not backtests. You get a 3-day free trial to test it on your pairs and timeframes.
Setting Stops and Targets Based on Structure
Your stop placement depends on ATR and structure. If you enter long at a Daily demand zone, place your stop 1.5x Daily ATR below the zone's low. If ATR is 80 pips, your stop is 120 pips. This keeps you in the trade through normal volatility. For prop firm traders managing 5% daily drawdown limits, calculate position size so a 120-pip loss equals 1-2% of account equity.
Targets follow structure, not arbitrary pip counts. If the next supply zone sits 300 pips away and your stop is 120 pips, you have a 1:2.5 risk-reward ratio. That's acceptable. If the next supply zone is 180 pips away, you have 1:1.5. Adjust your entry or wait for a better setup. Don't force trades just because the Daily trend looks clean.
Swing trades on Forex pairs like EUR/USD, GBP/JPY, or AUD/NZD often take 3-7 days to reach target. On Crypto pairs like BTC/USD or ETH/USD, they can take 7-14 days due to higher volatility and slower timeframes. On Indices like US30 or NAS100, they take 2-5 days depending on session liquidity. Adjust your expectations and trade management based on asset class.
How Direction and Entry Work Together
Most traders fail because they confuse direction with entry. The Daily chart can be bullish for weeks, but if you enter at the top of a H4 rally, you'll sit through a 100-pip pullback before the trend resumes. Direction tells you which way to trade. Entry timing tells you when to risk capital. They are separate decisions requiring separate tools.
Use trend indicators (moving averages, ADX) on Daily and H8 charts for direction. Use liquidity levels (VWAP, session high/low, supply/demand zones) and oscillators (RSI, Stochastic) on H4 and H1 charts for entry. Never enter a trade based on Daily direction alone. Always wait for price to pull back to a level on a lower timeframe.
This is where repainting indicators destroy accounts. Some tools show perfect signals on historical candles but repaint in real-time, moving the signal after the candle closes. You think you entered at the perfect spot, but the indicator lied. Use only non-repainting signals that confirm after the candle closes. If the signal appears during the candle and disappears at the close, it's not a signal. It's noise.
Common Mistakes and How to Avoid Them
You add five indicators to your chart hoping confirmation will arrive. Instead, you get analysis paralysis. One indicator says buy, another says wait, a third says sell. You freeze or enter based on the loudest signal, which is usually the wrong one. The solution is not more indicators. The solution is fewer indicators applied systematically.
Pick one trend filter (moving averages or ADX). Pick one oscillator (RSI or Stochastic). Pick one volatility tool (ATR). Pick one liquidity framework (VWAP or supply/demand zones). Check the Daily chart for trend direction and ADX strength. Check H4 for entry at a liquidity level confirmed by the oscillator. Use ATR to set stops and position size. That's your system.
Another mistake is ignoring timeframe confirmation. You enter on H4 because the setup looks clean, but you never checked if H8 and Daily agree. When H4 moves against you, the higher timeframes are still in the opposite trend. Your swing trade becomes a fight against the primary direction. Always check at least three timeframes before entering. Daily for trend, H8 for structure, H4 for entry.
Overtrading During Low-Volatility Periods
Swing trading requires patience. If ATR on the Daily chart is at multi-week lows and ADX is below 20, the market is consolidating. No amount of indicator tuning will create a high-probability setup. Forcing trades during consolidation leads to tight ranges, stop hunts, and 1:1 risk-reward trades that aren't worth the risk.
Wait for volatility to return. When ATR expands and ADX climbs above 25, trends emerge. Breakouts from consolidation often produce the best swing trades because institutions are positioned and retail traders are caught off guard. Use Bollinger Bands to spot contraction. When bands squeeze tight, a breakout is coming. Position yourself for the expansion, not the chop.
Testing and Refining Your Indicator Setup
Backtesting swing setups is difficult because you can't test discretionary decisions like "price reacting at VWAP." You can test moving average crosses or RSI thresholds, but those signals ignore context. Instead of backtesting, forward-test your system on a demo account for 30 trades. Track every entry reason, stop placement, target, and result.
After 30 trades, review the data. What percentage hit target? What percentage stopped out? What was your average risk-reward ratio? If you're hitting 50% win rate with 1:2 average RR, you're profitable. If you're hitting 60% win rate with 1:1 RR, you're breakeven after spread and commissions. Adjust your entry criteria or target placement.
For prop firm traders, forward-test on a challenge account. The 5% daily drawdown and 10% total drawdown limits force you to refine position sizing and stop placement. You can't afford loose stops or oversized positions. This discipline improves your live trading because the rules are tighter than most retail accounts.
The best technical indicators for swing trading are the ones that separate trend direction from entry timing, confirm decisions across multiple timeframes, and align with institutional liquidity levels where real orders sit. Moving averages and ADX establish direction on Daily and H8 charts. RSI and Stochastic confirm momentum and divergence on H4 and H1. ATR sets stops and position size. VWAP and supply/demand zones pinpoint entries. When you apply these tools systematically, you stop guessing and start following a repeatable process. PipTrend delivers all three components in one unified system-direction through non-repainting signals, entries at institutional levels, and trade management across 12 timeframes-so you can focus on execution instead of chart clutter.