
You watched the pair climb for three days straight on the Daily chart. Every candle close looked stronger. You bought at what felt like a breakout. Then price reversed and stopped you out in two sessions. The Relative Strength Index (RSI) was screaming the warning the entire time, but you didn't know how to read it. That disconnect between price and momentum is rsi divergence, and it shows you when trends are exhausted before the reversal prints on your chart.
What RSI Divergence Actually Tells You
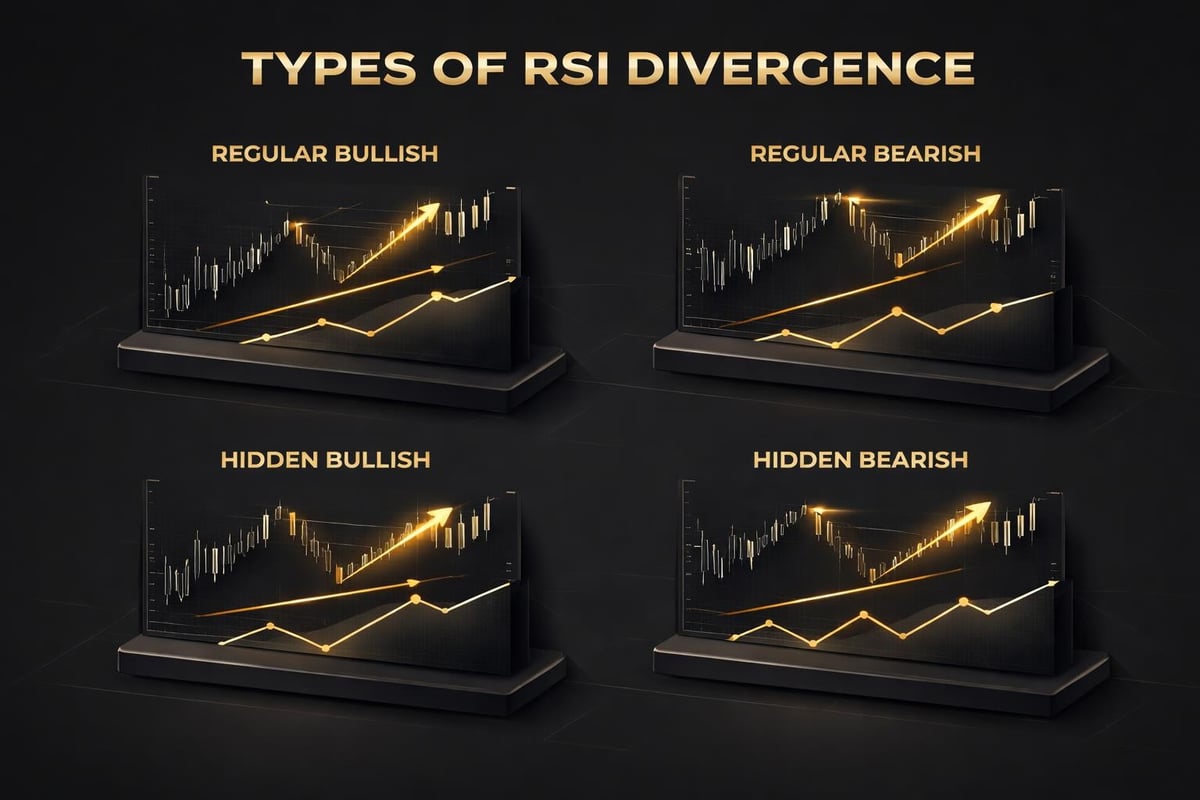
RSI divergence happens when price action and the RSI indicator move in opposite directions. Price makes a new high while RSI makes a lower high. Or price makes a new low while RSI makes a higher low. This disconnect reveals momentum weakness that price hasn't acknowledged yet.
Regular bullish divergence forms when price makes lower lows but RSI makes higher lows. The selling pressure is weakening. Momentum is returning even though price keeps dropping. This pattern appears most clearly on H1, H4, and Daily timeframes where you can see multiple swing lows forming over days or weeks.
Regular bearish divergence forms when price makes higher highs but RSI makes lower highs. Buyers are pushing price up but with less conviction each time. The trend looks strong on the surface but momentum is dying. You see this on 5-minute charts during London open rallies and on Weekly charts during multi-month uptrends.
Hidden divergence works differently. Hidden bullish divergence shows price making higher lows while RSI makes lower lows. This signals trend continuation after a pullback, not a reversal. Hidden bearish divergence shows price making lower highs while RSI makes higher highs. The downtrend will likely continue after the bounce.
Most traders confuse direction with entry timing. Understanding RSI divergence helps you separate those decisions. Divergence tells you the trend is weakening or continuing. It doesn't tell you the exact candle to enter. You need confirmation from price action, support and resistance levels, or institutional liquidity zones.
How to Spot RSI Divergence on Multiple Timeframes
Start with the Weekly or Daily chart to identify the primary trend and potential divergence zones. These higher timeframes filter out noise and show you where major reversals develop. Set your RSI to the standard 14-period setting. Any divergence here carries significant weight because it took weeks or months to form.
Drop down to H8 or H4 to confirm the divergence is building across multiple timeframes. Price should show at least two clear swing highs or swing lows on these charts. The RSI peaks or troughs need to align with those price swings. Draw a trendline connecting the RSI peaks or troughs and compare it to the trendline on price. If the slopes oppose each other, you have divergence.
Move to H1 for entry refinement. The divergence you spotted on Daily might take several days to play out. The H1 chart shows you where price interacts with session liquidity, previous day highs and lows, or supply and demand zones. These are your actual entry triggers, not the divergence itself.
Some traders use 5m or 1m charts for precise entries during active sessions. Spotting RSI divergence on lower timeframes requires discipline because false signals multiply. You need the divergence confirmed on higher timeframes first. The 5m chart simply shows you the exact candle to enter after a liquidity sweep or failed breakout.
Check all relevant timeframes before taking the trade. A bullish divergence on H4 means nothing if the Daily chart shows bearish divergence forming. You need alignment across at least three timeframes. Daily for trend context, H4 or H1 for divergence confirmation, and 5m or 15m for entry precision.
The Settings and Tools You Need
Use the standard 14-period RSI setting for most analysis. This calculation balances sensitivity and reliability across all timeframes. Some traders experiment with 9-period or 21-period RSI, but these variations create more false signals or lag behind price too much.
Set your overbought level at 70 and oversold at 30. These zones help you identify where divergence is likely to form. Bearish divergence carries more weight when RSI peaks above 70 multiple times with declining peaks. Bullish divergence matters most when RSI bounces from below 30 with rising troughs.
Your chart needs clean price action. Remove unnecessary indicators that clutter your view. You need to see swing highs and swing lows clearly. Mark previous session highs and lows, Weekly highs and lows, and any obvious supply or demand zones. These levels combine with divergence to create high-probability setups.
Draw trendlines on both price and RSI. Connect at least two swing highs for bearish divergence or two swing lows for bullish divergence. The trendline on price should slope up while the RSI trendline slopes down for bearish divergence. For bullish divergence, price slopes down while RSI slopes up. If you can't draw clear opposing trendlines, the divergence isn't valid.
Track your divergence trades in a journal with specific metrics. Record the timeframe where you spotted divergence, the timeframe where you entered, your risk-reward ratio, and whether the divergence led to a reversal within your planned holding period. Most valid divergences on Daily charts take 3-10 days to play out. On H1 charts, expect 4-12 hours.
Trading Regular Bearish Divergence Step by Step
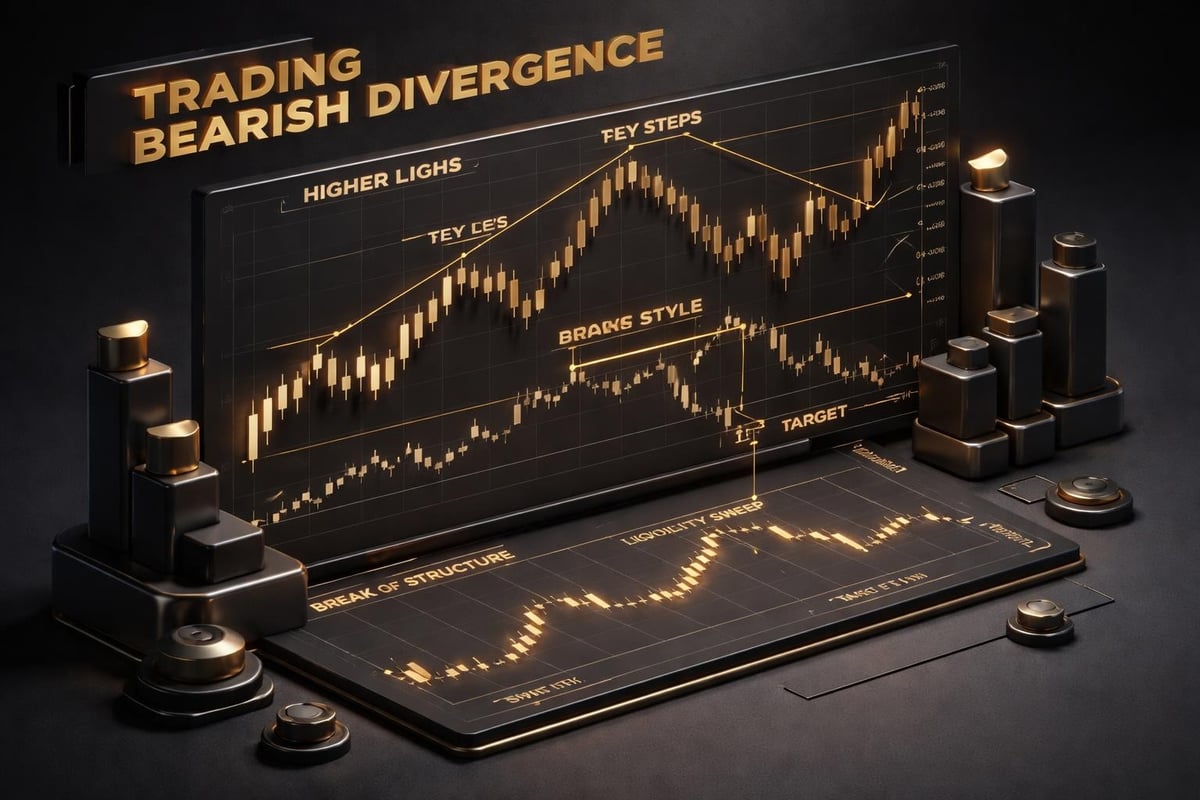
Identify the uptrend on your primary timeframe. You need at least two higher highs in price with corresponding RSI readings. The second high in price should exceed the first high. The second RSI peak should be lower than the first RSI peak.
Wait for confirmation. Price needs to break structure before you enter. That means breaking below the most recent higher low or failing to make a new high after printing the divergence. Entering at the exact RSI peak catches you in continued upside too often.
Mark your entry zone using lower timeframe liquidity. The H1 or 5m chart shows you where price swept liquidity above the previous high before reversing. That liquidity grab often triggers right before the reversal. Your entry comes after price reclaims below that swept high with a clear rejection candle.
Set your stop loss above the swing high that created the divergence. Add 5-10 pips for spread and volatility depending on the pair. EUR/USD might need 5 pips, GBP/JPY needs 15 pips. Your stop protects you if the trend continues despite the divergence.
Target the previous swing low as your first take-profit level. This gives you a 1:2 or 1:3 risk-reward ratio on most setups. If divergence formed on the Daily chart, your target might be 100-200 pips away. On H1 charts, expect 20-40 pips. Scale out partial position at the first target and move your stop to breakeven.
Trading Regular Bullish Divergence for Reversals
Find the downtrend making lower lows in price. Check that RSI is making higher lows at the same swing points. The second price low should be equal to or lower than the first low. The second RSI low should be higher than the first RSI low. This shows sellers losing strength even as price drops.
Confirmation comes when price breaks above the most recent lower high. That structure break signals the reversal is beginning. You don't trade the divergence itself. You trade the confirmed reversal that the divergence predicted.
Enter after price reclaims above a key level with momentum. Look for session opens, previous day highs, or VWAP on your H1 chart. The 5m chart shows the exact entry candle when price breaks and holds above these levels with a strong close. This is where systematic entry approaches separate consistent traders from those guessing at tops and bottoms.
Place your stop below the swing low that formed the divergence. Add buffer for volatility. In Crypto markets, you need 1-2% buffer. In Forex majors, 10-20 pips usually covers it. Indices like S&P 500 need 5-10 points depending on the timeframe.
Target the previous swing high for your first profit target. Trail your stop using the H1 or H4 swing structure if price continues trending. Regular bullish divergence on Daily charts can lead to multi-week rallies. Your first target captures 60-70% of the expected move. Let the remainder run with a trailing stop.
Managing Divergence Trades Across Timeframes
Your Daily chart divergence sets your directional bias and overall profit target. If you spotted bearish divergence on EUR/USD Daily chart, you're looking for short setups across all lower timeframes until that divergence plays out or invalidates.
The H4 and H1 charts show you the swing structure within that Daily trend. You might see three or four H1 swings during a single Daily divergence setup. Each H1 swing gives you a potential re-entry or add-on if you missed the first move.
The 5m chart handles your execution. You watch for liquidity sweeps, failed breakouts, or rejection candles at your planned entry zone. The divergence on Daily told you the direction. The H1 structure showed you the entry zone. The 5m chart gives you the trigger.
Use a multi-timeframe confirmation system to avoid fighting conflicting signals. Before entering a bullish divergence trade on H1, check that the Daily chart isn't showing bearish divergence. Check that the Weekly trend supports your directional bias. One divergence signal on one timeframe isn't enough when higher timeframes oppose it.
Monitor all three timeframes during the trade. Your Daily chart tells you if the overall thesis remains valid. Your H1 chart shows if swing structure is breaking in your favor. Your 5m chart alerts you to momentum shifts or early exit signals. Traders who watch only one timeframe miss critical information that changes the probability of their trade working.
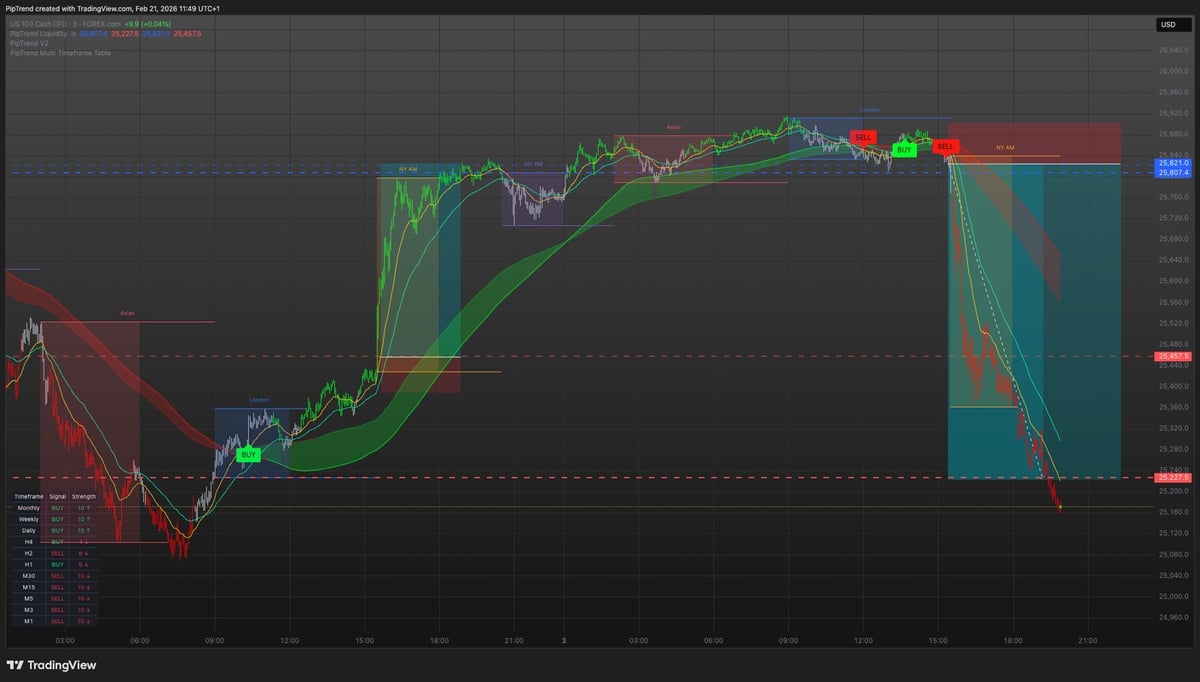
Managing these multiple timeframes manually creates confusion and missed opportunities. The PipTrend Trading Indicator System solves this with a Multi-Timeframe Table that displays 12 timeframes simultaneously, showing you trend direction and momentum confirmation across every relevant period. Combined with non-repainting BUY/SELL signals for direction and Session Liquidity markers for precise entries at institutional levels, you get the complete divergence-to-entry workflow in one unified system.
Common Mistakes That Kill Divergence Trades
Entering at the RSI peak or trough without waiting for price confirmation stops out most divergence trades. The divergence tells you momentum is weakening. It doesn't tell you the exact candle where reversal begins. You need structure breaks, failed highs, or liquidity sweeps before entering.
Ignoring higher timeframe context turns winning setups into losses. Bullish divergence on H1 during a Daily downtrend catches a bounce, not a reversal. You might capture 20 pips before the Daily trend resumes and wipes you out. Always trade divergence in the direction of or at major turning points confirmed by higher timeframes.
Using too-tight stops kills valid divergence trades before they develop. The reversal process takes multiple candles. Price often retests the swing high or low that created the divergence before moving in your direction. Your stop needs room for this retest plus spread and normal volatility.
Overtrading divergence leads to signal fatigue. Not every divergence is worth trading. You need divergence plus a key level, plus confirmation, plus favorable risk-reward. Learning which divergence patterns offer the best probability comes from tracking your trades and reviewing what worked versus what failed.
Expecting perfect divergence lines creates analysis paralysis. Real markets don't draw perfect opposing trendlines. Sometimes the second RSI peak is only slightly lower than the first. Sometimes price makes a marginal new high. The pattern doesn't need to be perfect. It needs to be clear enough that you can define your entry, stop, and target with precision.
RSI Divergence in Different Market Conditions
Trending markets show cleaner divergence patterns. When EUR/USD trends down for three weeks, the bounces create clear lower highs in price. If RSI makes higher highs during those bounces, you have hidden bearish divergence signaling continuation. These setups offer 1:3 or 1:4 risk-reward when you enter pullbacks in the direction of the hidden divergence.
Range-bound markets create false divergence constantly. Price oscillates between support and resistance without trending. RSI bounces between oversold and overbought in rhythm with the range. Divergence appears on every swing but leads nowhere because there's no trend to exhaust or continue. Skip divergence trades when Daily and Weekly charts show ranging price action.
Volatile markets like Crypto and Indices require wider confirmation. Bitcoin can show bearish divergence on H4 then rally another 8% before reversing. Your entry needs to wait for a clear rejection from resistance, not just the divergence itself. Your stop needs 2-3% breathing room, not the 20-pip buffer you use on EUR/USD.
Low-volatility sessions produce weak divergence signals. Trading divergence during Asian session on Forex pairs leads to small moves that don't justify the risk. Wait for London or New York sessions where institutional flow creates the momentum needed for divergence patterns to resolve with conviction.
News events invalidate divergence immediately. If you're holding a bearish divergence trade on GBP/USD and the Bank of England surprises with a rate hike, your technical setup no longer matters. Exit before scheduled high-impact news or avoid divergence trades in the 12 hours leading up to major releases.
Building a Repeatable Divergence Strategy
Define exactly which timeframes you'll scan for divergence. Day traders might use H1 for divergence and 5m for entry. Swing traders use Daily for divergence and H1 for entry. Pick your combination and stick with it for at least 30 trades before changing.
Create a checklist for every divergence trade. Divergence present on primary timeframe, confirmed by at least one other timeframe, price near key support or resistance, risk-reward minimum 1:2, no major news in next 12 hours, trend on higher timeframe supports or is neutral to trade direction. If any item fails, skip the trade.
Track performance separately by divergence type. Regular bullish divergence might win 58% of your trades with average 1:2.5 RR. Hidden bearish divergence might win 48% but with 1:4 RR. Knowing these metrics tells you which setups to prioritize and which to avoid.
Set maximum daily or weekly divergence trades. Prop firm traders especially need this limit because overtrading divergence leads to drawdowns that violate challenge rules. Two high-quality divergence setups per week outperform ten mediocre ones you force yourself to see.
Review every divergence trade within 24 hours of exit. Did the divergence lead to reversal as expected? Did you enter too early or too late? Was your stop too tight? Did higher timeframe context support the trade? These reviews build the pattern recognition that transforms divergence from a concept into a repeatable edge.
How Divergence Fits Your Complete Trading System
RSI divergence is a filter, not a standalone system. You need trend analysis from higher timeframes, entry precision from support and resistance or liquidity zones, and position sizing based on volatility and account risk. Divergence tells you when conditions favor a reversal or continuation setup.
Combine divergence with price action confirmation. A divergence plus a pin bar rejection at Weekly support creates a higher-probability trade than divergence alone. A divergence plus a failed breakout above previous day high gives you both momentum and technical confirmation.
Use divergence to time your entries in the direction of higher timeframe trends. If the Weekly chart shows uptrend, trade only bullish divergence and hidden bullish divergence on lower timeframes. This keeps you aligned with the larger trend while catching optimal entry points during pullbacks.
Integrate divergence with your risk management rules. If you risk 1% per trade, a divergence setup with 1:3 RR gives you 3% potential gain. If you see three valid divergence setups in one week, your maximum risk is 3% with potential gain of 9%. These numbers matter more than the indicator itself.
Understand that divergence shows you probability shifts, not certainties. A valid bearish divergence on Daily might have 65% probability of leading to reversal within 10 days. That means 35% of the time it fails. Your job is to take every valid setup with proper risk and let the edge play out over 50-100 trades. Building this systematic approach separates traders who profit from those who chase patterns inconsistently.
Real Numbers from Divergence Trading
A typical bearish divergence trade on EUR/USD Daily chart with entry at 1.1000, stop at 1.1050, and target at 1.0900 gives you 50-pip risk for 100-pip reward. That's 1:2 RR. If you win 55% of these setups, your expectancy is positive and you profit over time.
Hidden bullish divergence during uptrends on H4 charts often provides tighter stops. Entry at 1.0950 after pullback, stop at 1.0920, target at 1.1020 gives you 30-pip risk for 70-pip reward. You're trading continuation, not reversal, which typically offers better win rates around 60-65%.
Prop firm traders need to respect maximum daily loss limits. If your limit is 3% and you risk 1% per trade, you can afford three losing divergence trades before hitting your threshold. This forces you to be selective. Only the clearest divergence patterns with multiple timeframe confirmation justify the risk.
Position sizing adapts to volatility and timeframe. A Daily chart divergence trade on GBP/JPY might see 80-pip stop loss. At 0.5% account risk on a $100,000 account, that's $500 risk divided by 80 pips, giving you 0.06 lots. A 5m divergence trade on the same pair might use 15-pip stop, allowing 0.33 lots for the same dollar risk.
Track your divergence trades for at least three months. Calculate win rate, average RR, maximum consecutive losses, and average time in trade. These metrics tell you if your divergence strategy actually has an edge or if you're breaking even after commissions and spread. Profitable divergence traders typically see 52-62% win rate with average RR above 1:2.
Avoiding Analysis Paralysis with Divergence
You don't need to spot every divergence. Most days offer zero high-quality setups. Some weeks give you one or two. Forcing trades because you spent time analyzing creates bad decisions and losses.
Set specific market scan times. Check Daily and H4 charts at London open and New York open. If you see valid divergence, mark it and set alerts for when price reaches your entry zone. If you don't see anything clear, close your charts and walk away.
Limit your watchlist to pairs and assets you know well. Scanning 40 Forex pairs plus Crypto plus Indices for divergence creates overload. Pick five Forex pairs, two Indices, and one Crypto. Master divergence trading on those before expanding.
Use alerts to remove the need for constant monitoring. When you identify divergence on Daily EUR/USD, set an alert for when price breaks the most recent swing low. You don't need to watch every candle. Let the market notify you when confirmation arrives.
Accept that missed trades are part of trading. You'll see perfect divergence setups that you didn't catch or didn't have time to take. That's normal. The goal isn't catching every opportunity. The goal is consistently taking the opportunities you do see with proper execution and risk management. Understanding this distinction keeps you focused on process instead of outcomes.
RSI divergence gives you advance warning of trend exhaustion and continuation when combined with multi-timeframe analysis and price action confirmation. The pattern itself doesn't make you profitable, but using it within a systematic approach with defined rules for entry, stop placement, and position sizing creates an edge you can repeat. PipTrend removes the complexity of managing multiple timeframes and conflicting signals by showing you trend direction, precise entry points at institutional liquidity levels, and 12-timeframe confirmation in one unified system, turning divergence concepts into executable trades with clear, non-repainting signals.