
You see a BUY signal on your chart at 9:47 AM. Price looks bullish. You enter long on EUR/USD. Fifteen minutes later, the signal disappears and you're down 18 pips. The indicator repainted. You close the trade frustrated, wondering why your tools keep changing their story after you commit capital. This happens because most free indicators show lagging information without confirming whether momentum actually supports the directional move. Moving average convergence divergence solves part of this problem by measuring the relationship between two moving averages, giving you insight into momentum shifts before price fully commits to a trend. But knowing how MACD works and knowing how to use it for consistent entries are completely different skills.
What Moving Average Convergence Divergence Actually Measures
The MACD indicator calculates the difference between a 12-period exponential moving average and a 26-period exponential moving average. That difference becomes the MACD line. A 9-period EMA of the MACD line becomes the signal line. The histogram shows the distance between these two lines. When the histogram expands, momentum accelerates. When it contracts, momentum weakens.

You'll see the MACD line cross above the signal line during bullish momentum shifts. You'll see it cross below during bearish shifts. The histogram visually represents this relationship. Positive histogram values mean the MACD line sits above the signal line. Negative values mean it sits below. The rate of change in the histogram tells you whether momentum is building or fading, which matters more than the crossover itself.
Most traders use default settings: 12, 26, 9. These work across Daily, H4, and H1 timeframes for swing trades. For scalping on 5m or 15m charts, you might test faster settings like 5, 13, 5 to catch quicker momentum shifts. For position trading on Weekly charts, slower settings like 19, 39, 9 reduce noise. The key is consistency. Pick settings that match your holding period and test them across 100+ trades before changing anything.
Direction From MACD Versus Entry Timing
Here's where most traders fail with moving average convergence divergence. MACD tells you momentum direction, not where to enter. A bullish crossover on H1 confirms upward momentum. It doesn't tell you if price just spiked 40 pips above a fair value zone and you're buying the top of a move. Direction and entry are separate decisions. You need both to trade systematically.
Let's work through a real scenario. You're watching GBP/JPY on the H1 chart. MACD crosses bullish at 184.23. Price is trending up. Histogram bars expand, showing accelerating momentum. You have direction confirmation. Now you need an entry. Price pulls back to 184.05, testing the previous session's high. That level held twice yesterday. You enter long at 184.07 with a 15-pip stop at 183.92 and a 45-pip target at 184.52. Your risk-to-reward ratio is 1:3. MACD gave you the directional bias. Price action at a tested level gave you the entry.
This separation matters even more on faster timeframes. On a 5m chart during London open, MACD might show bullish momentum while price whipsaws 20 pips in both directions around VWAP. You have direction but no clean entry. Wait for price to test a supply zone, demand zone, or session extreme. Let MACD confirm the bias. Let price action and liquidity levels give you the precise entry point. Fidelity’s technical guide explains how MACD signals work in trending markets, but they don't explain this critical distinction between trend confirmation and entry execution.
Multi-Timeframe MACD Analysis for Confirmation
You don't trade based on a single timeframe. You check higher timeframes for context and lower timeframes for entries. Moving average convergence divergence works the same way. Your directional bias comes from higher timeframes. Your entry timing comes from lower timeframes. Your trade management references both.
Start with the Daily chart. Check MACD there first. If the Daily shows a bullish crossover with expanding histogram, you have a multi-day bullish bias. Drop to H4. Confirm MACD there also shows bullish momentum. Now drop to H1 for your entry setup. You're looking for a pullback that holds structure while MACD stays bullish or resets briefly before crossing bullish again. This alignment across three timeframes increases your probability because short-term momentum matches intermediate and long-term momentum.
Here's the practical execution on EUR/USD. Daily MACD crossed bullish two days ago. Histogram still expanding. H4 MACD bullish, price above the 20 EMA. H1 shows a small bearish MACD crossover as price pulls back to test 1.0847 demand zone from last week. You wait. H1 MACD crosses back bullish as price holds that zone. You enter long at 1.0851. Stop at 1.0832 (below the zone). Target at 1.0908 (previous week high). That's 19 pips of risk for 57 pips of reward. The Daily gave you bias. H4 confirmed trend. H1 gave you entry after the pullback. Three timeframes told the same story at different scales.
| Timeframe | MACD Status | Purpose | Typical Holding Period |
|---|---|---|---|
| Daily | Trend direction | Bias for the week | 3-7 days |
| H4 | Momentum confirmation | Swing entry context | 1-3 days |
| H1 | Entry timing | Intraday management | 4-24 hours |
| 15m | Precision entry | Scalp/day trade execution | 1-6 hours |
| 5m | Micro-timing | High-frequency entries | 15-90 minutes |
For prop firm traders managing tight drawdown limits, this multi-timeframe approach reduces false entries. You're not reacting to every 5m MACD crossover. You're executing trades where three timeframes align, which naturally filters low-probability setups. Your win rate improves because you only trade when momentum stacks across multiple time horizons.
Divergence Patterns and What They Actually Predict
Price makes a higher high. MACD makes a lower high. That's bearish divergence. It signals weakening momentum even as price pushes higher. You don't short immediately. You wait for confirmation. Divergence warns you that the current move is losing steam. It doesn't predict the exact reversal point.
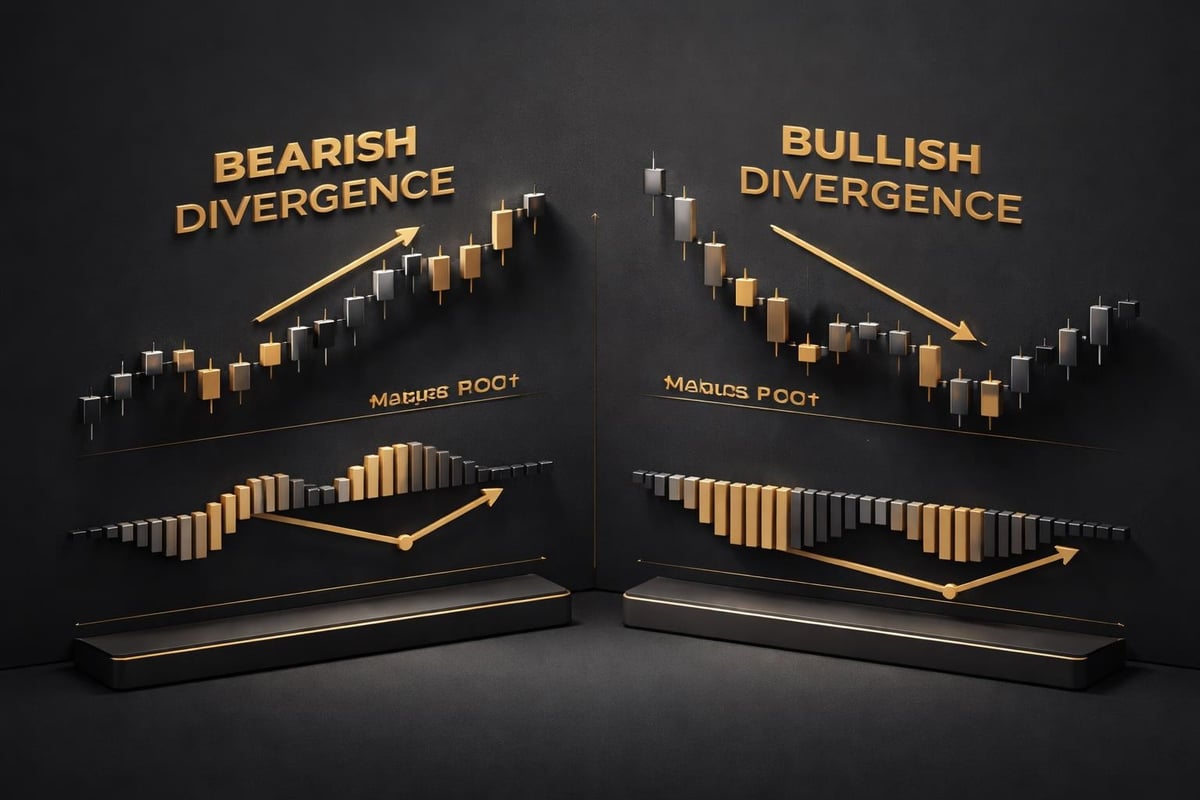
On USD/CAD H4, price climbs from 1.3650 to 1.3712, making a new swing high. MACD peaks at 0.0042 on the first high but only reaches 0.0031 on the second high. That's bearish divergence. You mark it. You don't trade it yet. You wait for price to break structure-a lower low, a breakdown through support, or a bearish MACD crossover. Two hours later, price breaks below 1.3695 and MACD crosses bearish. Now you have divergence plus confirmation. You enter short at 1.3693 targeting the previous swing low at 1.3655. Divergence spotted the weakness. The crossover and structural break confirmed the reversal.
Bullish divergence works the opposite way. Price makes a lower low. MACD makes a higher low. Momentum is building even as price drops. You wait for a bullish crossover or a break of structure to the upside. On BTC/USD Daily chart, price drops from $68,400 to $64,200, making a new low. MACD drops to -850 on the first low but only to -620 on the second low. Price holds $64,000 support. MACD crosses bullish. You enter long at $64,350 with a stop below $63,800 and a target at $67,200. Risk: 550 points. Reward: 2,850 points. The divergence warned you. The crossover gave you entry confirmation.
Divergence alone is not a signal. It's a warning to watch for confirmation. Most failed divergence trades happen because traders short at the divergence high or buy at the divergence low without waiting for momentum to actually reverse. This academic analysis breaks down MACD's mathematical structure, showing why divergence patterns reflect shifts in underlying momentum before price fully commits.
Combining MACD With Institutional Liquidity Levels
Moving average convergence divergence tells you momentum. It doesn't tell you where smart money accumulates or distributes. VWAP, previous day high/low, session open, and supply/demand zones show you where institutions place orders. You combine both for high-probability entries.
Example: EUR/GBP on the H1 chart during London session. MACD crosses bullish at 8:15 AM GMT. Momentum is up. Price sits at 0.8532. You check liquidity levels. Yesterday's high is 0.8547. VWAP is at 0.8529. A supply zone from last week sits at 0.8555-0.8562. You don't buy at 0.8532 just because MACD is bullish. You wait for price to pull back to VWAP at 0.8529 or test yesterday's high at 0.8547 (which often flips to support after a breakout). Price drops to 0.8528, taps VWAP, and bounces. You enter long at 0.8531. Stop at 0.8520 (below VWAP). Target at 0.8555 (the supply zone). That's 11 pips of risk for 24 pips of reward.
MACD confirmed bullish momentum. VWAP gave you the precise entry at a tested institutional level. This combination reduces slippage and improves fill quality because you're entering where liquidity actually exists, not in the middle of nowhere based solely on an indicator crossover.
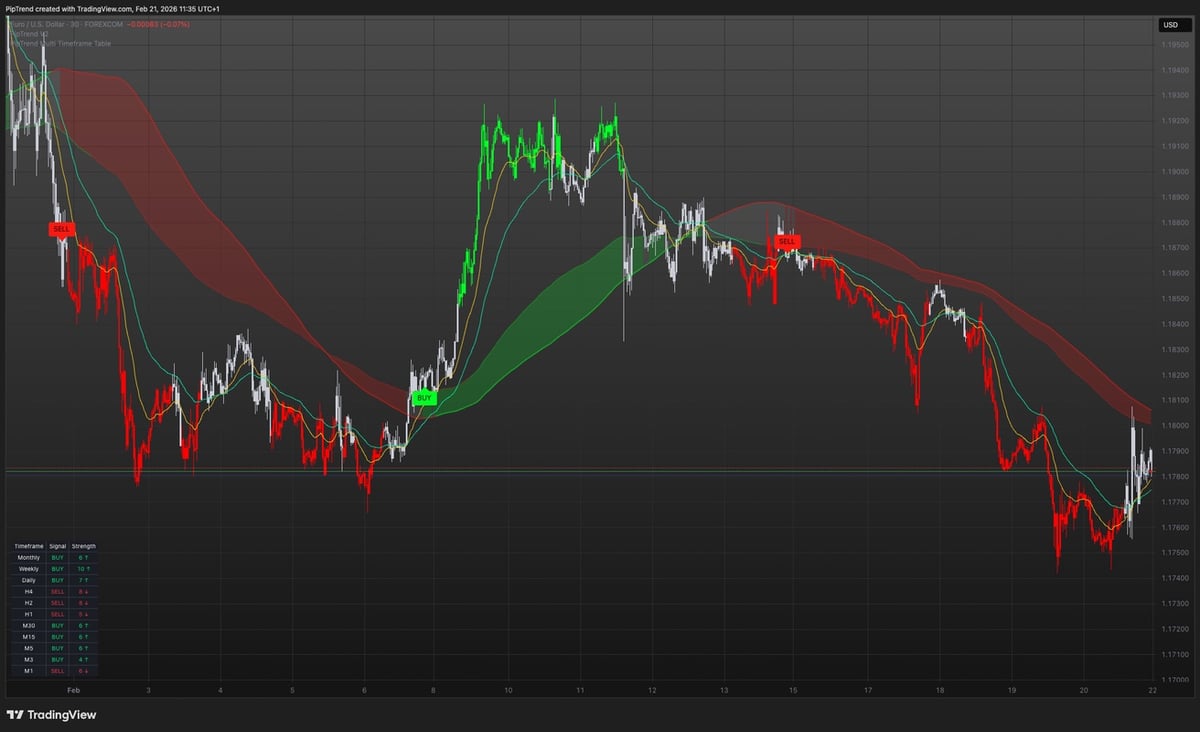
For traders using systematic approaches that unify trend direction, entry precision, and multi-timeframe management into one repeatable process, this integration becomes essential. Unlike tools that repaint or give conflicting signals, a clear system separates these three roles-direction from confirmed signals, entries at institutional liquidity, and trade management across timeframes-so every trade follows the same rules.
MACD Settings for Different Asset Classes and Timeframes
Forex pairs like EUR/USD and GBP/USD move differently than Crypto assets like BTC/USD or indices like US30. Default MACD settings (12, 26, 9) work well on Forex Daily and H4 charts. They lag too much on volatile Crypto 15m charts. You adjust based on the asset's volatility and your timeframe.
For Forex day trading on 15m to H1 charts, test settings like 10, 21, 7. These respond faster to intraday momentum shifts without giving false signals on every small pullback. For swing trading Forex on Daily charts, stick with standard 12, 26, 9 or try slightly slower settings like 13, 28, 9 to filter noise during consolidation. For Crypto trading on H1 or 15m charts, use faster settings like 5, 13, 5 or 8, 17, 7 because Crypto volatility creates sharper momentum shifts that slower settings miss.
| Asset Class | Timeframe | MACD Settings | Purpose |
|---|---|---|---|
| Forex | Daily | 12, 26, 9 | Swing trend confirmation |
| Forex | H1 | 10, 21, 7 | Intraday momentum shifts |
| Crypto | H1 | 8, 17, 7 | Volatile momentum tracking |
| Crypto | 15m | 5, 13, 5 | Fast scalp entries |
| Indices | H4 | 12, 26, 9 | Session-based swings |
| Stocks | Daily | 12, 26, 9 | Position trend confirmation |
On indices like NAS100 or US30, standard settings work well on H1 and H4 because these markets trend cleanly during major sessions. For stocks on Daily charts, stick with 12, 26, 9 unless you're trading highly volatile small-caps, where faster settings reduce lag. The key is testing your chosen settings across at least 50 trades on your specific asset and timeframe before going live. What works on EUR/USD H1 might fail on BTC/USD 5m. Test systematically.
Avoiding the Common MACD Mistakes That Burn Accounts
You see a bullish crossover on the 5m chart. You buy immediately. Three candles later, MACD crosses bearish. You're stopped out. You didn't wait for candle confirmation. MACD signals finalize after the candle closes. Trading mid-candle based on where the indicator currently sits is how you rack up losses from whipsaw moves.
Wait for the candle to close. If MACD shows a bullish crossover after candle close, then evaluate the setup. Check your higher timeframe bias. Check liquidity levels. Check risk-to-reward. Then enter. This one rule eliminates 40% of false entries because you're not reacting to temporary intrabar momentum that reverses before the period ends. The Wikipedia entry on MACD explains how the indicator calculates, but it doesn't emphasize this execution discipline.
Another mistake: trading every crossover. MACD crosses bullish and bearish constantly in ranging markets. If price chops between 1.0820 and 1.0840 for three hours, you might see six crossovers. Trading all of them destroys your account with commissions and slippage. You need a trending environment for MACD to work. Check if price is above/below a key moving average. Check if ATR shows expanding volatility. Check if you're near a breakout level. Filter crossovers by market context.
Third mistake: ignoring risk management because MACD looks "strong." A bullish crossover with expanding histogram doesn't eliminate the need for a stop loss. You still set your stop based on structure-below the swing low, below the demand zone, or below a percentage threshold. Your position size still respects your max risk per trade (1-2% for most traders, 0.5-1% for prop firm traders managing drawdown). MACD confirms direction and momentum. It doesn't guarantee profit. You still lose trades. You still need stops.
Using MACD Histogram for Momentum Strength Assessment
The histogram doesn't just show crossovers. It shows acceleration and deceleration. When histogram bars grow taller, momentum accelerates. When they shrink, momentum weakens. This tells you whether to hold a trade, tighten stops, or prepare for a reversal.
You're long GBP/USD from 1.2650. MACD crossed bullish when you entered. The histogram showed bars at +0.0012. Two hours later, the histogram reaches +0.0028. Bars are expanding. Momentum accelerates. You move your stop to breakeven and let the trade run toward your 1:3 target. Four hours later, histogram bars shrink to +0.0019 even though MACD remains above the signal line. Momentum is fading. You don't wait for a bearish crossover. You exit at 1.2691 for 41 pips instead of waiting for your 60-pip target. Price reverses 20 minutes later. The shrinking histogram warned you before the crossover happened.
This works in reverse. You're short EUR/JPY from 162.45. Histogram shows -0.045. One hour later it's at -0.062. Momentum accelerating down. You hold. Later it shrinks to -0.051. You tighten your stop or exit. The histogram change gives you real-time feedback on whether the move you're riding still has fuel. You're not waiting for a full crossover to act. You're reacting to momentum shifts as they develop.
For day traders managing positions across 1m to H1 timeframes, histogram analysis adds a layer of trade management that pure crossover signals miss. You can hold winning trades longer when momentum builds and cut losing trades faster when momentum fades, even before the MACD line crosses back. This improves your average win size and reduces your average loss size, which directly impacts profitability.
MACD as Part of a Systematic Trading Process
Moving average convergence divergence works when it's part of a repeatable system, not a standalone signal generator. Your system needs three components: directional bias, entry execution, and trade management. MACD handles the first component. You need clear rules for the other two.
Your directional bias comes from MACD alignment across timeframes. Daily and H4 both bullish? Your bias is long. You only look for long setups. Daily bearish, H4 bullish? You wait for clarity or trade smaller size. No bias, no trade. Your entry execution comes from price action at tested levels-VWAP, session extremes, supply/demand zones, or previous day high/low. MACD confirms the direction. Liquidity levels give you the entry. Your trade management comes from monitoring histogram strength and multi-timeframe table confirmation showing whether momentum holds across 1m, 5m, 15m, H1, H4, and Daily at the same time.
This systematic approach matters for consistency. You're not guessing whether to take a trade. You check three things: MACD bias across timeframes, entry at a liquidity level, and risk-to-reward above 1:2. All three align? You trade. One misaligned? You wait. Same process, every setup, every asset class. Forex, Crypto, Indices, Stocks-the rules don't change.
For prop firm traders, this discipline prevents emotional overtrading during drawdowns. You follow the system. You don't revenge trade after a loss. You don't double size after a win. MACD gives you the bias. Your rules give you the rest. Stockopedia’s breakdown of MACD interpretation methods shows various crossover and divergence strategies, but without a complete system around them, traders still struggle with execution consistency.

Practical MACD Trade Execution Examples Across Assets
Let's walk through three complete trades using moving average convergence divergence as the directional filter. First trade: USD/JPY on H1 during Tokyo session. Daily MACD bullish. H4 MACD bullish. H1 MACD crosses bullish at 149.23. You check liquidity. Previous session high at 149.18. VWAP at 149.15. Price pulls back to 149.17, tests the session high flip level. You enter long at 149.19. Stop at 149.05 (14 pips below the flip level). Target at 149.62 (previous week high). Risk 14 pips for 43 pips. Ratio: 1:3.07. Price reaches target in 6 hours. MACD confirmed direction. Session high flip gave entry. Histogram expansion confirmed momentum throughout the trade.
Second trade: BTC/USD on 15m chart. H4 MACD bearish. H1 MACD bearish. 15m MACD crosses bearish at $67,820. You check structure. Supply zone from yesterday at $67,900-$68,100. VWAP at $67,750. Price rallies to $67,915, hits the supply zone, rejects. You enter short at $67,890. Stop at $68,120 ($230 above the zone). Target at $67,200 (session low). Risk $230 for $690 target. Ratio: 1:3. Price hits target in 4 hours. MACD gave you bearish bias across timeframes. Supply zone rejection gave you entry with structure.
Third trade: NAS100 on H4 during New York session. Daily MACD bullish. H4 MACD crosses bullish at 18,340. You check the previous day low at 18,290. Price pulls back to 18,305 during lunch hour. You enter long at 18,310. Stop at 18,260 (50 points below demand). Target at 18,510 (previous week high). Risk 50 points for 200 points. Ratio: 1:4. Trade runs overnight, hits target next morning. Three different assets, three different timeframes, same systematic process. MACD for direction, liquidity levels for entry, structure for stops and targets.
Moving average convergence divergence gives you momentum confirmation and directional bias, but it's only one piece of a complete trading system. You still need precise entries at institutional levels, multi-timeframe confirmation for trade management, and a repeatable process that eliminates emotional decisions. PipTrend unifies these three roles into one system-Core/V2 for direction via non-repainting signals, Session Liquidity for entries at VWAP and supply/demand zones, and a Multi-Timeframe Table showing 12 timeframes at a glance so you know exactly when momentum aligns across all scales. Start your 3-day trial and trade with clarity instead of guesswork.