
You know the pattern. Daily chart shows a clean uptrend. You switch to the 5-minute chart, spot what looks like a pullback, and enter long. Price drops another 80 pips before you stop out. The problem wasn't your analysis. The problem was treating direction and entry as the same decision. Most swing trading strategies fail because they blur this line. You need direction from higher timeframes and entries from lower ones. That's not two strategies. That's one system with two separate jobs.
Understanding Direction Before Entry
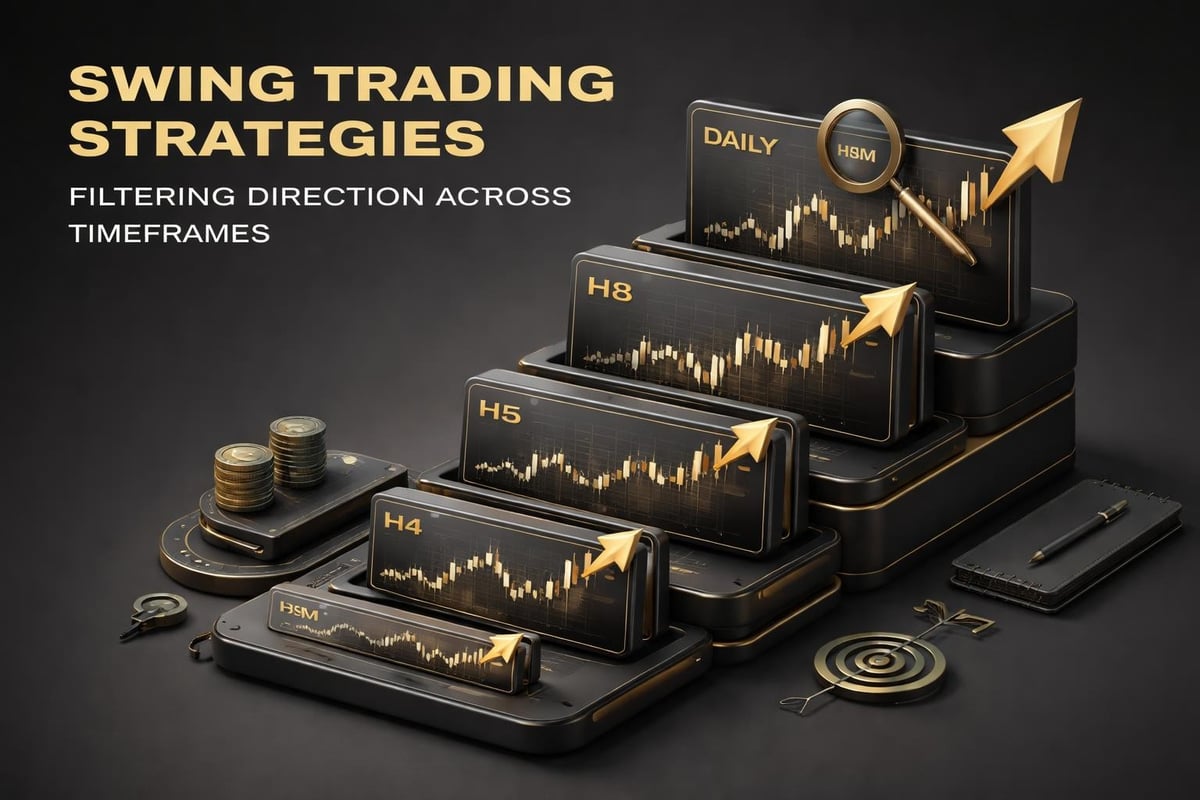
Direction tells you which side of the market to trade. Entry tells you where to pull the trigger. Confuse these and you'll buy tops in uptrends and sell bottoms in downtrends. Your swing trading strategy starts on the Daily or H8 chart. Look for higher highs and higher lows for uptrends, lower highs and lower lows for downtrends. Mark your swing points. These are your direction anchors.
Now drop to H4 or H1. You're not looking for new direction here. You're looking for pullbacks within the established trend. When Daily shows an uptrend and H1 shows a retracement into a demand zone, you have alignment. When they conflict, you have noise. Skip the trade.
Most traders do this backward. They find a setup on the 15-minute chart, then check Daily to "confirm" it. That's rationalizing, not analyzing. Your process must flow from high to low timeframe. Direction first, entry second, always.
The 3-Step Entry Framework
Once you have direction from Daily or H8, your entry timeframe depends on your trade duration. For swing trades lasting 3-7 days, use H4 and H1 for entries. For position trades lasting 2-4 weeks, use Daily and H4. Your entry timeframe should be roughly one-quarter the length of your intended hold time.
Step one: Wait for price to pull back into a zone. Support in uptrends, resistance in downtrends. These zones come from recent swing highs and lows on your direction timeframe. If Daily identified the uptrend, use Daily swing lows as your demand zones. Don't create new zones on H1. You're applying Daily structure to H1 execution.
Step two: Look for rejection candles. Hammers, engulfing patterns, or pin bars that close back into the zone. The rejection confirms that price found buyers or sellers at your level. Without rejection, you're catching a falling knife.
Step three: Enter on the break of the rejection candle's high (for longs) or low (for shorts). Your stop goes below the zone, not below the candle. This gives you room for intrabar movement while keeping risk defined. A typical Forex swing trade on EUR/USD might risk 40-60 pips for a target of 120-180 pips, giving you a 1:3 risk-reward ratio.
Timeframe Synchronization for Consistent Results
Your biggest enemy in swing trading isn't wrong direction. It's premature entries. You see the setup forming on H1, enter immediately, then watch price chop for six hours before moving. You gave up because you entered on prediction instead of confirmation.
Confirmation means the candle closes. If you're trading H1 rejection candles, you wait for the full 60 minutes to pass and the candle to close as a rejection before entering. If you're using H4, you wait four hours. Non-repainting signals only trigger after the candle completes. This filters out 70% of false setups that looked perfect mid-candle but failed by close.
Now add a multi-timeframe confirmation layer. Before entering on H1, check that H4 and Daily still align with your original direction. Price moves fast. What was an uptrend on Daily at 9 AM might show early reversal signs by 2 PM. A quick scan of multiple timeframes before entry keeps you out of late-stage trend trades.
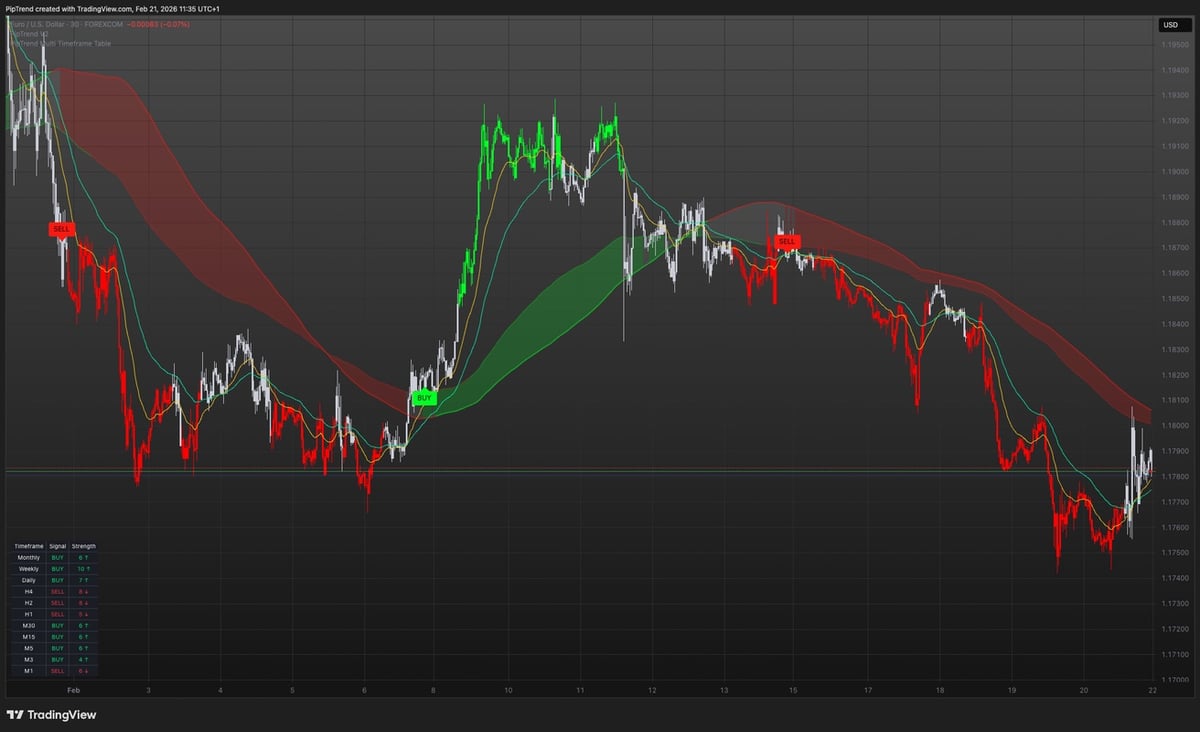
Use a simple table structure: 5-minute, 15-minute, H1, H4, Daily, Weekly. Mark each as bullish, bearish, or neutral based on recent price action. If four or more timeframes agree, your probability increases. If they're split 50/50, you're trading noise. Many intermediate traders skip this step because it feels tedious. That tedium saves you from emotional trades.

Managing Swing Trades Across Sessions
Swing trades don't respect your sleep schedule. You enter a long position on EUR/USD during London session based on solid H4 structure. Twelve hours later, New York session opens and price gaps down 30 pips. Your stop is still 20 pips away, but the gap triggers you out anyway. This is session liquidity risk.
Each major session (Tokyo, London, New York) brings new liquidity and repricing. VWAP resets. High-of-day and low-of-day levels shift. Supply and demand zones that held during London might break during New York when institutional flow increases. Your swing trading strategies must account for these shifts.
Set your stops beyond key session levels, not arbitrary pip counts. If you're long EUR/USD and London low is 1.0850, put your stop at 1.0840, not 1.0855. This gives you breathing room through normal session volatility. Your target should align with the next major resistance level, typically 100-200 pips away for Forex majors.
For Crypto, session boundaries blur because the market never closes. Instead, focus on UTC midnight and noon resets when many institutional algorithms recalibrate. For Indices like S&P 500 or NASDAQ, respect the 9:30 AM EST open and 4 PM EST close as high-volume pivot points.
Position Sizing for Drawdown Control
You found a perfect setup on GBP/JPY. Daily uptrend, H1 pullback into demand, rejection candle confirmed. You risk 2% of your account. Price moves 40 pips in your favor, then reverses and stops you out. One loss, 2% gone. Manageable.
Now repeat that three times in one week. You're down 6%. If you're trading a prop firm challenge with a 10% maximum drawdown rule, you just used 60% of your allowed risk budget in five days. This is where theoretical strategies hit practical constraints.
For prop firm traders, risk per trade must factor in your drawdown limit and win rate. If your strategy wins 55% of the time, you'll face streaks of 3-4 losses. At 2% risk per trade, four losses equal 8% drawdown. That leaves you 2% of buffer before you breach. Tighten to 1.5% per trade instead. Four losses now equal 6% drawdown, giving you room to recover.
For personal accounts, your risk tolerance might allow 2-3% per trade. But emotional tolerance differs from financial tolerance. Losing 6% in a week feels different than seeing it on a spreadsheet. Most traders overtrade after a drawdown, trying to "make it back." Your position sizing must be tight enough that a bad week doesn't trigger emotional decisions.
Separating Indicators from Systems
Most traders collect indicators like tools in a garage. RSI for momentum, moving averages for trend, MACD for divergence, Bollinger Bands for volatility. Each one gives you information. None of them tell you what to do with it. That's the gap between indicators and systems.
A system tells you three things in sequence: direction, entry, exit. Direction comes from higher timeframe trend analysis. Entry comes from lower timeframe structure and confirmation. Exit comes from predefined targets and stops, not hope. When these three components work together as one process, you have repeatability.
Unlike free tools that show you direction but leave entry timing to guesswork, a unified system removes the interpretation gap. You're not deciding whether a pullback is "deep enough" or a rejection candle is "strong enough." The system defines these parameters. Same rules, every trade, every asset class.
PipTrend solves this exact problem by integrating direction signals, entry-level precision at institutional liquidity zones (VWAP, session highs and lows, supply and demand), and a multi-timeframe confirmation table in one system. You see BUY or SELL for direction on your chosen timeframe, pinpoint entries where institutions place orders, and confirm alignment across 12 timeframes before pulling the trigger. The signals don't repaint because they trigger after candle close, filtering out setups that fail mid-formation. Built for swing traders working across Forex, Crypto, Indices, and Stocks, it gives you a repeatable edge backed by verified trade results. You can test it with a 3-day free trial to see how the three-component system performs on your preferred pairs and timeframes.
Practical Setups for Forex Majors
EUR/USD offers the tightest spreads and deepest liquidity for swing trading strategies. Look for Daily trends that last 8-15 days, typically moving 150-300 pips from swing low to swing high. Your entry timeframe is H4. When Daily shows an uptrend (series of higher lows), wait for H4 to pull back into the previous Daily swing low area.
Your stop sits 10-15 pips below the Daily swing low. Your target sits at the previous Daily swing high if price hasn't reached it yet, or at a 1:2 or 1:3 extension if price already broke above. A typical setup risks 50 pips to make 100-150 pips. You might wait three days for the pullback and hold the trade for five days to reach target.
GBP/USD moves faster with wider spreads. The same Daily uptrend might cover 250-400 pips in 8-15 days. Your stop must widen to 60-80 pips to avoid getting shaken out by normal volatility. Target 180-240 pips. The risk-reward ratio stays similar, but the absolute pip values increase.
USD/JPY trends more slowly but more consistently. Look for Weekly trends that last 6-10 weeks, moving 400-800 pips total. Use Daily as your entry timeframe. Risk 80-100 pips per trade, target 240-300 pips. These trades might take 10-14 days to mature, but they offer smoother price action with fewer false breakouts.
Adapting Strategies to Crypto Volatility
Bitcoin and Ethereum don't respect Forex session boundaries, but they do respect percentage moves. A 3% pullback in EUR/USD is catastrophic. A 3% pullback in BTC/USD is Tuesday. Your risk management must adapt to percentage-based stops instead of pip-based stops.
For BTC swing trades, use Daily and H4 timeframes just like Forex. But instead of setting stops 50 pips away, set them 2-3% from entry. If you enter BTC at $62,000, your stop sits at $60,340 (2.67% risk). Your target sits 6-9% away at $65,720 to $67,580, maintaining the 1:3 risk-reward structure.
Altcoins amplify this volatility. Ethereum might move 5-8% in a single Daily candle during trending periods. Your swing trades need wider stops (4-5%) and larger targets (12-15%) to accommodate the swings. This means smaller position sizes in dollar terms to keep your account risk at 1-2% per trade.
Check correlation before entering multiple Crypto positions. BTC and ETH move together 80% of the time. Entering both simultaneously doubles your exposure to the same directional bet. If you want multiple Crypto trades, pair BTC with an altcoin that shows lower correlation, like SOL or AVAX, based on recent 30-day price action.
Index Trading with Tight Stops
S&P 500 and NASDAQ futures offer swing opportunities during earnings season and Fed announcement periods. These instruments move on news, not just technicals. Your swing trading strategies must account for scheduled volatility events.
Avoid holding swing positions through FOMC meetings or CPI releases unless your stop is wide enough to absorb a 2-3% gap. Most swing traders close positions the day before major news and re-enter after the dust settles. You miss potential continuation, but you avoid catastrophic stops from overnight gaps.
For directional trades, use Daily and H4 timeframes on ES (S&P 500 futures) or NQ (NASDAQ futures). A typical Daily swing lasts 3-5 days and covers 80-150 points on ES or 300-500 points on NQ. Risk 30-40 points on ES, target 90-120 points. Risk 100-150 points on NQ, target 300-450 points.
Indices trend cleaner than Forex during strong risk-on or risk-off periods. When VIX drops below 15, expect choppy ranges with frequent failed breakouts. When VIX spikes above 25, expect stronger trends but wider intraday swings. Adjust your holding timeframe accordingly. Low VIX = shorter swings (2-3 days). High VIX = longer swings (5-7 days).
Building a Trade Log That Teaches You
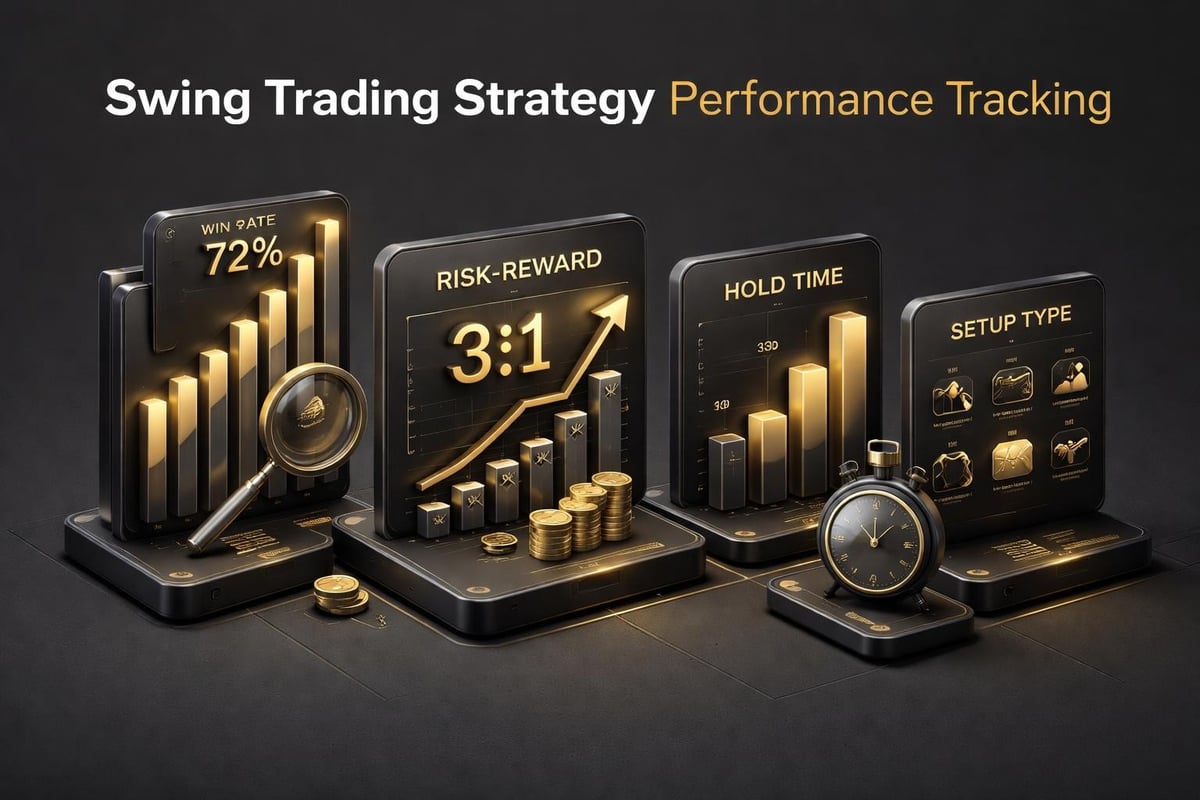
Every swing trade you take generates data. Entry timeframe, direction timeframe, asset class, setup type, risk-reward ratio, hold time, outcome. Most traders track profit and loss. Few track the variables that created the profit or loss.
Your trade log needs nine columns: Date, Asset, Direction Timeframe, Entry Timeframe, Setup Type, Risk %, RR Ratio, Hold Time, Outcome. Setup Type describes what triggered the entry: demand zone rejection, resistance break, VWAP bounce, or session liquidity shift. This lets you filter by setup type after 50 trades and see which setups actually work for you.
Hold time reveals whether you're exiting too early or too late. If your average winning trade lasts two days but your average losing trade lasts four days, you're letting losses run and cutting winners short. Flip that. If your average winner lasts five days but you planned for three-day swings, your targets might be too conservative.
Run the numbers monthly. Calculate your win rate, average RR on winners, average RR on losers, and maximum consecutive losses. If your win rate sits at 45% but your average winner is 2.8R and average loser is 1R, you're profitable despite losing more often than winning. That's a valid system. If your win rate is 65% but your average winner is 1.2R and average loser is 1R, you're barely breaking even. You need bigger targets or tighter stops.
Recognizing When Your Edge Disappears
Markets shift. A swing trading strategy that worked flawlessly on EUR/USD during 2024's trending environment might fail during 2026's ranging conditions. Your job isn't to force the same strategy onto different conditions. Your job is to recognize when conditions changed and adapt or step aside.
Trending markets reward directional swing trades. You catch 150-pip moves on clear pullback entries. Ranging markets chop you to pieces. You enter the pullback, price reverses 40 pips in your favor, then reverses again and stops you out. Three losses in a row tell you the market structure changed.
When you hit three consecutive losses using the same setup type on the same asset, stop trading that setup on that asset. Don't modify your strategy mid-losing streak. Don't tighten stops or widen targets to "fix" it. Just stop. Review your trade log. Check if the Daily timeframe still shows clear trends or if it shifted to overlapping ranges.
If the structure changed from trending to ranging, your swing strategy won't work until it trends again. Switch to range-bound strategies (sell resistance, buy support) or move to a different asset class that's currently trending. Crypto might range while Indices trend. Forex majors might chop while exotic pairs trend. Your edge exists in specific conditions on specific assets. When those conditions disappear, your edge disappears. Accept it and move.
Combining Multiple Timeframes for Confirmation
You already know direction comes from Daily or H8. Entry comes from H4 or H1. But what about the 15-minute and 5-minute charts? These micro timeframes don't give you new direction. They give you entry precision within your H1 setup.
Here's the full flow: Daily shows uptrend (direction). H4 shows pullback into demand zone (setup). H1 shows rejection candle close (entry signal). Before entering, check 15-minute chart. Is price respecting the H1 rejection candle low? Is volume increasing on the bounce? If 15-minute breaks below the H1 rejection low, your setup invalidated. Don't enter.
This layer of confirmation filters out H1 rejection candles that fail on lower timeframes before you enter. It adds five minutes to your analysis but removes 30-40% of failed trades. The mechanics: H1 candle closes as a hammer at 10:00 AM. You check 15-minute chart from 10:00 to 10:15. If that first 15-minute candle closes above the H1 hammer low, you have confirmation. If it closes below, the rejection already failed.
Weekly timeframe serves a different purpose. It shows you the macro trend and major structure levels. If you're swing trading Daily pullbacks, checking Weekly tells you whether your Daily uptrend is a small counter-trend move inside a larger Weekly downtrend or a genuine trend continuation. Trade with the Weekly trend when possible. Counter-trend swing trades have lower win rates and require tighter stops.
Risk Management Beyond Stop Loss
Your stop loss protects you from individual trade disasters. Your position sizing protects you from cumulative disasters. Your correlation analysis protects you from concentrated disasters. Most traders focus only on the first one.
Position sizing means risking the same percentage on every trade regardless of pip distance. If your stop on EUR/USD is 50 pips and your stop on GBP/JPY is 80 pips, your position size on GBP/JPY must be smaller to maintain equal risk. Use a calculator: (Account Size × Risk %) ÷ Stop Loss in Pips = Position Size. For a $10,000 account risking 1.5% with a 60-pip stop, that's ($10,000 × 0.015) ÷ 60 = $2.50 per pip, or 0.25 lots on Forex.
Correlation analysis means checking if your open trades move together. If you're long EUR/USD, long GBP/USD, and long AUD/USD simultaneously, you're essentially 3× long on the Dollar's weakness. If Dollar strengthens, all three trades lose together. Your risk isn't 1.5% per trade. It's 4.5% on one directional bet. Limit correlated positions to two at most, or use inverse correlations (long EUR/USD, short USD/JPY) to hedge.
Maximum open trades matter more than maximum risk per trade. Even with perfect 1.5% risk per trade, opening seven positions simultaneously exposes you to 10.5% total risk if a Black Swan event stops all of them out. Cap open trades at three to five, depending on your account size and drawdown tolerance. This forces you to prioritize the best setups instead of trading every pullback you see.
Swing trading strategies work when you separate direction from entry, use multiple timeframes for confirmation, and maintain strict risk controls across all positions. The challenge isn't finding setups but executing them with discipline across different market conditions and asset classes. PipTrend eliminates the guesswork by showing you trend direction through non-repainting signals, precise entry levels at institutional liquidity zones, and multi-timeframe confirmation before every trade. Start with the 3-day trial and apply these strategies to your next swing trade with a system that works the same way every time.