
You open TradingView, load five indicators, and watch them contradict each other. One shows bullish momentum on EUR/USD while another flashes a sell signal. Your 5-minute chart says buy, your H1 says wait, and your Daily tells you to flip short. You enter anyway because one indicator looked convincing. The trade reverses 12 pips later. This happens because most traders misunderstand what an indicator tradingview tool actually does and how to combine them without creating noise.
What Makes an Indicator TradingView Tool Worth Using
Not all indicators serve the same purpose. You need to separate direction from entry timing from trade management. Most traders pile on RSI, MACD, moving averages, and Bollinger Bands expecting clarity. Instead, they get conflicting signals because these tools answer different questions. RSI tells you momentum. Moving averages suggest trend. Neither tells you where to enter or when institutional liquidity sits.
The best indicator tradingview setups assign one clear role to each tool. You use one indicator to determine if you're buying or selling. You use another to find precise entry zones. You use a third to confirm strength across multiple timeframes. When you blend these roles, you get decision paralysis. When you separate them, you get a repeatable process.
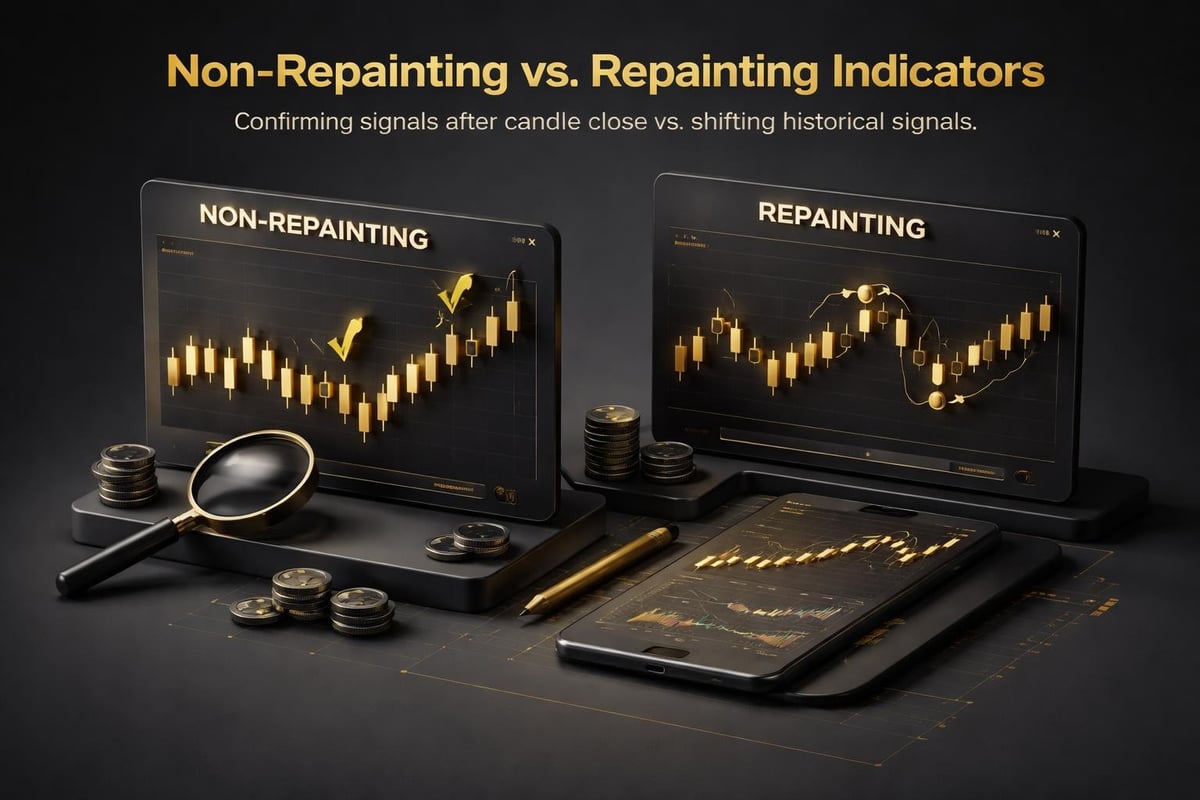
Repainting creates the biggest trap. Many free indicators look perfect in hindsight because they redraw after the candle closes. You see a buy signal that appeared at the low, but in real time, that signal never existed until price had already moved 40 pips. Check any indicator by scrolling back through closed candles. If the signals shift positions or disappear, the tool repaints. Non-repainting indicators show signals only after candle confirmation. They look less impressive on static charts but perform consistently in live conditions.
How to Choose Indicator TradingView Tools by Trading Style
Your timeframe dictates which indicators matter. Scalpers working 1-minute and 5-minute charts need speed and low latency. Day traders on 15-minute and H1 charts need session context. Swing traders on H4 and Daily charts need trend strength without noise. Pick indicators that match your hold time.
For scalping and day trading, you need entry precision at institutional levels. VWAP acts as dynamic support and resistance throughout the session. High of day and low of day (HOD/LOD) create psychological barriers where reversals cluster. Supply and demand zones mark where large orders historically absorbed price. These aren't lagging indicators. They show you where liquidity sits before price arrives. You watch price approach VWAP on a 5-minute EUR/USD chart, wait for a bullish engulfing pattern, and enter with a 10-pip stop and 20-pip target. That's a 1:2 risk-to-reward ratio built on structure, not guessing.
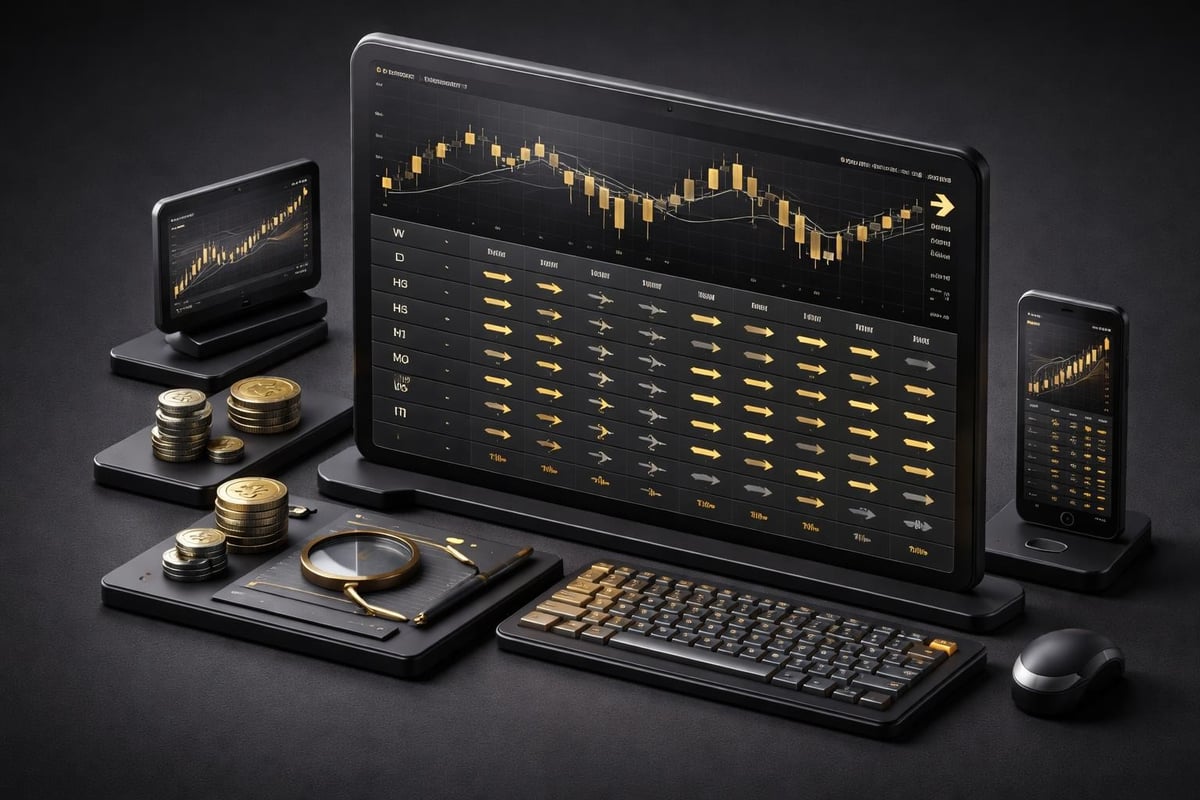
For swing trading and position trading, you need trend confirmation across timeframes. A multi-timeframe table that displays 12 timeframes simultaneously eliminates the need to flip between chart windows. You see Weekly, Daily, H8, H4, H1, and lower timeframes aligned in one view. If Daily shows bullish and H4 shows bullish but H1 shows bearish, you wait. You only enter when at least three consecutive timeframes agree. This approach filters out 70% of low-probability setups before you risk a single pip.
Asset class also changes indicator relevance. Forex pairs like EUR/USD, GBP/USD, and USD/JPY respect session liquidity and VWAP more than equities. Crypto markets like BTC/USD and ETH/USD move 24/7, so session-based tools need adjustment. Indices like S&P 500 and NASDAQ react strongly to overnight gaps and pre-market levels. Stocks require volume confirmation more than currency pairs. Choose indicators that align with the behavior of what you're trading, not what looks popular on social media.
Direction Is Not the Same as Entry Timing
This distinction separates consistent traders from those who lose slowly. An indicator might tell you EUR/USD trends bullish on the Daily chart. That's direction. It does not tell you to enter at current price. You need a second decision: where within that trend do you get the best risk-to-reward ratio?
Direction indicators include moving average crossovers, trend-following signals, and momentum tools that identify whether you're looking for longs or shorts. These work on higher timeframes like H4, Daily, and Weekly. You use them to filter out counter-trend trades. If your direction indicator says bullish, you ignore every short setup no matter how tempting it looks on a 15-minute chart.
Entry indicators pinpoint specific price levels where probability shifts in your favor. These include support and resistance zones, liquidity levels like VWAP, Fibonacci retracements, and order blocks. You wait for price to reach these zones, then confirm with price action like engulfing candles or pin bars. Entry indicators work on execution timeframes like 5-minute, 15-minute, and H1.
Most traders fail because they use direction tools for entries. They see a moving average crossover on H1 and enter immediately at market price. No consideration for whether price sits at resistance, no plan for where the next liquidity zone sits. The trade has a 25-pip stop because that's where the crossover invalidates, but the next support sits only 8 pips away. You just gave yourself a 1:3 risk-to-reward setup. That's not an edge. That's gambling with extra steps.
Separating these decisions means you first check your direction indicator on H4 or Daily. If it says bullish, you then drop to your entry timeframe and wait for price to pull back to a liquidity zone. Only when both align do you take the trade. This two-step filter reduces trade frequency by half but doubles win rate because you're no longer forcing trades against structure.
Building a Unified Indicator TradingView System
The mistake most intermediate traders make is adding indicators one at a time without a plan. You add RSI because a YouTube video said so. Then you add Bollinger Bands because a blog mentioned it. Then you add three moving averages because your trading group uses them. Your chart becomes unreadable. Worse, you don't know which signal to follow when they conflict.
A unified system means every indicator plays a defined role and works together. You need three categories: direction, entry, and management. Direction tells you the bias. Entry tells you where to execute. Management tells you whether to hold, scale, or exit.
Here's how this works in practice. You trade GBP/JPY on a day trading strategy. Your direction indicator runs on H4 and shows a confirmed BUY signal. You know you're only looking for long entries today. You drop to your 15-minute chart and watch for price to retrace to a session liquidity level, maybe the London open VWAP or an overnight low. Price touches VWAP, forms a bullish engulfing candle, and your entry indicator confirms the setup. You enter long.
Now you need management. You check your multi-timeframe table. It shows H4, H1, and 15-minute all bullish. M5 just flipped bullish. This tells you momentum supports your trade. You set your stop 15 pips below VWAP and your first target at 30 pips, aiming for a 1:2 risk-to-reward ratio. As price moves, you monitor the table. If H1 flips bearish while you're up 20 pips, you tighten your stop or exit at breakeven. The table acts as real-time trade management, not a static set-and-forget tool.
This approach works across Forex, Crypto, Indices, and Stocks because the logic stays consistent. The specific levels change, but the process does not. Same rules, every trade. No guessing. No emotional overrides.
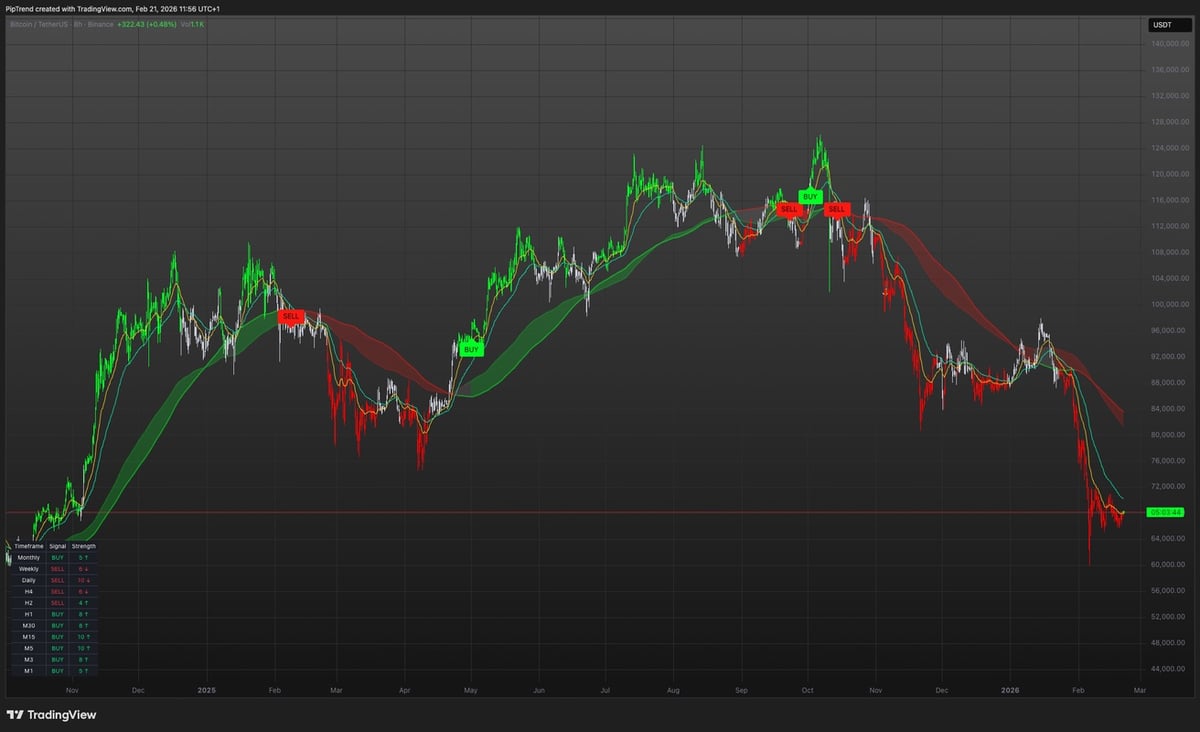
For traders who struggle with conflicting signals and cluttered charts, PipTrend combines direction, entry, and management into one system. PipTrend Core/V2 handles trend direction with non-repainting BUY/SELL signals, Session Liquidity marks precise entry points at institutional levels like VWAP and supply/demand zones, and the Multi-Timeframe Table shows 12 timeframes at a glance for trade management. One subscription, one unified process, every asset class.
How to Test and Validate Indicator TradingView Setups
Backtesting reveals whether your indicator combination actually works or just looks good. You need at least 50 trades across different market conditions to see a pattern. Pull up TradingView's bar replay feature. Start from three months ago and step through each candle manually. Mark every signal your indicators generate. Record entry price, stop loss, take profit, and outcome.
Track these numbers: win rate, average risk-to-reward ratio, maximum consecutive losses, and largest drawdown percentage. A 55% win rate with 1:2 RR ratios produces profit over time. A 45% win rate with 1:3 RR ratios also works. A 60% win rate with 1:1 RR ratios breaks even after spreads and commissions. Most traders never calculate this. They trade for two weeks, hit a losing streak, and blame the indicators.
Forward testing matters more than backtesting. Open a demo account and trade your indicator setup in real time for 30 days. No hindsight. No cherry-picking. Just follow the signals exactly as they appear. You'll discover issues backtesting misses. Maybe your entry indicator triggers too late on high-volatility news candles. Maybe your direction tool works on trending days but whipsaws during range-bound sessions. These insights only surface when you trade the system live without knowing future price action.
Prop firm traders need even tighter validation because drawdown limits kill accounts faster than bad entries. If your firm sets a 5% daily drawdown limit and 10% total drawdown, you cannot afford three consecutive full-stop losses. Your indicator setup must include position sizing rules that risk no more than 1% per trade. This means a $100,000 account risks $1,000 per trade maximum. If your stop loss is 20 pips on EUR/USD, you trade 5 mini lots. Your indicators might generate 10 signals per day, but you only take the three that meet all criteria. Discipline beats frequency.
Common Indicator TradingView Mistakes and How to Fix Them
Mistake one: loading indicators without understanding what they measure. RSI shows momentum, not direction. A reading of 70 means overbought momentum, not a sell signal. Price can stay overbought for 200 pips in a strong trend. If you sell every RSI 70 reading, you'll get stopped out repeatedly. Fix this by pairing RSI with a trend filter. Only take RSI reversals when they align with higher timeframe direction.
Mistake two: trusting default settings without testing. Most indicators ship with default parameters like 14-period RSI or 20/50 moving averages. These settings work on some assets and fail on others. EUR/USD might respond better to a 21-period RSI on H1 charts. GBP/JPY might need a 9-period setting because it moves faster. Test multiple settings across 50+ trades before committing. Don't just copy someone else's setup and assume it fits your strategy.
Mistake three: ignoring timeframe context. A bullish signal on a 1-minute chart means nothing if Daily and H4 trend bearish. You're trading against the primary trend, which cuts your win rate below 40% even with good entries. Always check at least three timeframes above your entry chart. If you trade 15-minute setups, verify H1, H4, and Daily alignment. If two of those three contradict your signal, skip the trade. You'll take fewer trades but win more consistently.
Mistake four: adding indicators to compensate for lack of price action skills. No indicator replaces the ability to read candlestick patterns, support and resistance, and order flow. Indicators are tools that enhance decisions, not replacements for market structure knowledge. If you can't identify a valid support level or recognize an engulfing pattern, adding another oscillator won't help. Spend time learning price action fundamentals before layering indicators on top.
Mistake five: expecting indicators to work in every market condition. Trend-following indicators fail during range-bound sessions. Mean-reversion tools fail during breakouts. You need filters that identify market state before applying your indicator setup. One simple filter is ATR (Average True Range). If ATR on H4 drops below its 20-period average, volatility is low and breakouts often fail. You skip breakout signals and wait for range-based setups instead. If ATR spikes above average, ranges break and trend signals gain reliability. Adjust your approach based on conditions, not emotions.
Advanced Indicator TradingView Strategies for Consistency
Once you've tested a basic system and proven it works, you refine it with advanced techniques. Confluence stacking means layering multiple confirmation factors at a single entry point. Price reaches a Daily support level, VWAP aligns at the same zone, and a Fibonacci 61.8% retracement sits two pips below. You also see an unfilled order block from last week. That's four layers of confluence. Your entry becomes higher probability because multiple institutional and technical factors converge. You tighten your stop loss from 25 pips to 15 pips because the level is more precise, improving your risk-to-reward ratio from 1:2 to 1:2.6.
Session-based filtering increases win rates by avoiding low-liquidity periods. The Asian session on Forex pairs often ranges with low volatility. If your indicator generates a breakout signal at 2 AM GMT, you skip it. Wait for London open at 8 AM GMT or New York open at 1 PM GMT when liquidity floods the market and breakouts sustain. This one filter eliminates 30% of false signals without changing your indicator settings.
Dynamic exits improve profit capture compared to static take-profit levels. Instead of always targeting 30 pips, you monitor your multi-timeframe table. If M15, H1, and H4 all remain bullish and price breaks above the previous swing high, you trail your stop instead of exiting. This lets runners move 60 or 80 pips while your initial risk stays locked. You sacrifice some win rate (runners sometimes retrace and hit breakeven stops) but increase average win size. Over 50 trades, this shift can add 15% to total profit even if win rate drops 5%.
News event filtering prevents indicator signals from triggering during high-impact releases like NFP, CPI, or central bank decisions. Mark your calendar with major events using TradingView’s economic calendar integration. Disable trade entries 30 minutes before and after these releases. Indicators cannot predict fundamentally driven price spikes. A perfect technical setup gets destroyed when a surprise rate hike drops and price moves 120 pips in 90 seconds. Protect your account by staying flat during chaos.
Building Custom Indicator TradingView Tools with Pine Script
If you need functionality beyond pre-built indicators, Pine Script lets you code custom tools. You don't need software engineering experience. Basic logic and TradingView's documentation get you started. James Bachini’s Pine Script tutorial walks through building real strategies from scratch, including how to plot signals and backtest performance.
Custom indicators solve specific problems. Maybe you want an alert that triggers only when three conditions align: H4 bullish, price at VWAP, and RSI below 40. No pre-built tool does this exact combination. You write a Pine Script that checks all three variables and plots a BUY label only when they're true simultaneously. This eliminates manual chart scanning and ensures you never miss setups that meet your criteria.
Another use case is combining multiple indicators into a single visual output. You track trend direction from one indicator, momentum from another, and volume confirmation from a third. Instead of cluttering your chart with three separate panels, you code a unified dashboard that displays all three readings in one compact table. This keeps your chart clean while preserving decision-making data.
Risk management automation becomes possible with custom scripts. You can code an indicator that calculates position size based on your account balance, stop loss distance, and risk percentage. Enter your stop loss level, and the script instantly tells you how many lots to trade. This removes math errors that lead to oversized positions and blown accounts. Prop firm traders especially benefit from automated risk calculations because challenge rules leave zero room for error.
Testing custom indicators requires the same rigor as pre-built tools. Run bar replay across 100+ trades. Check for repainting by comparing real-time signals to historical signals. Validate that alerts fire correctly and that plotted levels match actual price action. Many custom scripts look perfect on static charts but fail during live market conditions because of lookahead bias or incorrect calculation logic. Learn more about backtesting best practices to avoid these traps.
How Indicator TradingView Alerts Improve Execution
You cannot watch charts 12 hours per day. Alerts notify you when specific conditions trigger so you focus on high-probability setups instead of staring at screens. TradingView allows custom alerts based on indicator signals, price levels, and technical patterns. Setting up alerts properly ensures you never miss trades that meet your criteria while filtering out noise.
Configure alerts with tight conditions to avoid spam. A generic alert that fires every time RSI crosses 50 will ping you 40 times per day. A refined alert that triggers only when RSI crosses 50 and price sits above Daily VWAP and H4 shows a bullish signal reduces notifications to three per day. Each alert represents a pre-qualified setup worth evaluating.
Alert delivery methods matter for your trading style. Desktop notifications work if you sit near your computer. Mobile push notifications via the TradingView app suit traders who move throughout the day. Email alerts create a paper trail for review but arrive slower. Webhook alerts integrate with third-party platforms for automated execution (useful for algorithmic traders). Choose delivery methods that match your availability and response time.
Alert-based trading creates discipline for part-time traders. You set alerts for your A+ setups only: those that meet direction, entry, and timeframe alignment. You get notified at 10:30 AM. You check the chart, confirm the setup still looks valid, and execute within two minutes. You avoid the temptation to take marginal B and C setups out of boredom. Over a month, this approach cuts trade frequency by 60% but increases win rate by 18% because you only trade your best opportunities.
Don't rely on alerts as final execution triggers. They notify you of potential setups. You still verify price action, check higher timeframes, and confirm risk-to-reward ratios before entering. Alerts save time. They don't replace decision-making.
Choosing Between Free and Paid Indicator TradingView Options
TradingView's library includes thousands of free indicators covering every possible technical concept. Many provide solid directional bias. Few offer precise entry timing. Fewer still integrate direction, entry, and management into one system. Free tools serve as building blocks. You combine three or four to create a complete strategy. This requires understanding what each tool measures and how they interact.
Paid indicators often bundle multiple functions into one package. Instead of loading separate tools for trend, momentum, and support/resistance, you get an integrated system where components already work together. This reduces conflicts and simplifies decision-making. The trade-off is cost and potential vendor lock-in. You're trusting someone else's logic instead of building your own.
Evaluate paid tools by requesting verified trade results, not backtests. Explore community-shared indicators to see how other traders apply similar concepts. Read reviews focused on real performance, ease of use, and support quality. A $200/month indicator that generates two winning trades per week (20 pips each at 1:2 RR) pays for itself. A $50/month tool that produces conflicting signals wastes money regardless of price.
Test any paid indicator with a free trial before committing. Most reputable vendors offer 3 to 7-day trials. Trade the system live on demo during the trial. Take at least 10 trades following the indicator's rules exactly. Track outcomes. If the system produces the results advertised and fits your trading style, the subscription becomes a business expense that improves profitability. If it underperforms or feels unintuitive, move on.
Free tools work when you invest time learning how to combine them. Paid systems work when you value time over cost and want a pre-built solution. Neither guarantees profit. Your execution, risk management, and discipline determine results. The indicator only provides structure.
Separating direction from entry timing and adding multi-timeframe management eliminates most indicator conflicts. Test every setup across 50+ trades, track real numbers like RR ratios and drawdown percentages, and refine based on results. PipTrend unifies these three roles into one system: Core/V2 for non-repainting direction signals, Session Liquidity for entries at institutional levels, and a Multi-Timeframe Table for trade management across 12 timeframes. Built for Forex, Crypto, Indices, and Stocks with a 3-day free trial and verified trade results, it replaces cluttered charts with a repeatable process.