Bollinger Bands Explained: A Trader's Guide to Context
On this page
What Are Bollinger Bands, Really?
Ask ten retail traders what a Bollinger Band touch means and eight will say “reversal.”
That answer is the single most expensive misconception in technical analysis.
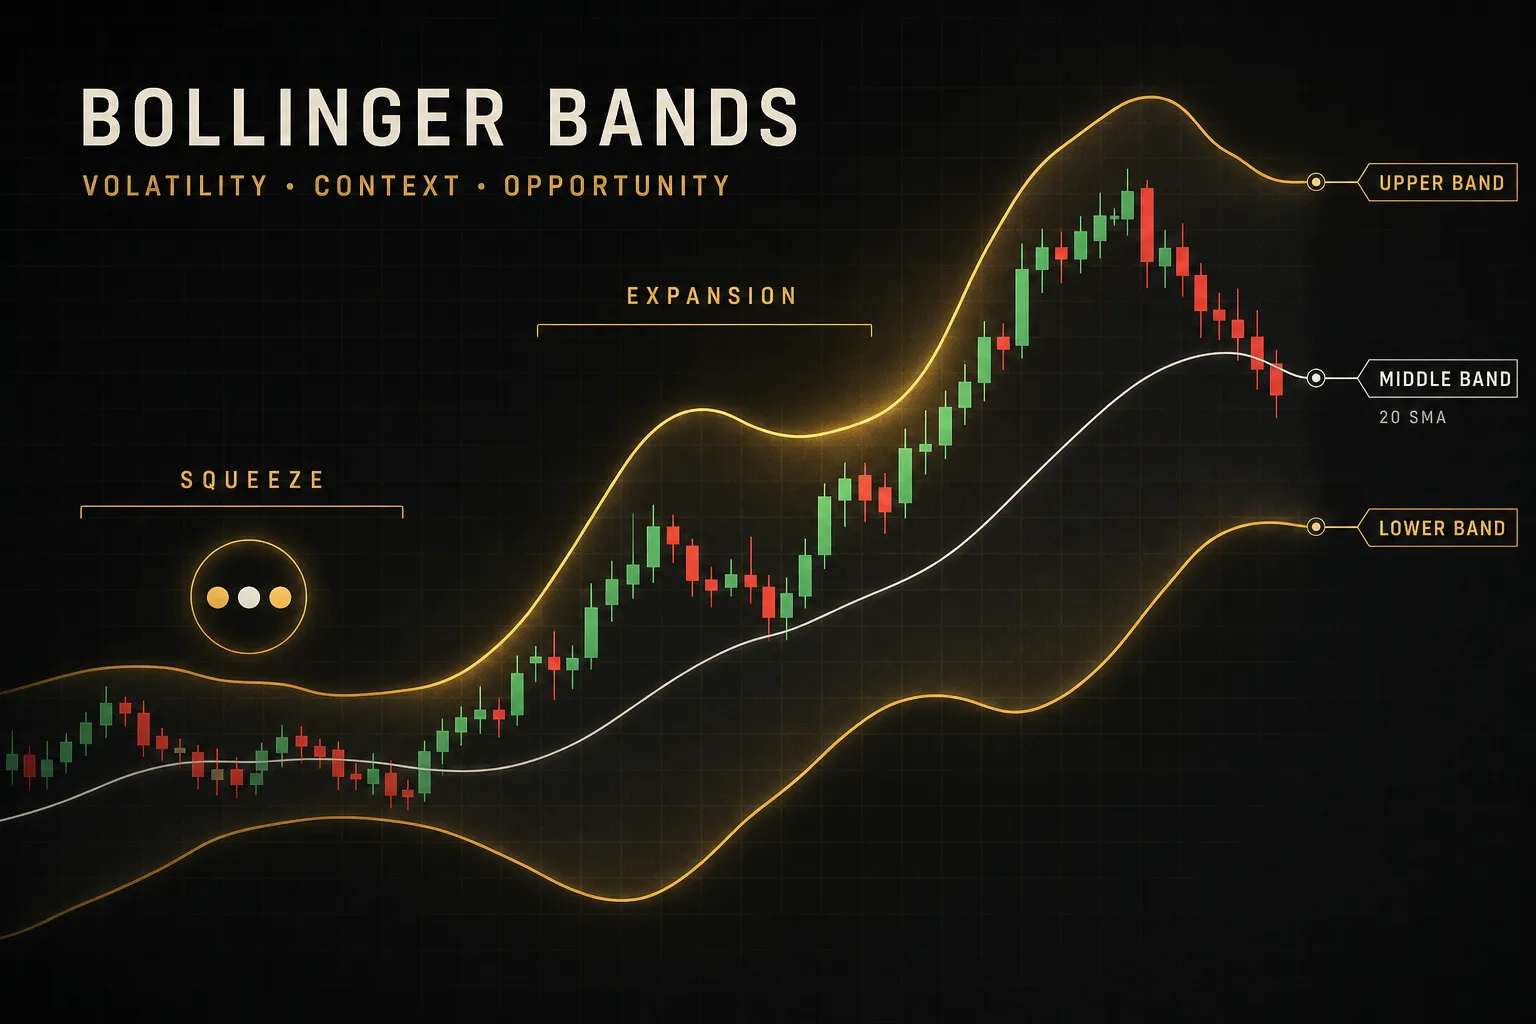
Bollinger Bands are a volatility envelope plotted around a moving average. John Bollinger built them in the early 1980s by taking a simple moving average and offsetting it above and below by a multiple of standard deviation.
When volatility rises, the bands widen. When it falls, they contract.
That’s the whole mechanism.
No prediction, no directional bias baked in.
Here’s what the bands actually tell you: where price sits relative to its own recent volatility. A touch of the upper band means price is statistically high compared to the last 20 periods.
It does not mean price is too high.
Those are different statements, and confusing them is why so many traders short strength and buy weakness at exactly the wrong moment.
Bollinger himself has said it plainly for decades: a tag of the band is not a signal. It’s an indication of relative price level that requires confirmation from something else.
What turns a band touch into a tradeable idea is context.
Four inputs matter most: the direction of the prevailing trend, what momentum is doing underneath the move, whether volume supports the push, and which market regime you’re operating in.
The same upper-band tag can mean reversion in a range, continuation in a trend, or the start of a volatility breakout out of compression.
Bollinger Bands work on stocks, index futures, forex pairs, and crypto, because standard deviation is indifferent to the asset.
But behavior is not identical across markets.
Deep, liquid instruments like S&P 500 futures produce clean, orderly band structure. Thin small caps and low-cap altcoins produce erratic widening around news and stop-hunt wicks that mean almost nothing.
Same math. Very different reliability.
The Formula Behind the Bands
You can trade Bollinger Bands without knowing the arithmetic, but you’ll misread them constantly. The formulas take about ninety seconds to understand and they change how you interpret every band touch afterward.
The Three Lines Explained
The default construction uses three lines, all derived from closing prices.
Middle band = 20-period simple moving average of closing price. This is the anchor, and in trending markets it often functions as dynamic support and resistance on pullbacks.
Upper band = 20-period SMA + (2 × standard deviation of the last 20 closes). Lower band = 20-period SMA − (2 × standard deviation of the last 20 closes).
Standard deviation is the key ingredient.
It measures dispersion, so it reacts to volatility much faster than the average itself.
When a quiet stock suddenly gaps on earnings, the standard deviation spikes and the bands flare open within a couple of bars while the SMA barely moves.
That asymmetry is a feature.
It’s why the bands describe volatility regime and the middle line describes trend.
%b and BandWidth: Beyond Visual Reading
Eyeballing a chart tells you “price is near the upper band.” Two derived indicators turn that vague impression into a number you can test, screen, and compare across instruments.
Percent B (written %b) = (Price − Lower Band) / (Upper Band − Lower Band).
Read it like a position scale.
A %b of 1.0 means price is exactly at the upper band, 0.0 means exactly at the lower band, and 0.5 means price sits on the middle band.
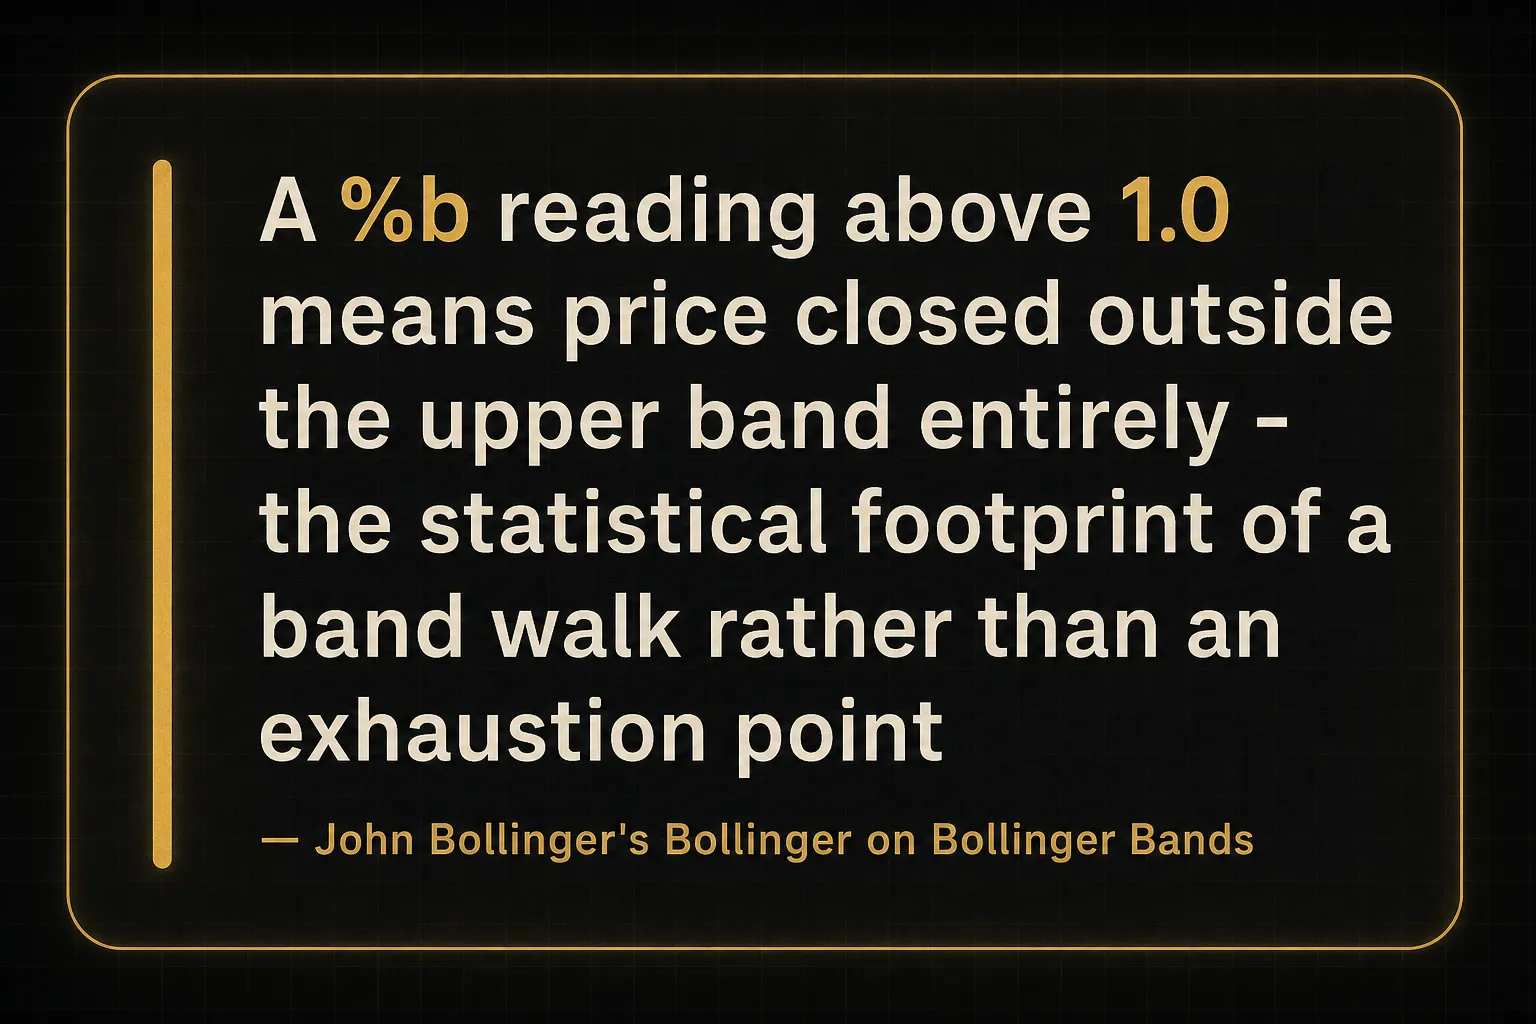
Above 1.0 means price has closed outside the upper band entirely, which is where band walks begin.
The value of %b is precision in comparison.
If today’s rally pushes %b to 1.04 and last week’s push reached 1.18, this move is objectively weaker relative to volatility even if the price is higher.
Your eyes can’t reliably make that call.
Bollinger BandWidth = (Upper Band − Lower Band) / Middle Band.
BandWidth normalizes band separation as a percentage of price, so you can compare a $12 stock to a $600 stock or Bitcoin to EUR/USD.
It’s the number that defines a squeeze.
When BandWidth drops to its lowest reading in six months, that’s not a subjective judgment about “tight” bands.
It’s measurable.
Why 20 and 2 Is a Convention, Not a Law
The 20-period, 2-standard-deviation setting came from Bollinger’s own work as a sensible default for daily charts, roughly one trading month of data. It stuck because it works reasonably well across many instruments, not because the math is sacred.
Shortening the lookback (say to 10 periods) makes the bands hug price.
Signals fire more often, the bands respond to volatility shifts faster, and false positives multiply.
Lengthening it (to 50 periods) smooths the noise but introduces lag, so you’ll get fewer signals and later confirmation.
The multiplier controls how much of the distribution sits inside.
At 2 standard deviations, roughly 88 to 89% of closes fall within the bands on typical financial data, lower than the textbook 95% because returns have fat tails.
Traders working with volatile crypto often widen to 2.5 or 3 to reduce noise tags; those trading tight-range forex pairs sometimes tighten to 1.5.
Bollinger’s own guidance: if you shorten the period, tighten the multiplier; if you lengthen it, widen it.
Change one and you should reconsider the other.
Reading Bands in Different Market Regimes
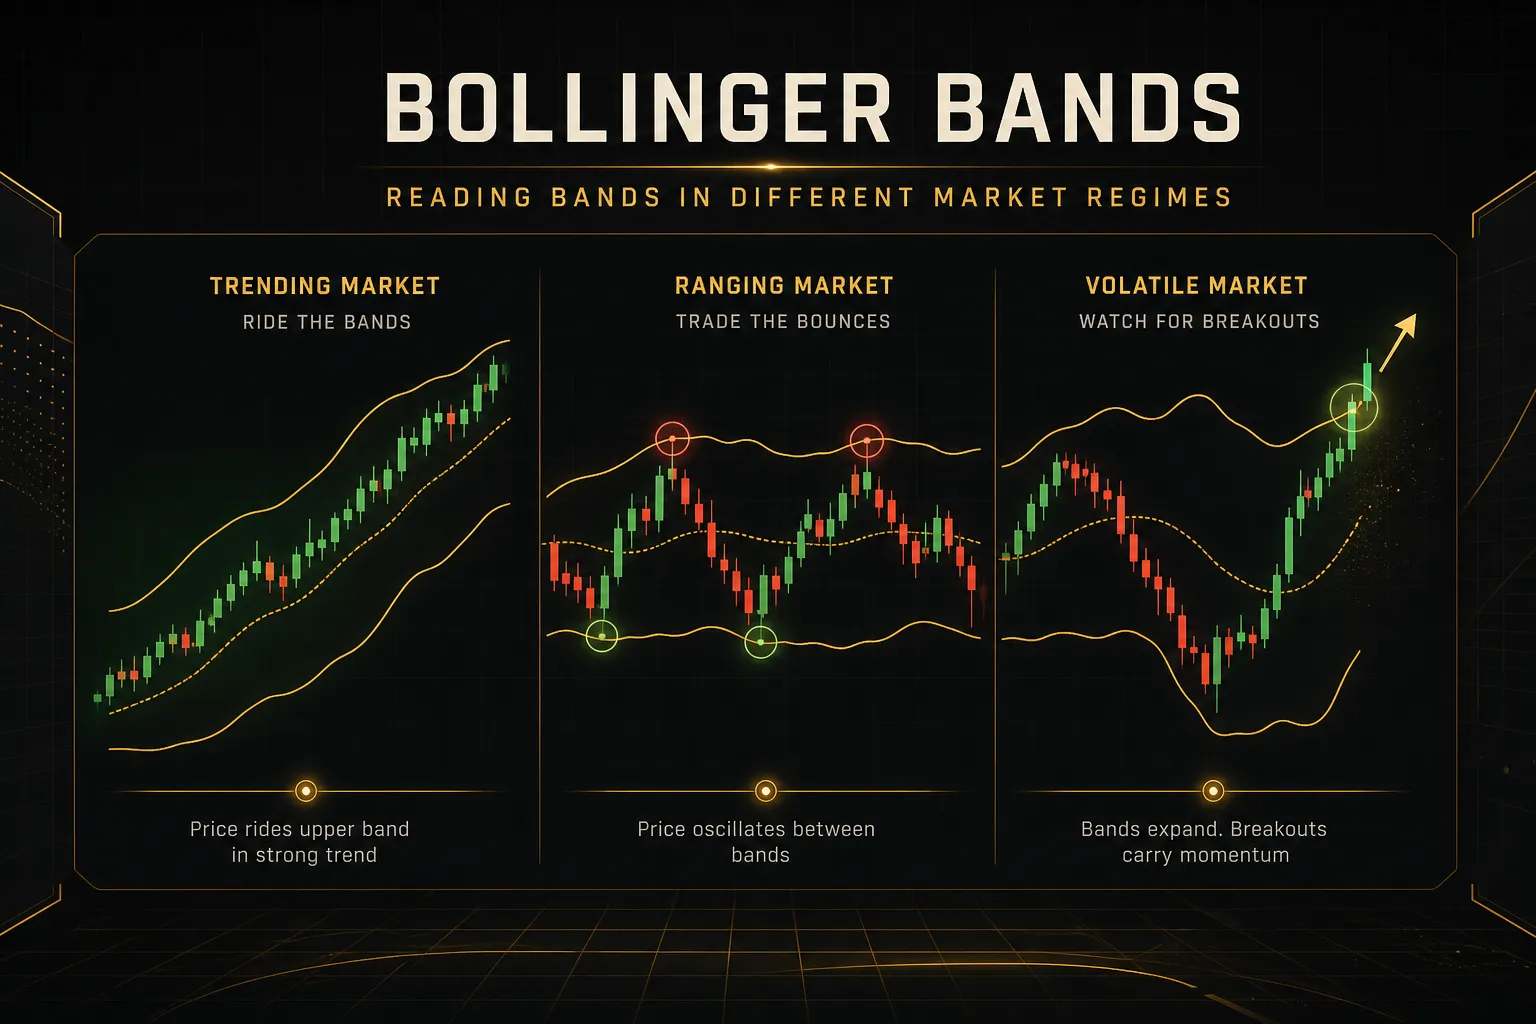
The reason Bollinger Bands frustrate so many traders is that the correct response to a band touch inverts depending on regime.
Get the regime right and the indicator becomes useful. Get it wrong and you’re systematically fighting the strongest moves in the market.
Mean Reversion vs Trend Continuation
In a ranging market, price oscillates around the middle band.
Touches of the outer bands frequently mark the edges of the range, and mean reversion back toward the 20-period SMA is the base case.
This is the behavior most Bollinger Band tutorials describe, and in a genuine range, it holds up.
In a strong trend, the same touch means the opposite.
Price can walk the band, closing at or outside the upper band for five, ten, even twenty consecutive bars, pulling the entire envelope upward with it.
Every touch looks like an overbought reversal.
Every short gets stopped.
A band walk is not an anomaly.
It’s the statistical signature of a trend strong enough that recent volatility keeps being exceeded.
So how do you tell which regime you’re in before you commit?
The practical filter is the middle band and the slope of longer-term structure.
If the 20-period SMA is rising steeply and pullbacks are finding support at or above it, you’re in a trend and upper-band tags favor continuation. If the SMA is flat and price crosses it repeatedly, you’re in a range and outer-band tags favor reversion.
The Squeeze: Compressed Volatility, Not a Direction
The Bollinger Band squeeze is the setup that gets hyped hardest and understood least. A squeeze occurs when Bollinger BandWidth compresses to a multi-month low, meaning realized volatility has collapsed and price is coiling.
Here’s the part that matters: a squeeze tells you volatility is low and likely to expand.
It tells you absolutely nothing about which direction the expansion will go.
Volatility is mean-reverting; direction is not.
Trading a squeeze without a confirmation process is a coin flip with extra steps, and the “head fake” (a brief false push one way before the real move the other) is common enough that Bollinger named it himself.
A workable confirmation checklist for squeeze breakouts:
- Volume expansion. The breakout bar and the bar after should show volume meaningfully above the recent average, ideally 1.5x or more. Compression that resolves on flat volume usually fails.
- A directional close outside the band, not an intrabar wick. Wicks beyond the band during low-liquidity hours are frequently stop hunts.
- Momentum agreement. MACD crossing in the breakout direction, or RSI pushing through 55 to 60 on an upside break, adds independent-ish evidence.
- BandWidth actually turning up. If BandWidth stays flat after the break, volatility hasn’t expanded and the move lacks fuel.
Band Walks and Different Instrument Behavior
A breakout and a band walk are two phases of the same event, and conflating them causes entry mistakes.
The volatility breakout is the initiating move out of compression, usually one to three bars, high risk and high reward.
The band walk is the sustained continuation phase that follows, offering lower-risk pullback entries to the middle band.
You size differently for each.
Breakout entries need wider stops and smaller positions because failure rates are higher.
Band-walk pullback entries can use tighter stops because trend structure is already established.
Instrument behavior varies more than most traders expect:
- Trending stocks and indices. Clean band structure, reliable middle-band support in uptrends, and long orderly band walks. The best environment for textbook interpretation.
- Ranging forex majors. Pairs like EUR/USD in quiet sessions revert to the middle band consistently, but band structure distorts violently around central bank announcements and NFP releases.
- High-volatility crypto. Bands are wide almost permanently, band walks are extended and brutal, and 24/7 trading means weekend liquidity gaps produce band tags that carry no information.
- Low-liquidity instruments. Thin small caps and micro-cap tokens produce bands that flare erratically on single large orders. Standard deviation calculated on noisy prints describes noise, not volatility regime.
Building a Practical Bollinger Band Plan
Knowing the theory changes nothing until it becomes a written process.
This section converts the concepts above into decisions you can repeat, test, and audit.
Day Trading and Swing Trading Approaches
Timeframe determines settings, signal frequency, and which behaviors you’re hunting.
The two approaches are genuinely different jobs.
- Day trading settings. Many intraday traders shorten to 10 to 14 periods on 5-minute or 15-minute charts, keeping the multiplier near 1.8 to 2.0 so the bands stay responsive without becoming noise generators.
- Day trading focus: intraday squeezes. The classic pattern is midday BandWidth compression resolving into an afternoon expansion, or a pre-open coil breaking on the opening-range drive.
- Day trading requires session volume awareness. Band tags in the first 15 minutes and the last 10 minutes of the US session behave differently from the 11am to 2pm dead zone. Volume context is not optional intraday.
- Swing trading settings. Daily charts with standard 20/2, sometimes weekly bands for regime context. Fewer signals, far less screen time, better signal-to-noise ratio.
- Swing trading focus: trend riding. Identify an established band walk on the daily chart, then wait for a pullback to the middle band as your entry zone rather than chasing the outer band.
- Swing trading focus: multi-week squeezes. A daily BandWidth reading at a six-month low on a liquid stock is one of the more reliable setups the indicator produces, because the compression represents genuine institutional indecision rather than a lunchtime lull.
Pairing Bollinger Bands With Other Indicators
Confirmation only helps when it’s actually independent.
Stacking three indicators that all read the same price series produces confidence, not information.
- Volume is the strongest partner because it measures participation, not price. A band touch on expanding volume means something different from a band touch on drying-up volume, and no price-derived indicator can tell you that.
- A trend filter provides regime classification. A 50-period or 200-period moving average, or simply the slope of the middle band, tells you whether to expect reversion or continuation before you interpret a touch.
- RSI adds momentum confirmation with caveats. The useful signal is divergence: price tagging the upper band while RSI prints lower highs suggests the band walk is losing fuel. That’s a warning, not an entry.
- MACD helps time squeeze resolutions because a histogram flip through zero coinciding with a directional close outside the band gives you momentum confirmation that a wick alone doesn’t.
- Watch the overlap risk. RSI and Bollinger Bands are both mathematical transformations of the same closing prices. When both say “overbought,” you haven’t gathered two votes. You’ve gathered one vote counted twice.
- When indicators contradict, default to inaction. Price at the upper band with declining volume and bearish RSI divergence is a low-conviction environment. Sitting out is a valid position.
A Testable Trade Plan Template
Every element below should be written down before the trade, not decided during it.
If you can’t backtest a rule, it isn’t a rule.
- Market selection. Trade instruments with tight spreads and consistent volume. Screen out anything where average daily volume can’t absorb your position size without slippage.
- Regime classification. Label the chart trending or ranging using middle-band slope and a longer moving average before you look at band touches. This step decides whether you’re a reversion trader or a continuation trader today.
- Setup qualification. Define the specific condition numerically: BandWidth in the bottom 10% of its 6-month range for squeezes, or %b above 1.0 with a rising middle band for continuation.
- Entry trigger. Require a close, not a touch. For breakouts, a close outside the band with volume above 1.5x the 20-period average. For pullbacks, a close back above the middle band after a test.
- Stop-loss placement. Use volatility, not a fixed percentage. An ATR-based stop loss at 1.5 to 2x ATR, or a stop placed beyond the opposite band, keeps your risk proportional to current conditions.
- Position sizing from band width. Wide bands mean wide stops mean smaller share size. Calculate size from the dollar distance to your stop so risk per trade stays constant regardless of volatility regime.
- Target definition. For reversion trades, the middle band or opposite band. For continuation trades, trail behind the middle band and let the band walk decide the exit.
- Invalidation rule. Write the condition that kills the thesis: a close back inside the band within two bars of a breakout, or BandWidth failing to expand. Exit on invalidation, not on hope.
Systems built around multi-timeframe confirmation tables, like the approach PipTrend uses to align trend direction, entry level, and volatility context in one view, illustrate the underlying principle well.
The edge isn’t in the band touch.
It’s in requiring several independent conditions to agree before capital moves.
Avoiding False Signals and Bad Backtests
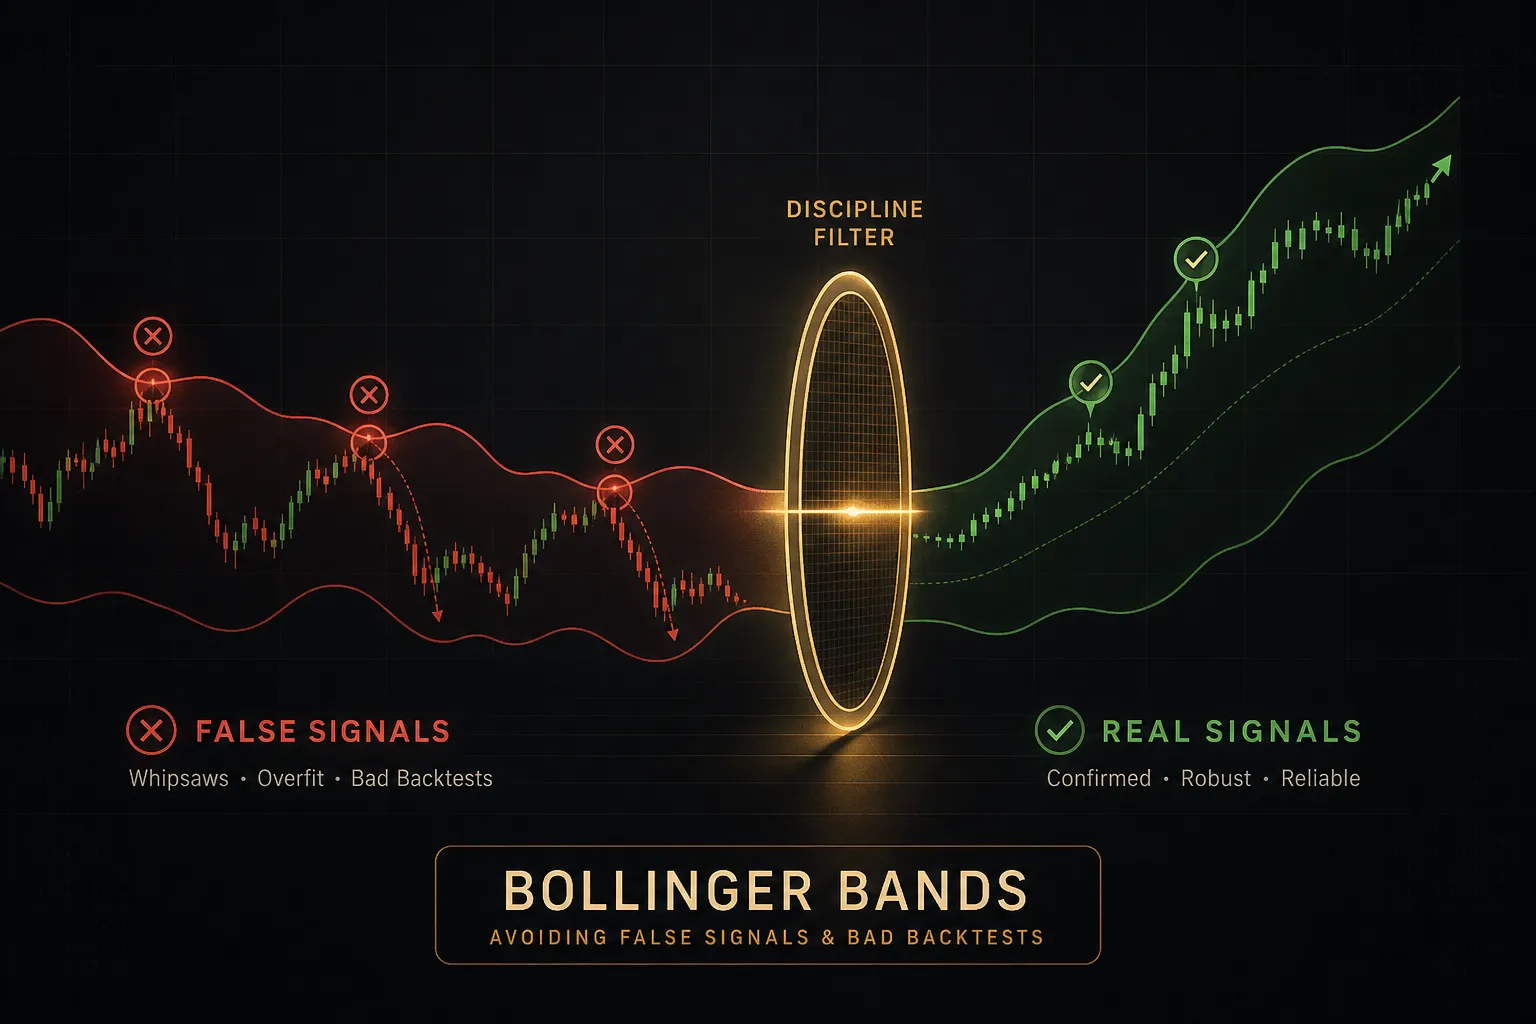
Most Bollinger Band strategies look profitable in a spreadsheet and lose money live.
The gap between the two is almost always the same handful of issues, and they’re all fixable.
Why Breakouts Fail
A close outside the band is a statistical event, not a promise.
Several structural conditions generate band violations that carry no directional information whatsoever.
Low liquidity. In thin order books, a single moderate order can push price through the band. The move reflects one participant, not a shift in market opinion, and it typically reverts within minutes.
Opening gaps. A stock gapping 4% on news will close outside the upper band on the first bar by definition.
That tells you news happened.
It doesn’t tell you the direction of the next four hours.
Spread widening around news. In forex and CFDs, spreads can multiply tenfold seconds before major releases. Your platform prints band tags built on distorted quotes, and your fill price bears no resemblance to your signal price.
Stop-hunt wicks. Price spikes beyond the band, triggers clustered stops, and reverses in the same candle. This is why an entry rule built on closes outperforms one built on touches, often dramatically.
And the statistical point underneath all of it: standard deviation bands are descriptive, not prescriptive.
They describe what recent prices did.
Financial returns have fat tails, so “outside two standard deviations” happens more often than a normal distribution predicts, and extended runs outside the band are entirely normal market behavior.
Backtesting Without Fooling Yourself
Backtests flatter the person running them.
Guard against it deliberately.
- Include real costs. Spread, commission, and slippage. A strategy averaging 8 ticks of profit per trade dies instantly at 3 ticks of round-trip cost, and mean-reversion strategies are especially vulnerable because their edge per trade is small.
- Eliminate look-ahead bias. Confirm every signal was knowable at candle close. Using the current bar’s close to trigger an entry at that same close is the most common silent error in indicator backtests.
- Handle survivorship bias. Testing a squeeze strategy on today’s index members excludes every company that collapsed and was removed. Your results describe survivors only.
- Split your data. Develop on in-sample data, validate on out-of-sample data you haven’t looked at. If performance collapses out-of-sample, you fitted noise.
- Track sample size. Fewer than 100 trades is an anecdote. Squeeze setups are rare, so a genuine test may require several years across multiple instruments.
Bollinger Bands vs Keltner and Donchian Channels
Bollinger Bands aren’t the only volatility envelope, and the alternatives have different structural biases that suit different strategies.
| Feature | Bollinger Bands | Keltner Channels | Donchian Channels |
|---|---|---|---|
| Calculation basis | SMA ± 2 standard deviations of price | EMA ± multiple of ATR | Highest high and lowest low over N periods |
| Reaction to volatility | Fast and sharp; spikes on single outlier bars | Smoother; ATR averages true range over time | Steps in blocks; changes only on new extremes |
| Built-in bias | Mean reversion at the outer bands | Trend following; fewer false tags | Pure breakout structure |
| Best suited for | Squeeze identification and range reversion | Riding established trends with ATR-based stops | Turtle-style breakout systems and stop trailing |
| Main weakness | Frequent band tags in strong trends | Slower to flag volatility compression | Ignores volatility entirely; wide in choppy markets |
Many experienced traders run Bollinger Bands and Keltner Channels together. When the Bollinger Bands contract inside the Keltner Channels, you have a mathematically defined squeeze that doesn’t rely on judgment at all.
Frequently Asked Questions
What is the best way to use Bollinger Bands?
Use them to classify volatility regime first and to generate signals second.
Check whether the middle band is sloping (trend) or flat (range), then read BandWidth to see whether volatility is compressed or expanded.
Only after those two checks should you interpret a band touch, because the same touch means reversion in a range and continuation in a trend.
Are Bollinger Bands good for day trading?
Yes, but they require adjustment and volume context.
Intraday traders typically shorten the period to 10 to 14 bars on 5- or 15-minute charts and focus on midday BandWidth compression resolving into afternoon expansion.
Without volume confirmation, intraday band tags produce a high rate of false signals, particularly during low-liquidity hours.
What does it mean when Bollinger Bands tighten?
Tightening bands mean realized volatility has fallen, nothing more.
This is the Bollinger Band squeeze, and because volatility tends to mean-revert, compression usually precedes expansion.
But it carries zero directional information, which is why squeeze trades need a confirmation trigger: a close outside the band on volume at least 1.5x the recent average, ideally with momentum agreement.
Should I buy when the price touches the lower Bollinger Band?
No, not on the touch alone.
A lower-band tag means price is statistically low relative to the last 20 periods, which in a downtrend often marks the start of a band walk lower rather than a bottom.
Buy lower-band touches only when the middle band is flat or rising, momentum shows divergence or a turn, and price closes back inside the band as confirmation.
Which indicator works best with Bollinger Bands?
Volume, paired with a longer-term trend filter.
Volume is the strongest companion because it measures participation rather than price, giving you genuinely independent information that no price-derived oscillator can supply.
RSI and MACD are useful for momentum divergence, but remember they’re calculated from the same closing prices as the bands, so agreement between them is one signal, not two.
What are the 20 and 2 settings on Bollinger Bands?
The 20 is the lookback period for the simple moving average and the standard deviation calculation, roughly one trading month on a daily chart.
The 2 is the standard deviation multiplier that sets band distance from the middle line, containing about 88 to 89% of closes on real market data.
Traders widen to 2.5 or 3 for volatile crypto and shorten the period for intraday work, following Bollinger’s guidance to tighten the multiplier when shortening the period.
The Takeaway on Band Touches
One mindset shift does most of the work here.
A band touch is a question about volatility and relative location, not an answer about direction.
Traders who lose money with Bollinger Bands almost always skipped the question and jumped to the answer.
Price hit the upper band, so they shorted.
In a band walk, that’s not a strategy… it’s a donation.
Do this tonight.
Pull up any chart you’re currently watching and, before labeling a single touch as a signal, answer two things: is the middle band sloping or flat, and is BandWidth compressed or expanded relative to the last six months.
Two checks, thirty seconds.
You’ll be surprised how many “obvious” setups fail the test.
Consistency doesn’t come from memorizing band patterns.
It comes from combining those context checks with fixed rules for entry, stop placement sized to current volatility, and a written invalidation condition you actually honor.
The indicator gives you information about volatility.
The plan is what turns it into a result.
Sources
Risk Disclaimer: Trading involves risk. Past performance doesn't guarantee future results. Only trade with money you can afford to lose. PipTrend is a tool to assist your trading decisions, not financial advice.