Altcoin Season Indicator: A Trader's Confirmation Guide
On this page
Why Everyone Watches This One Number
Every crypto cycle produces the same argument. Bitcoin rips 40%, a handful of altcoins rip 90%, and half of crypto Twitter declares altcoin season while the other half calls it a Bitcoin-led rally with a few loud exceptions.
The altcoin season indicator exists to settle that argument with data instead of vibes. It answers one question: over the last 90 days, did most large-cap altcoins actually beat Bitcoin’s return, or did they just go up alongside it?
That distinction is the whole game.
Capital rotation is a measurable event, not a feeling.
But here is where most traders go wrong.
They see a headline that says “altcoin season index hits 78” and immediately buy a basket of mid-caps at the exact moment breadth is already narrowing.
The index is a starting signal, not a trade trigger.
A single reading tells you what already happened. It says nothing about whether the rotation has room left, whether it is broad or concentrated in fifteen AI tokens, or whether Bitcoin dominance is falling for the right reasons.
This guide builds the full workflow around that number. How the index is calculated, why the 75 threshold matters more than 50, how to cross-check it against BTC.D, ETH/BTC, and the TOTAL2 chart, and how to manage risk once you have actual confirmation rather than a headline.
How the Altcoin Season Indicator Works
The mechanic is simpler than most people assume. The altcoin season index takes a fixed universe of top-ranked cryptocurrencies, measures each one’s percentage return over a rolling 90-day window, and counts how many of them outperformed Bitcoin over the identical period.
That count becomes a score out of 100.
If 62 of the eligible coins beat BTC, the index reads 62. If only 11 did, it reads 11 and the market is firmly in Bitcoin season.
Notice what the index does not measure.
It does not care how much altcoins gained. It does not weight by market cap. It does not care about volume.
It is a pure market breadth gauge, counting winners against a single benchmark.
That simplicity is both its strength and its limitation. Breadth is one of the cleanest ways to detect genuine capital rotation, because a real rotation lifts many boats at once.
A narrow narrative rally does not.
The 75-Coin Confirmation Rule
Crossing 50 feels like a milestone.
It is not one.
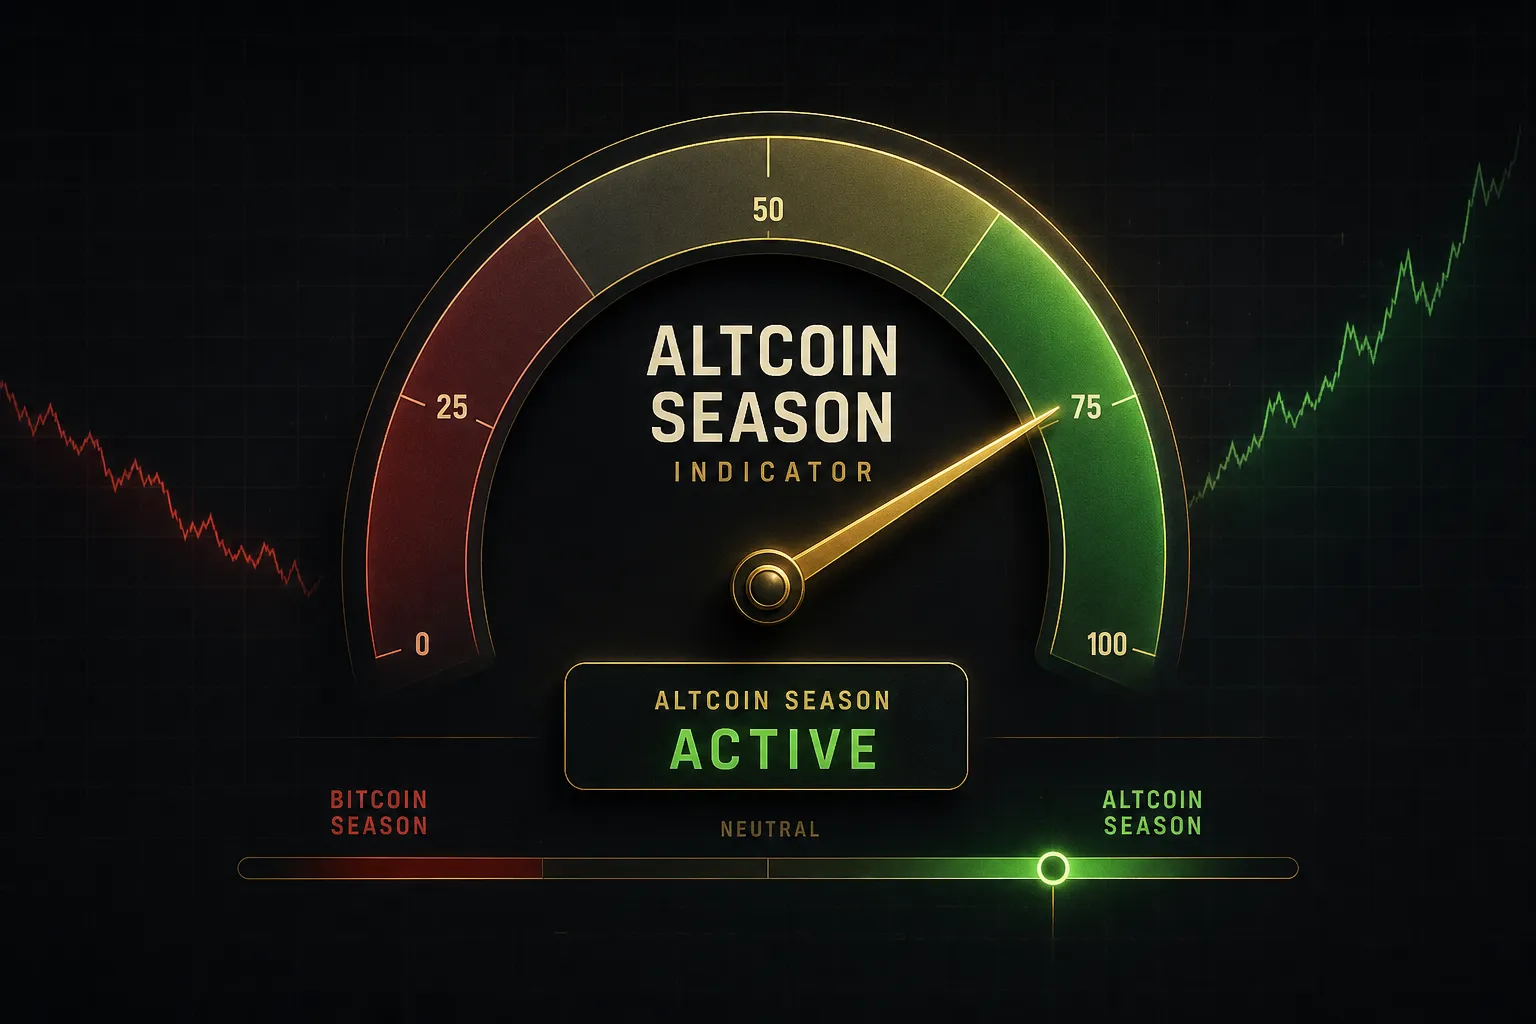
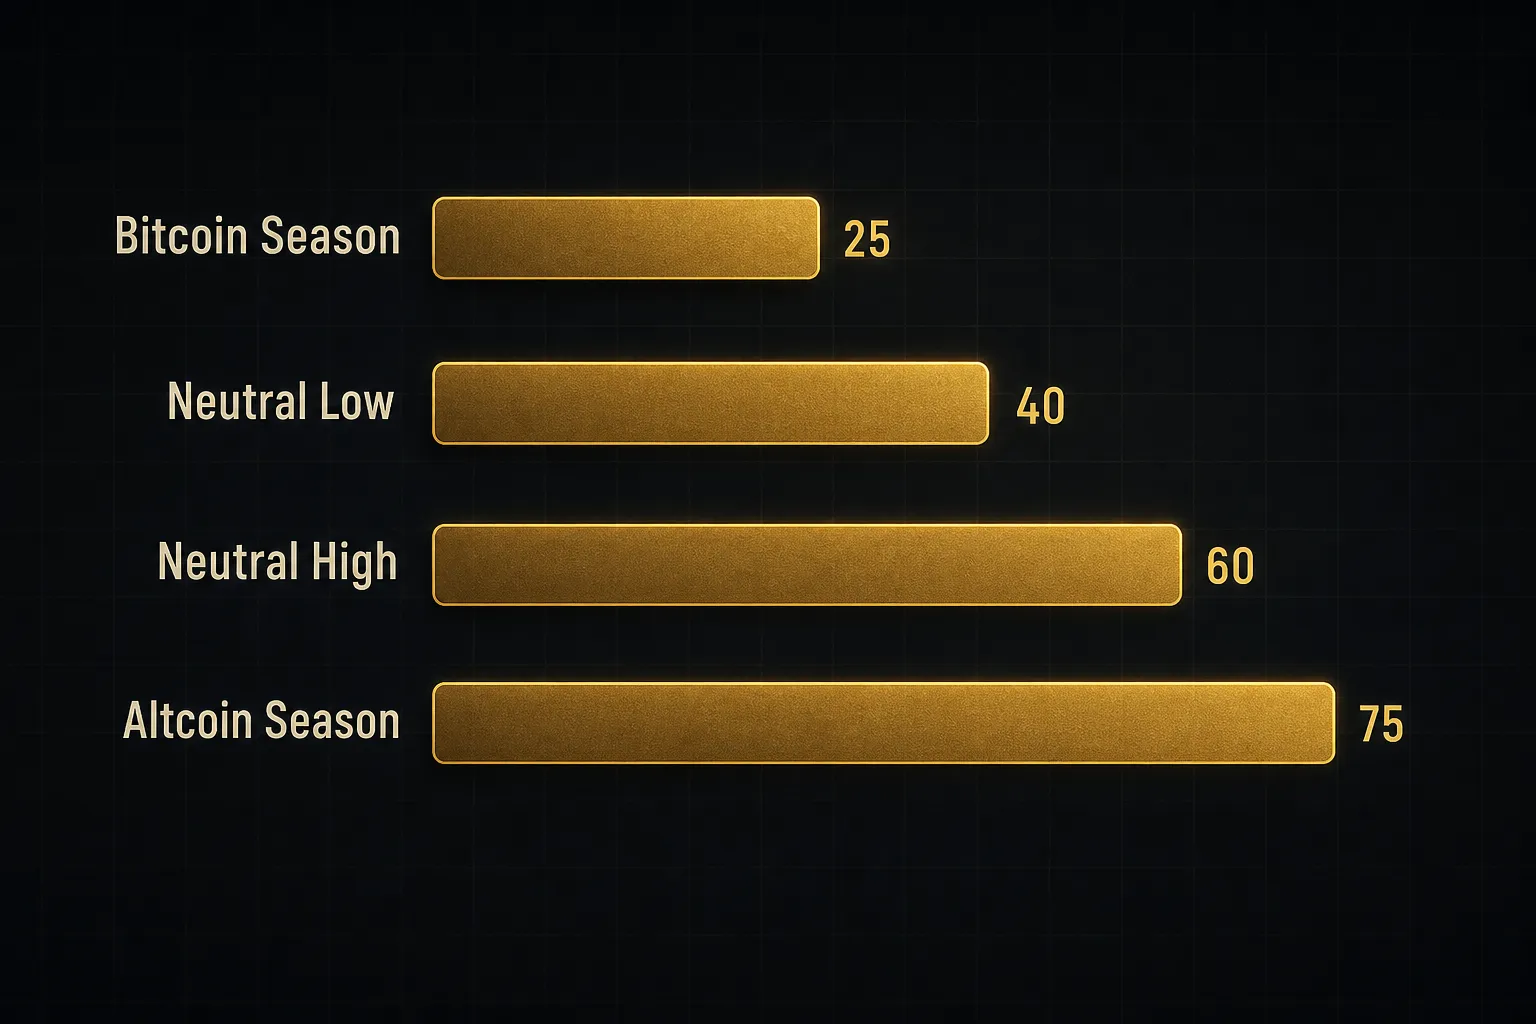
A reading of 50 means half the coins beat Bitcoin and half did not, which is roughly what you would expect from random dispersion in a normal market. The widely cited confirmation threshold is 75 or higher, meaning at least three quarters of the eligible coins outperformed BTC over the 90-day window.
Why 75? Because that level of breadth is statistically hard to produce without genuine capital moving down the risk curve.
When three out of four large caps beat Bitcoin simultaneously, you are no longer looking at a few narrative winners.
You are looking at a market regime shift.
The mirror threshold matters too. A reading of 25 or below defines Bitcoin season, where 75% or more of altcoins underperformed BTC.
CoinMarketCap vs BlockchainCenter
Two different sites, two different numbers, same moment in time. This confuses people constantly.
CoinMarketCap’s version screens the top 100 cryptocurrencies by market cap, while BlockchainCenter’s original index uses the top 50 cryptocurrencies. Both exclude stablecoins and both typically exclude wrapped or pegged assets, since a token designed to track another asset cannot meaningfully “outperform” anything.
A larger coin universe pulls in smaller, more volatile assets that tend to move harder in both directions. In a risk-on stretch, the top 100 version often prints a higher score than the top 50 version, sometimes by 8 to 15 points.
Neither is wrong.
They are answering slightly different questions about slightly different slices of the market.
The practical rule: pick one source, learn its normal behaviour, and stick with it. Comparing today’s CoinMarketCap reading against last month’s BlockchainCenter reading produces noise, not insight.
Why a 90-Day Window
The 90-day rolling return is the standard for a reason. It is long enough to smooth out the two-week narrative pumps that dominate crypto headlines, but short enough to still register a real regime change within a few weeks of it starting.
Shorter variants exist.
Some dashboards offer 30-day and 7-day versions, and they whipsaw badly. A 7-day index can swing from 20 to 70 and back inside a fortnight, generating signals that are almost pure noise.
Longer windows have the opposite problem.
A 12-month lookback confirms altcoin season roughly when it is ending.
The 90-day window is a compromise between responsiveness and reliability. Treat any reading shorter than 30 days as a curiosity, not a signal.
There is a structural flaw worth understanding: survivorship bias and ranking drift. The index measures whichever coins occupy the top 50 or top 100 today, then looks backward at their returns.
A token that rallied 400% and climbed into the top 100 last month gets counted as an outperformer, even though it was not eligible when the window started. Meanwhile, coins that collapsed out of the rankings quietly vanish from the calculation.
The net effect skews scores slightly upward during volatile stretches. It is a small distortion in most conditions and a meaningful one during frothy periods when rankings churn fast.
Reading the Score Without Overreacting
Here is a scenario that trips up experienced traders.
Your altcoin portfolio is up 25% over three months.
Feels great.
The altcoin season index reads 22, deep in Bitcoin season territory.
Both things are true.
Bitcoin gained 45% over the same period.
Absolute Gains vs Relative Strength
The index measures relative strength against Bitcoin, not absolute price appreciation.
This is the single most misunderstood aspect of the tool.
An altcoin that gains 30% while BTC gains 50% counts as an underperformer. An altcoin that loses 8% while BTC loses 20% counts as an outperformer, even in a bleeding market.
Why does relative performance matter more? Because Bitcoin is the funding currency of crypto risk-taking.
If you can hold BTC and beat 80% of altcoins, there is no incentive to take on the extra volatility, thinner liquidity, and project-specific risk that altcoins carry.
Rotation only happens when the risk premium starts paying.
The index detects exactly that moment.
The Messy Middle Zone
Readings between roughly 25 and 75 are the least actionable data in crypto. That band represents a transitional or mixed regime where leadership is unclear and capital is not committing in either direction.
Most traders spend most of their time in this zone. It is boring, and boredom drives bad decisions.
The correct posture in the middle zone is “wait and confirm,” not “position early for the rotation.” An index at 55 that is rising over four consecutive weeks is meaningfully different from an index at 55 that is falling from 71, yet both print the same number.
Direction and slope matter as much as level.
Track the index over time rather than reading it as a snapshot.
Broad Season or Narrow Rally?
An index reading cannot tell you whether the strength is distributed or concentrated.
And that distinction determines whether your watchlist works or fails.
Modern crypto cycles produce narrative clusters. A batch of 15 to 20 large-cap AI tokens, Layer 2s, or memecoins can rip 150% while the other 80 coins in the sample chop sideways. If those 20 winners happen to sit alongside 40 coins that merely edged out a flat Bitcoin by two percentage points, the index can print in the high 60s without any real altcoin market capitalization expansion.
Concrete example.
The index reads 68.
Looks close to confirmation, tempting to front-run.
But trading volume on mid-caps has been declining for three weeks, TOTAL3 is flat, and the top ten performers all belong to one narrative.
That is a narrow rally wearing an altcoin season costume.
The fix is checking breadth quality, not just breadth count. Look at the distribution of outperformance, not the headline tally.
Building a Real Confirmation Workflow
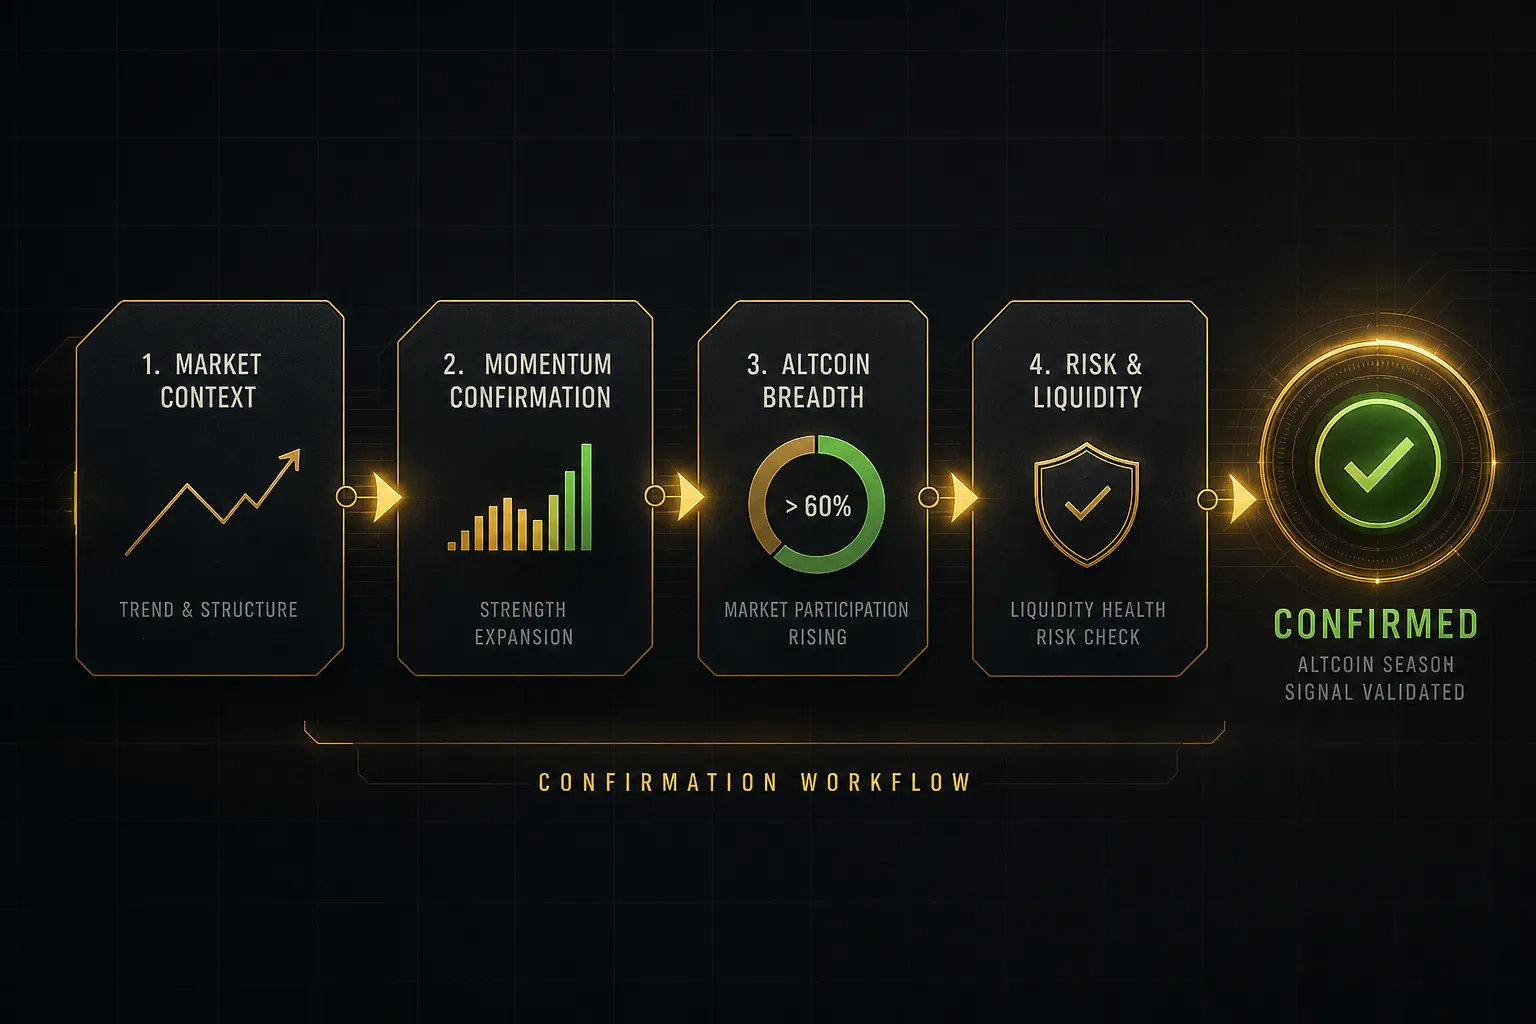
One indicator is a hypothesis.
Four agreeing indicators are a thesis.
The workflow below turns the altcoin season index from a headline number into an actual decision framework. Each layer tests a different assumption, and the whole point is that they can disagree with each other.
Bitcoin Dominance and the Stablecoin Trap
Bitcoin dominance, charted as BTC.D, measures Bitcoin’s market cap as a percentage of total crypto market cap. Falling BTC.D is the classic altcoin season signal, and it is frequently wrong.
Here is the trap.
BTC.D is a ratio, and ratios fall when the denominator grows, regardless of what altcoins are doing.
When several billion dollars of new stablecoins are minted, total crypto market cap rises.
Bitcoin’s share falls mechanically.
No altcoin bought, no rotation happened, yet the dominance chart just broke down through support.
This is stablecoin dilution, and it produces some of the most convincing false signals in crypto.
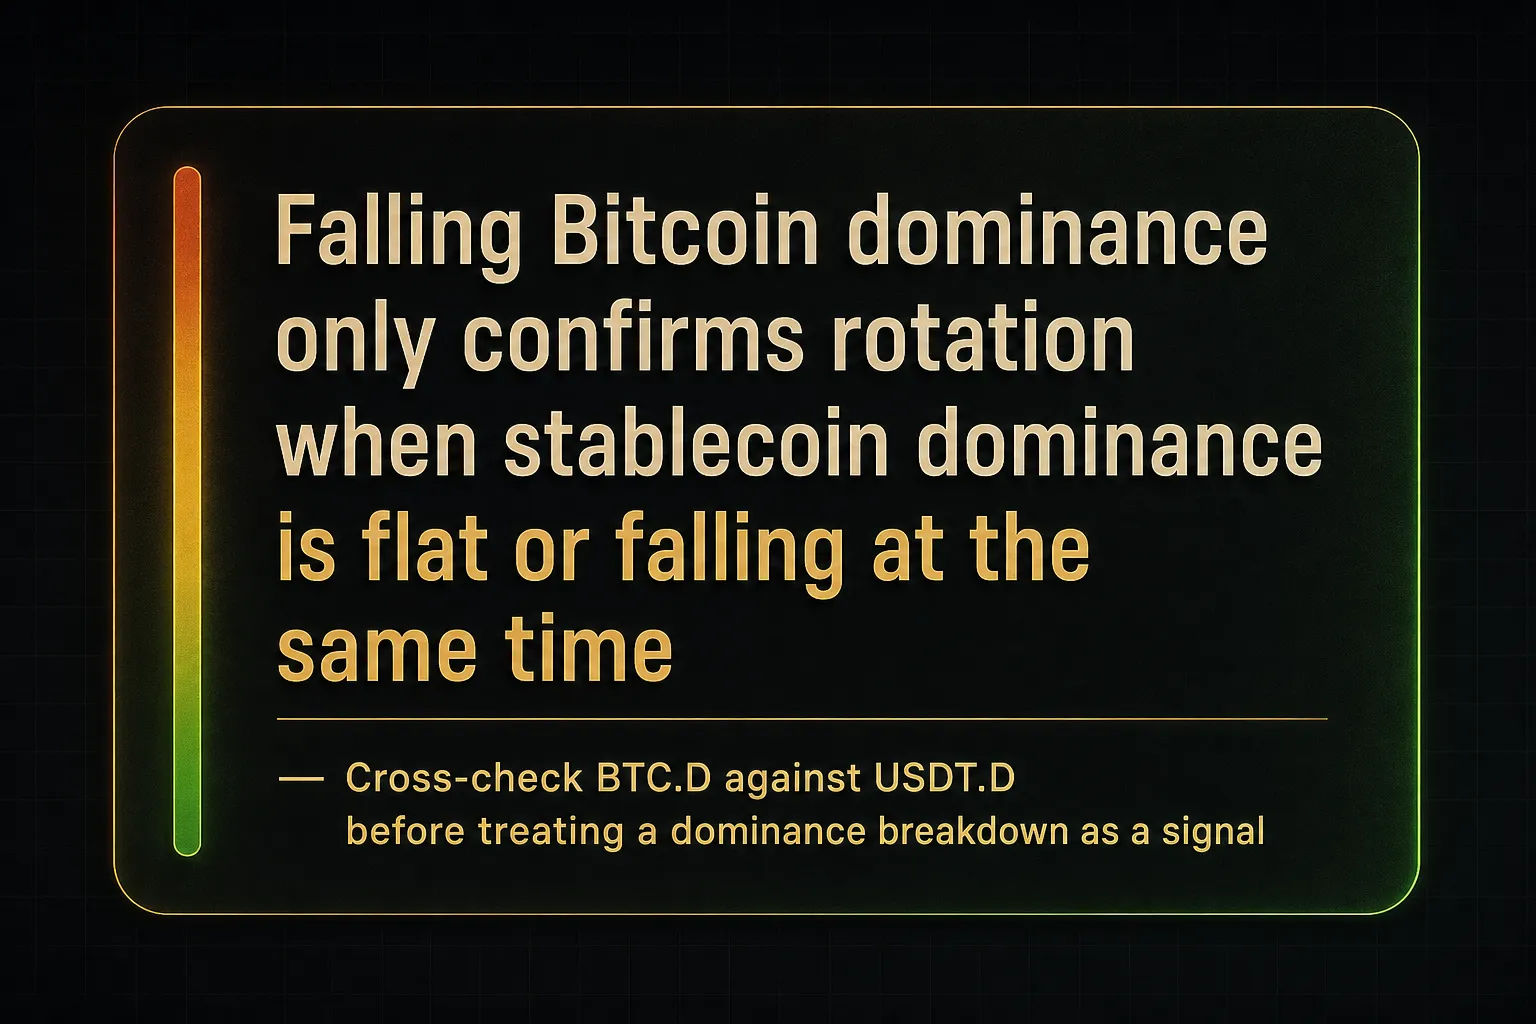
The check takes thirty seconds. Pull up stablecoin dominance (USDT.D plus USDC.D, or a combined stablecoin supply chart) alongside BTC.D. If stablecoin dominance is rising at roughly the same rate BTC.D is falling, the move is dilution and not rotation.
Genuine rotation looks different.
BTC.D falls, stablecoin dominance falls or stays flat, and altcoin market cap rises. Money is leaving both Bitcoin and the sidelines, moving into risk.
ETH/BTC and TOTAL2/TOTAL3
The ETH/BTC ratio is the cleanest single-pair proxy for risk appetite in crypto. Ethereum is the largest non-Bitcoin asset and the gateway through which most capital flows into smaller tokens.
Sustained altcoin seasons almost never happen while ETH/BTC is in a downtrend. If Ethereum cannot beat Bitcoin, the coins further down the risk curve are usually running on narrative fumes.
Look for ETH/BTC reclaiming a prior swing high, holding above a rising moving average, or breaking a multi-month downtrend line. Any of those adds real weight to a 75+ index reading.
Then move to the market-cap charts.
TOTAL2 is total crypto market cap excluding Bitcoin. TOTAL3 excludes both Bitcoin and Ethereum, isolating the rest of the market.
The TOTAL2 chart confirms whether altcoins as a group are actually growing in dollar terms rather than just outperforming a declining Bitcoin. The TOTAL3 chart is your breadth-quality filter, because if TOTAL2 is making higher highs while TOTAL3 is flat, the strength is concentrated in Ethereum alone.
Genuine broad season: both TOTAL2 and TOTAL3 making higher highs and higher lows on the daily chart, with expanding volume.
Confirming Structure Across Timeframes
A regime shift should be visible on more than one timeframe. If the daily chart says rotation and the weekly chart says nothing changed, you are probably looking at a countertrend bounce.
Here is the repeatable checklist. Run it before treating any index reading as actionable:
- Index above 75. Confirmed on your chosen source, ideally rising rather than rolling over from a higher level.
- BTC.D breaking defined support. A level you marked in advance, not one you drew after the fact.
- Stablecoin dominance flat or falling. Rules out the dilution trap.
- ETH/BTC in an established uptrend. Higher lows on the daily, ideally with weekly agreement.
- TOTAL2 making higher highs. With TOTAL3 participating, not lagging badly.
- Volume expanding on the move. Rising prices on declining volume is distribution, not accumulation.
Checking higher-timeframe market structure manually across six charts and multiple timeframes is where most traders cut corners. A multi-timeframe trend table solves this efficiently.
Tools like PipTrend’s 12-timeframe indicator on TradingView display trend direction across every timeframe from minutes to monthly in a single table, so you can load BTC.D, ETH/BTC, TOTAL2, and your candidate altcoins and see at a glance whether daily and weekly structure agree. When the higher timeframes align with the index reading, you have trend confirmation. When the weekly is still bearish while the 4-hour turns up, you have a bounce.
That distinction is worth more than any single number on any dashboard.
Trading and Risk Management Once Confirmed
Confirmation is not permission to go all in.
Altcoin seasons historically compress a cycle’s worth of gains into weeks, then give a large share of it back with brutal speed.
The following covers how to build exposure, when to reduce it, and what the index structurally cannot warn you about.
Spotting Late-Stage Exhaustion
The end of a rotation rarely announces itself with a crash. It announces itself with narrowing participation while prices still look fine.
- Breadth narrows while the index stays high. The number of coins beating BTC drops from 80 to 60 over a few weeks, but headline prices hold. Fewer horses pulling the same cart is the classic momentum exhaustion pattern.
- Momentum divergence on higher timeframes. TOTAL2 prints a higher high while weekly RSI or MACD prints a lower high. Divergence on the weekly carries far more weight than the same pattern on a 15-minute chart.
- Volume rotates back into Bitcoin. BTC.D stops falling and starts curling upward while altcoin volume dries up. Capital is retreating to the safest asset in the space, which is usually the first move before broader de-risking.
- ETH/BTC loses its trend. Ethereum breaking below a rising trendline or a prior swing low often leads the rest of the altcoin market by days to weeks.
- Extreme index readings with parabolic price action. Readings above 90 have historically clustered near local tops rather than at the start of new legs. High breadth plus vertical charts equals late stage.
- Retail narrative saturation. When mainstream financial media runs altcoin season explainers, the informed money has usually been positioned for weeks.
Sizing and Exposure Limits
Position construction during a confirmed season is a risk management problem first and a stock-picking problem second. These rules matter more than which token you choose.
- Filter candidates by relative strength, not raw gains. Screen for coins outperforming both BTC and ETH over 30 and 90 days. A token up 200% that is underperforming ETH is a laggard wearing a winner’s costume.
- Rank by consistency of outperformance. A coin that has beaten BTC in each of the last three months is a stronger candidate than one that gapped 180% in a single week and has drifted since.
- Tie invalidation to structure, not to percentages. Place stops below the swing low that would break the uptrend, not at an arbitrary 10%. If that structural level requires a stop wider than your risk tolerance, the correct response is a smaller position, not a tighter stop.
- Scale down as the index approaches extremes. Full size when the index confirms in the high 70s and structure agrees. Half size above 85. Trimming rather than adding above 90.
- Cap total altcoin exposure. Altcoin correlations converge toward 1.0 during drawdowns, so eight positions in one narrative is a single trade with extra fees. Define a maximum percentage of the portfolio in non-BTC assets before you start.
- Account for what the index cannot see. The score knows nothing about token unlocks hitting the market next Tuesday, thin order-book depth that turns a 5% exit into a 15% slippage event, smart-contract exploit risk, or exchange-specific counterparty risk. Check unlock schedules and real order-book depth before sizing anything above a starter position.
- Pre-plan your exits. Decide in advance which conditions trigger reduction: index falling below 60, ETH/BTC breaking its trendline, or your structural stop hitting. Making that decision mid-drawdown rarely goes well.
Frequently Asked Questions
What number is considered altcoin season?
An altcoin season index reading of 75 or above is the standard confirmation threshold. It means at least 75 of the eligible top-ranked coins outperformed Bitcoin over the trailing 90-day window.
Readings of 25 or below define Bitcoin season. Anything between 25 and 75 is a mixed or transitional regime with no clear leadership, which is where the market spends most of its time.
Is altcoin season based on Bitcoin dominance?
No, the index is calculated from relative price performance, not from dominance. It counts how many altcoins beat Bitcoin’s 90-day return, while BTC.D measures Bitcoin’s share of total crypto market cap.
The two usually move in opposite directions, which is why they get conflated.
But dominance can fall purely because stablecoin supply is expanding, with no altcoin buying involved at all.
Always check stablecoin dominance alongside BTC.D before treating a dominance breakdown as rotation.
How long does altcoin season usually last?
Historically, confirmed altcoin seasons have lasted from a few weeks to roughly three or four months. The 2017 and 2021 episodes both compressed most of their gains into windows of eight to twelve weeks before breadth collapsed.
Duration varies enormously by cycle and there is no reliable average worth trading against. Assume the window is shorter than you expect and manage exposure accordingly.
How do you know when altcoin season is starting?
The earliest reliable tell is ETH/BTC turning up while Bitcoin consolidates after a strong run. That sequence, BTC rallies, BTC ranges, capital rotates into ETH, then into large-cap alts, then into mid and small caps, has repeated across multiple cycles.
Confirmation comes when the index crosses 75, TOTAL2 makes higher highs, and stablecoin dominance is falling. The index itself is lagging by design, so it confirms a start rather than predicting one.
Should I buy altcoins when Bitcoin dominance falls?
Not on that signal alone.
Falling BTC.D has at least three causes: real altcoin inflows, stablecoin supply expansion diluting the ratio, or Bitcoin simply selling off harder than everything else.
Only the first is bullish for altcoins.
Confirm with rising TOTAL2, an ETH/BTC uptrend, expanding volume, and flat or falling stablecoin dominance before acting.
What is the best indicator for altcoin season?
There is no single best indicator, and any source claiming otherwise is overselling. The realistic answer is a combination: the altcoin season index for breadth, BTC.D for capital share, ETH/BTC for risk appetite, TOTAL2 and TOTAL3 for absolute altcoin market capitalization, and volume for conviction.
Signals confirm each other or they contradict each other, and the contradictions are the useful part. Worth adding: seasonality patterns tied to halving cycles are observational, drawn from a handful of historical samples, and carry no predictive guarantee.
The Bottom Line on Rotation Signals
The decision rule is straightforward.
If the index reads above 75 and Bitcoin dominance, ETH/BTC, and TOTAL2 structure all agree, treat it as confirmed capital rotation and size accordingly.
If any two of those disagree, you are in a mixed regime. Reduce size, tighten your candidate list, and wait for alignment rather than forcing a thesis onto conflicting data.
Remember what this tool actually is.
The altcoin season indicator is backward-looking and descriptive, built on a 90-day rolling return that has already happened.
It explains the regime you are currently in.
It does not forecast the next one.
That is not a weakness, provided you use it correctly. Descriptive tools keep you honest about the present, which is more than most technical trading indicators manage.
The practical next step takes about five minutes. Before you open any new altcoin position this week, pull up the index alongside BTC.D, stablecoin dominance, ETH/BTC, and TOTAL2, and check whether daily and weekly structure agree.
If they do, you have a thesis. If they don’t, you have a warning… and that is worth just as much.
Risk Disclaimer: Trading involves risk. Past performance doesn't guarantee future results. Only trade with money you can afford to lose. PipTrend is a tool to assist your trading decisions, not financial advice.