What the OBV Indicator Really Tells Traders
On this page
Why Volume Confirms What Price Can’t
A candle closes green. Price is up 1.2%. Does that mean buyers are in control?
Not necessarily. Price tells you where a market ended up, but it says nothing about how much conviction it took to get there. A 1.2% move on thin, disinterested volume and a 1.2% move on the heaviest participation in three weeks look identical on a bare price chart.
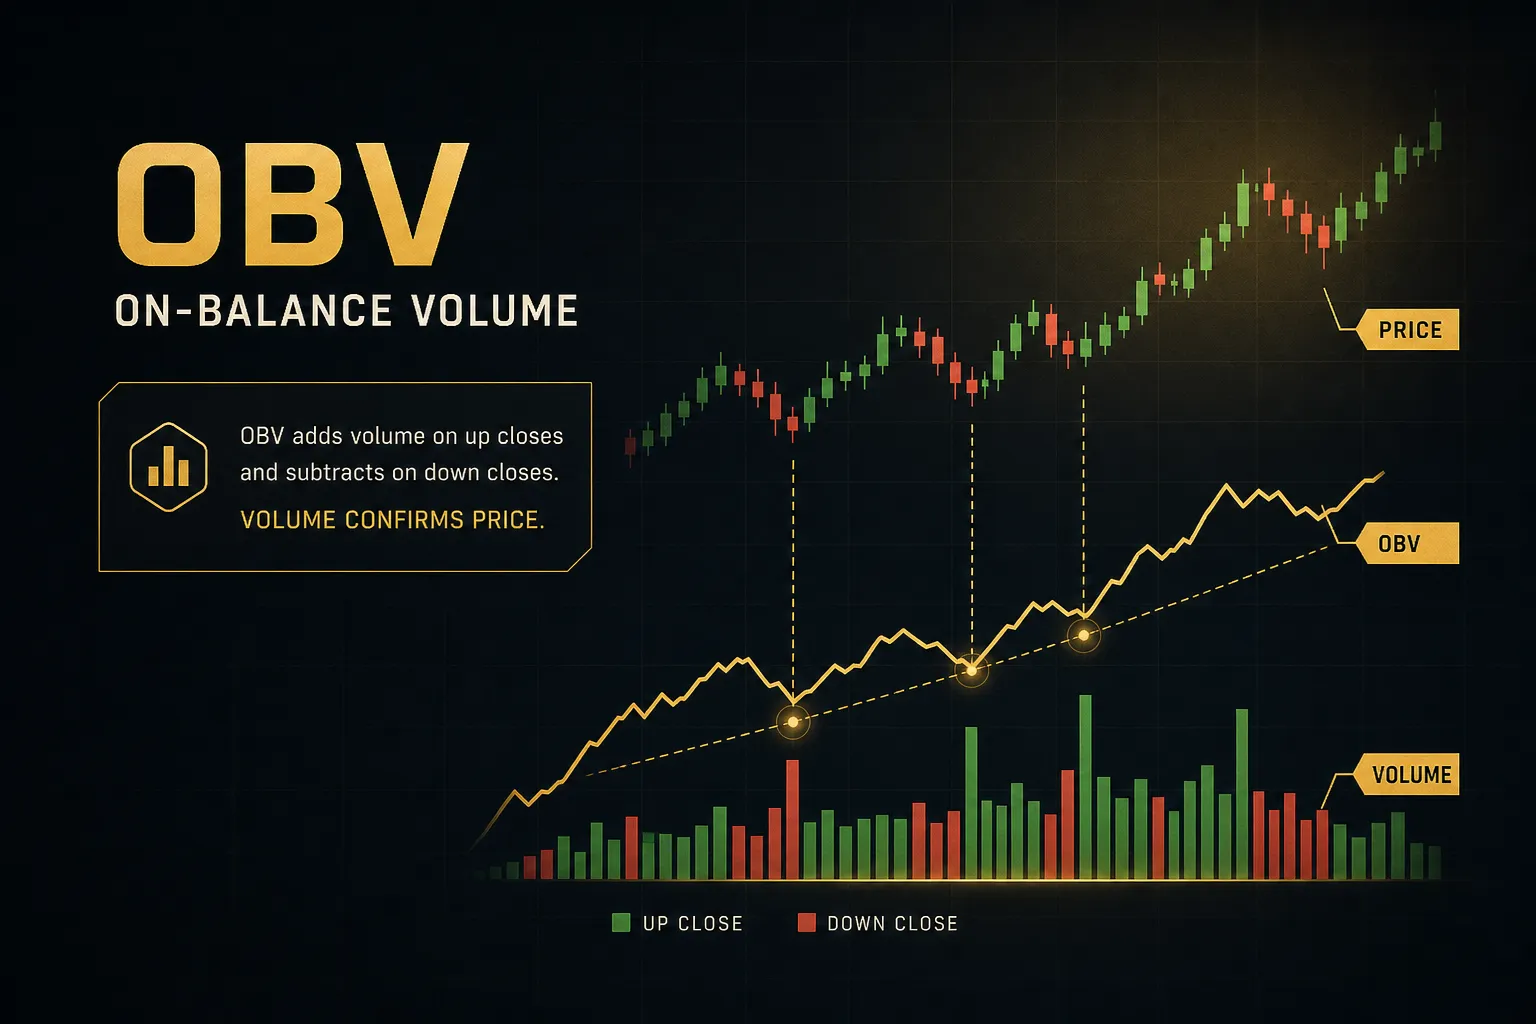
That gap is exactly what the OBV indicator was built to close. On-Balance Volume is a cumulative volume line created by Joseph Granville in 1963, and its logic is disarmingly simple: add the day’s volume when price closes higher, subtract it when price closes lower.
The result is a running tally of whether volume has been flowing into up-closes or down-closes.
Traders use it on stocks, futures, forex, and crypto, though as you’ll see, it behaves very differently in markets with real exchange volume versus markets where volume is only an estimate.
Here’s the angle most guides miss. OBV is not a signal generator.
It’s a second opinion.
OBV never tells you to buy. It tells you whether the buying you’re already looking at is backed by real participation, or whether it’s running on fumes.
The most common piece of bad advice you’ll read about On-Balance Volume goes something like this: “When price makes a higher high but OBV makes a lower high, that’s a bearish divergence, so short it.” That framing turns a warning into a trigger, and it’s why so many traders get chopped up fading strong trends.
Price-volume divergence flags a possible loss of momentum. It does not tell you the direction has changed, and it certainly doesn’t tell you where to enter, where to stop out, or how much to risk.
This guide covers what OBV actually measures, how to read it against market structure, where it breaks down (forex tick volume is a big one), and how to fit it into a repeatable process instead of treating it as an oracle.
How On-Balance Volume Works
Most indicators involve some averaging, weighting, or normalization. OBV involves none of that. It’s arithmetic a ten-year-old could do, which is both its strength and its blind spot.
The Running Total Behind the Line
The calculation has three cases, applied bar by bar:
If today’s close is higher than yesterday’s close, add the entire bar’s volume to the running total. If today’s close is lower, subtract the entire bar’s volume. If the closes are equal, the total stays unchanged.
That’s it. There’s no period setting, no smoothing, no lookback window.
OBV is a pure accumulator.
Notice what gets thrown away. A stock could gap up 4%, sell off all session, and close a single cent above the previous close, and OBV would credit 100% of that volume to the buyers. A bar that closes a penny lower gets 100% assigned to sellers.
The classification is binary, and it ignores everything that happened inside the bar: the range, the wicks, where the close sat relative to the high and low.
This bluntness is deliberate. Granville’s thesis was that smart money accumulates quietly before price moves, and that cumulative volume would reveal that footprint before it showed up in price. The all-or-nothing assignment is a filter, not a bug, but it does mean OBV can misread choppy sessions where the close barely budged.
Compare this to Accumulation/Distribution, which weights volume by where the close sits within the bar’s range. Neither approach is objectively better. They answer slightly different questions about buying pressure and selling pressure.
Why the Number Itself Doesn’t Matter
Open two charts of the same stock on two different platforms and you’ll often see two completely different OBV values. One reads 14.2 million, the other reads negative 3.8 million. Same stock, same day.
Neither is wrong. OBV starts from an arbitrary zero at the first bar in your loaded chart history. Load 500 bars and the line starts accumulating from bar one. Load 5,000 bars and it starts 4,500 bars earlier, producing a totally different absolute level today.
The absolute value of OBV is meaningless. Only the shape matters: the slope, the direction, and where it makes highs and lows relative to price.
Three things shift the level without changing the shape: your chart’s starting point, the length of history your platform loads, and your data provider’s volume figures. Two brokers reporting different volume for the same forex pair will produce two different OBV lines, and in the case of tick volume, the difference can be material.
So never use OBV as a threshold indicator. “OBV crossed above zero” is not a signal, because zero is an accident of where your chart began.
What you’re reading is the trajectory of participation over time, not a level to be crossed.
Reading the OBV Line
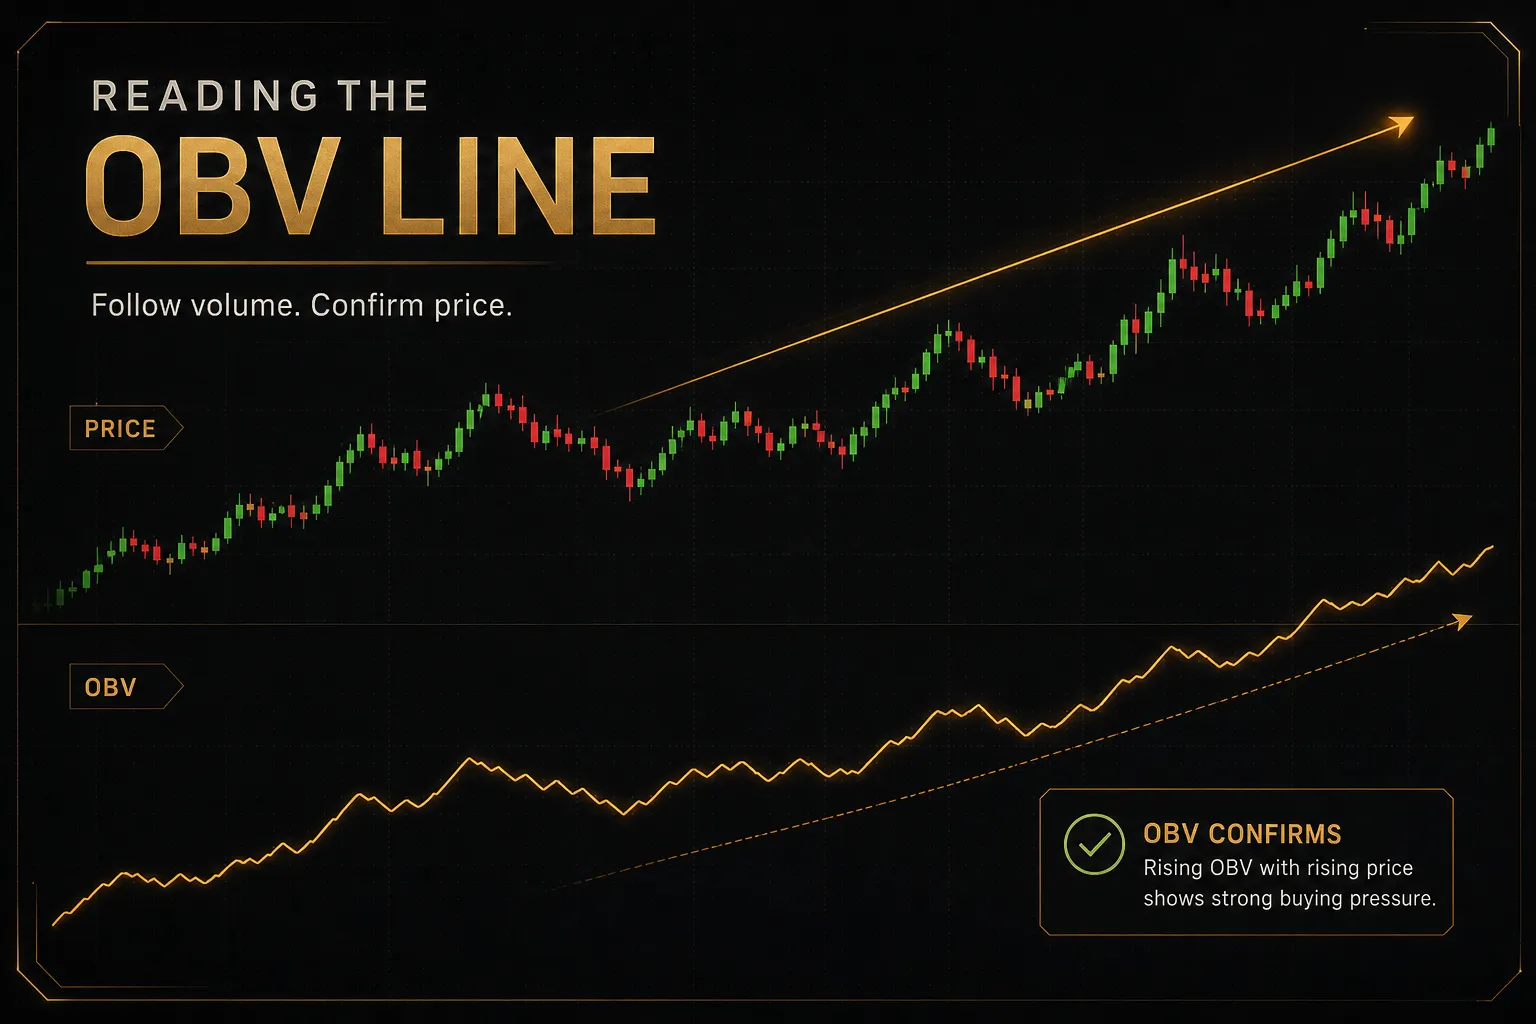
The practical work with OBV comes down to one question, asked over and over: does volume agree with what price is doing?
Trend Confirmation vs Weakening Momentum
In a healthy uptrend, price makes higher highs and higher lows, and OBV does the same. That’s trend confirmation. Each new price high is being paid for with fresh volume, which means new buyers are stepping in rather than the same participants passing shares back and forth.
The warning sign is subtler than most traders expect. It isn’t OBV turning down. It’s OBV going flat.
When price grinds to new highs but the OBV line rolls sideways, participation has stalled. The move is being carried by a shrinking pool of buyers, and the market is more vulnerable to a shock, a failed breakout, or a sharp mean reversion. This flattening often precedes visible weakness by several bars.
The same logic runs in reverse. In a downtrend, price making lower lows while OBV makes lower lows confirms genuine selling pressure. If OBV flattens while price keeps sliding, sellers are getting exhausted even though the chart looks ugly.
This is also where OBV earns its keep on breakouts. A break above resistance with OBV surging alongside it is a far stronger breakout confirmation than a break where OBV barely twitches.
The second kind is where stop-hunts and false breaks live.
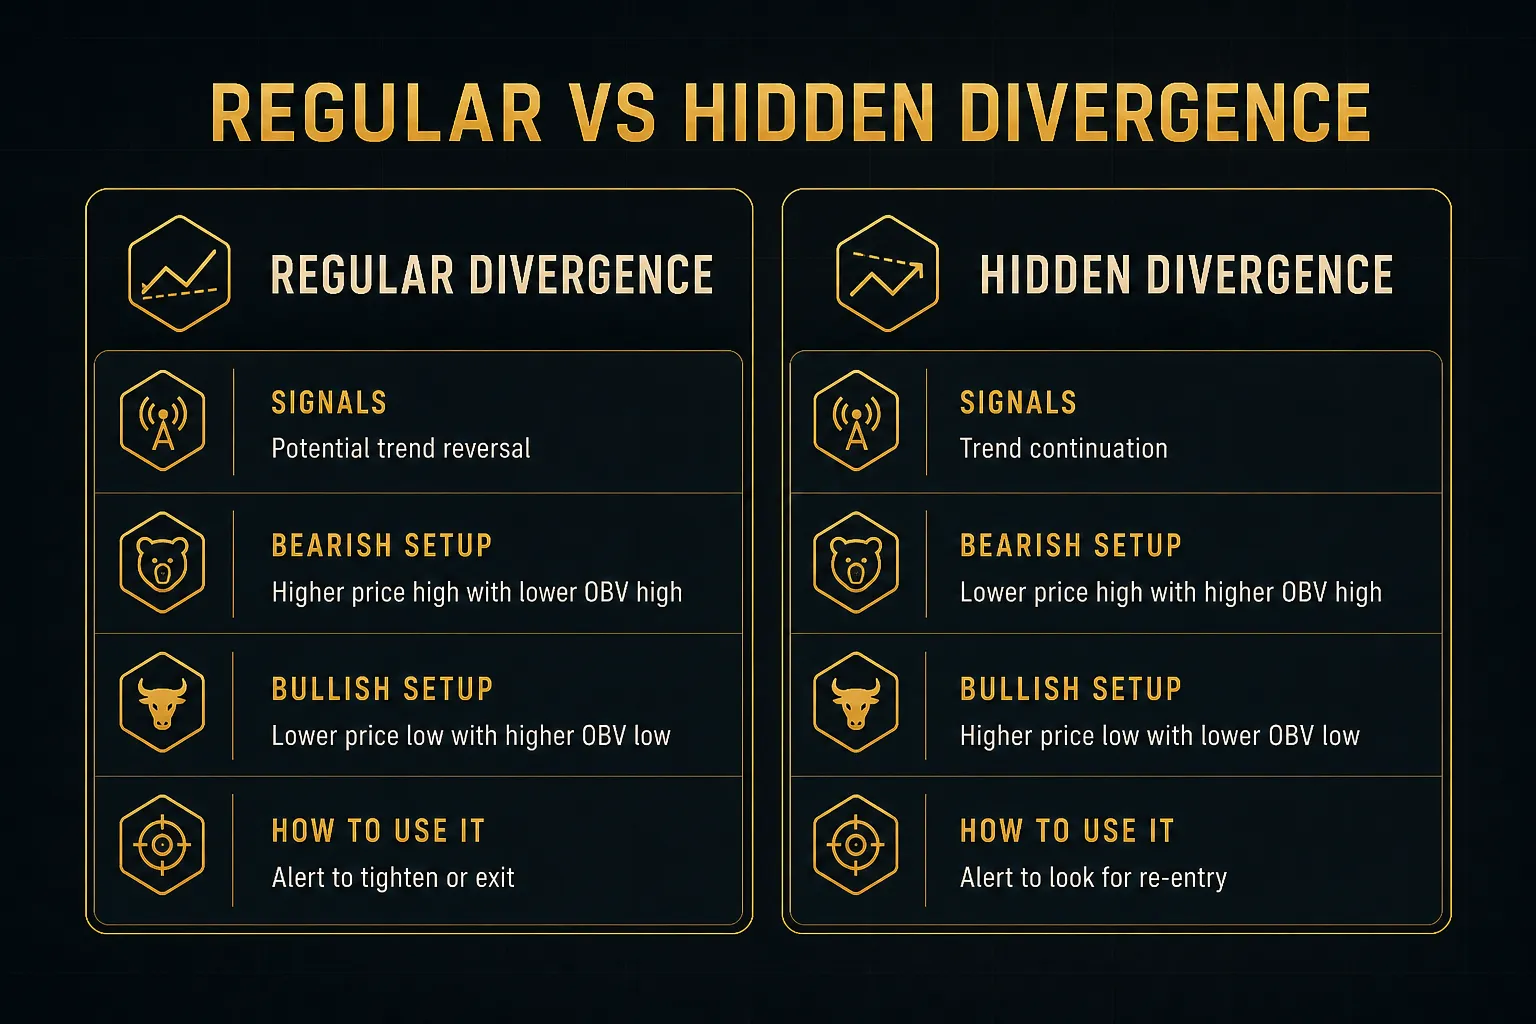
Regular Divergence vs Hidden Divergence
Divergence comes in two flavors, and conflating them is a common and expensive mistake.
Regular divergence signals a potential reversal. Bearish version: price prints a higher high, OBV prints a lower high. Example: a stock rallies from $48 to $52, pulls back, then pushes to $54. Price made a new high.
But OBV’s peak at $54 sits below its peak at $52, meaning the second leg attracted less volume than the first. Fewer buyers, higher price.
That’s a warning.
Hidden divergence signals continuation. Bullish version: price makes a higher low while OBV makes a lower low. The pullback shed volume rather than attracting it, which suggests it was profit-taking rather than genuine distribution. Example: EUR/USD in an uptrend pulls back to 1.0840, holding above the prior swing low at 1.0810, while OBV dips below its own prior trough.
Price held. Volume support dried up on the dip. The trend has a good chance of resuming.
Reading OBV Inside a Range
Ranges are where OBV is arguably at its most useful, and where almost nobody looks at it.
When price chops sideways between support and resistance, price itself gives you nothing. But if OBV climbs steadily through that consolidation, volume is quietly favoring the up-closes. That’s the classic accumulation and distribution read: accumulation inside a range often resolves upward.
Falling OBV during a flat range suggests the opposite. Supply is being absorbed by the market rather than the other way round, and the eventual break is more likely to be downward.
Now the caveat that saves accounts. Never label a divergence until the swing point is confirmed.
A “high” isn’t a high until price has turned away from it and left it behind. On a live, forming bar, the pivot you’re drawing your divergence line to might not exist in two hours. Traders who mark divergence on unconfirmed pivots are essentially reading tea leaves, then congratulating themselves when the chart later cooperates.
Wait for the swing to close out. The signal will still be there if it was real.
A Complete OBV Trade Workflow
OBV on its own answers exactly one question. A trade requires answers to about six. Here’s a sequence that puts the indicator where it belongs: in the middle, not at the front.
- Establish the market regime. Before anything else, decide whether the instrument is trending, ranging, or in a volatility expansion. OBV divergence in a strong trend means something very different than the same pattern inside a two-week range, and treating them identically is how traders end up fading trends that have plenty left in the tank.
- Map the price structure. Mark the last confirmed swing high, the last confirmed swing low, and the obvious support and resistance levels. This is your reference frame. Without marked structure you have nothing to measure OBV against, because divergence is defined by price pivots, not by the indicator alone.
- Check OBV for confirmation or divergence. Now, and only now, look at the volume line. Ask whether it’s making corresponding highs and lows with price, flattening while price extends, or diverging outright. Log what you see as a bias, not a decision.
- Wait for price confirmation. Divergence is an alert that conditions may be changing. It is not an entry. Price must do something observable first: break a trendline, reclaim or lose a level, print a lower high after a bearish divergence, or close beyond a range boundary on expanding volume.
- Define invalidation before entry. Decide the exact price at which your idea is wrong, and write it down. Usually that’s beyond the swing point that formed the divergence. If you can’t state the invalidation level in one sentence, you don’t have a trade, you have a hunch.
- Size the trade with separate risk rules. Position size comes from account risk percentage and stop distance, and stop distance should come from volatility (ATR, structure spacing) rather than from anything OBV shows. Your risk-reward ratio is measured against real levels on the chart, not against how convincing the divergence looked.
Read step six again, because it’s the one traders skip. OBV cannot determine position size, stop distance, or profit targets. It has no volatility component and no price scale. It’s a participation gauge, full stop.
Where a Confirmation System Like PipTrend Fits
The structural weakness in most retail trading isn’t a bad indicator. It’s that one indicator ends up doing three jobs it was never designed for: direction, timing, and risk.
A better approach separates those jobs. Direction comes from one layer of analysis, entry level comes from another, and confirmation across timeframes acts as a filter on both. PipTrend is built on that separation: the directional signal and the marked entry level are distinct outputs, with multi-timeframe checks sitting between them. The trader isn’t asked to trust a single line’s judgment about everything at once.
OBV fits naturally into that kind of framework as a volume confirmation layer. When a directional signal and a marked entry level line up, and OBV shows participation flowing the same way, you have three independent inputs agreeing rather than one input repeated three times. When OBV disagrees, that’s not a veto, it’s a reason to demand more price confirmation before committing risk.
OBV Across Markets, Tools, and Settings
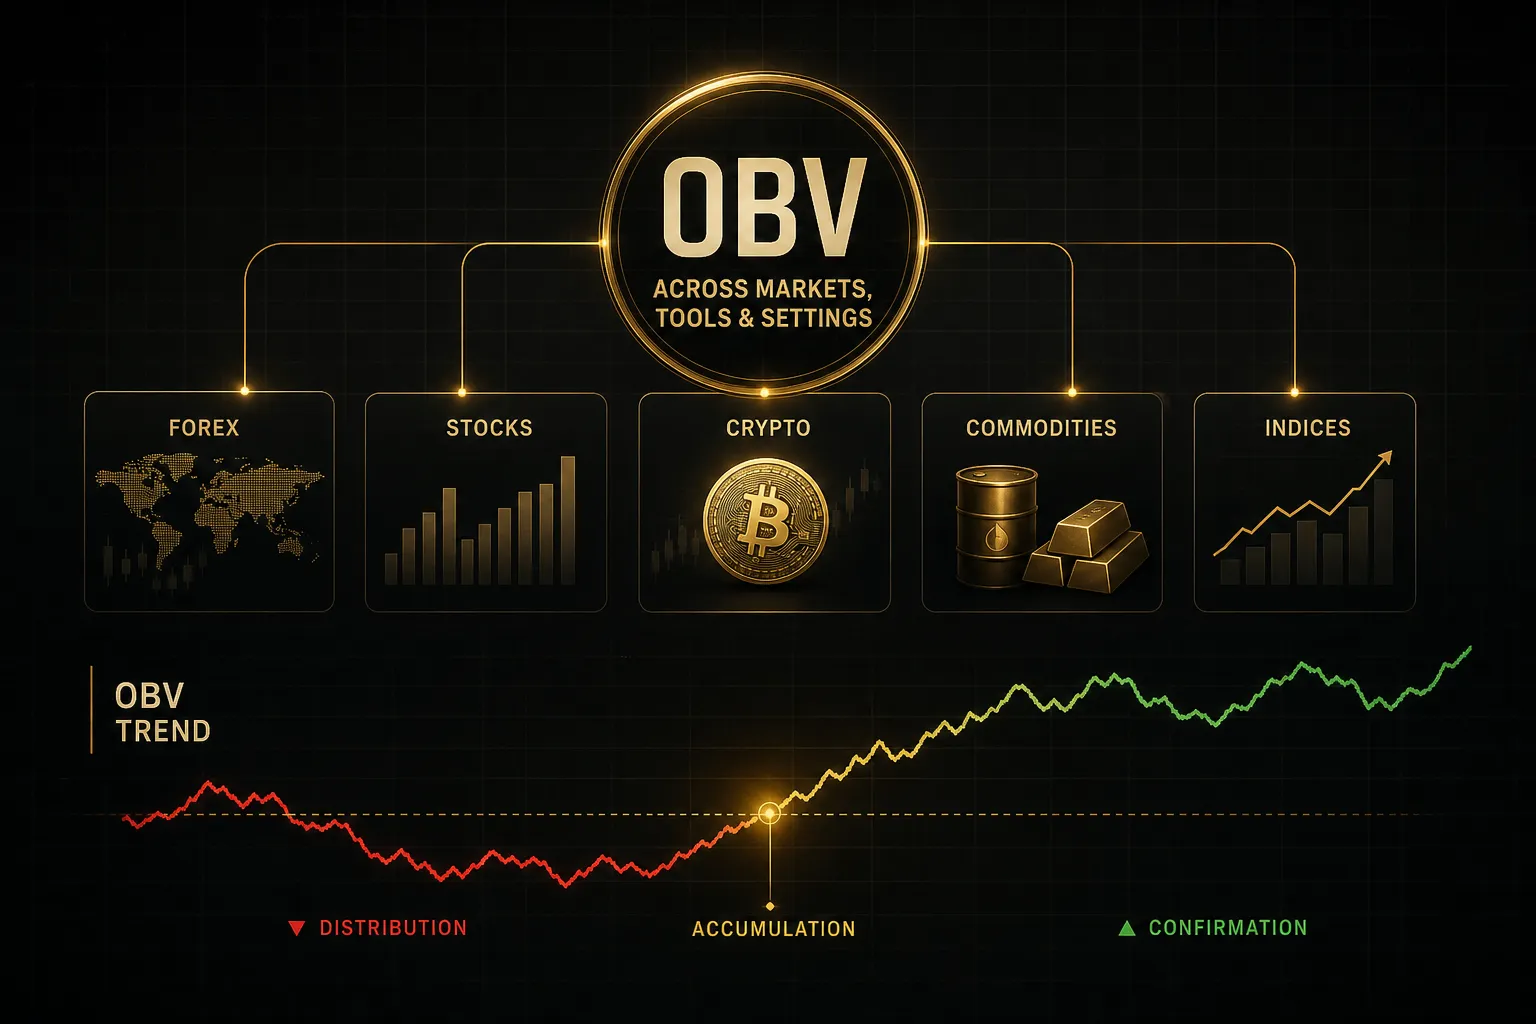
Here’s an uncomfortable fact: if you trade spot forex, the volume feeding your OBV line probably isn’t volume at all.
Forex Tick Volume vs Real Traded Volume
Spot forex is decentralized. There is no central exchange tallying contracts, so no broker can report true traded volume. What your platform shows as “volume” is tick volume: the number of price updates in a bar, not the number of units transacted.
Tick volume correlates reasonably well with real activity, and studies of retail feeds have generally found correlations in the 0.7 to 0.9 range against futures volume for major pairs. Reasonable. Not equivalent.
The practical consequence is that your OBV line depends on your broker’s liquidity providers and feed frequency. Two traders looking at the same pair on the same timeframe with different brokers can see divergences that appear on one chart and not the other. For a serious volume-based read on FX, many traders use CME currency futures volume as a proxy, since that’s genuine exchange volume.
Forex isn’t the only place OBV gets distorted. The list of things that quietly corrupt a cumulative volume line:
- Session boundaries. A daily bar that closes at the New York cutoff versus one that closes at 00:00 GMT will produce different close-to-close comparisons and therefore different OBV assignments.
- Thin overnight liquidity. Low-volume Asian-session bars still get their full volume assigned to a direction, giving noise the same structural weight as conviction.
- Price gaps. A weekend gap creates an up-close or down-close with no trading between the two prices, crediting or debiting volume for a move that never traded.
- Futures contract rollovers. Volume migrates from the expiring contract to the next one, creating artificial collapses and spikes unless you use a properly adjusted continuous contract.
- Stock corporate actions. Splits, dividends, and reverse splits change the price series, and unadjusted data can flip up-closes to down-closes across the event.
- Inconsistent data feeds. Consolidated tape versus single-venue volume for the same equity can differ by 30% or more, changing the OBV slope.
Which brings up the “best settings” question. There isn’t one, because raw OBV has no period parameter to optimize.
Anyone selling you the optimal OBV setting is selling you something else.
The choices that actually matter are: which timeframe you read it on, how much chart history you load, whether you overlay a volume moving average on the OBV line (a 20-period MA is common) to smooth the noise, and what price confirmation rules you attach. Those are worth backtesting. A magic number is not.
OBV Compared to Other Volume Tools
Volume indicators are often lumped together, but each one asks a genuinely different question. Choosing between them is about the question, not about which is “better.”
| Indicator | What It Measures | Bar Volume Treatment | Best Used For |
|---|---|---|---|
| On-Balance Volume (OBV) | Cumulative net volume based on close vs prior close | All-or-nothing: 100% assigned to one side | Long-run trend confirmation and divergence against swing points |
| Accumulation/Distribution (A/D) | Cumulative volume weighted by close position within the bar range | Proportional: split by close location high-to-low | Detecting accumulation when closes sit near highs despite flat price |
| Chaikin Money Flow (CMF) | A/D logic compressed into an oscillator, typically 20 periods | Proportional, then averaged over a fixed window | Short-term money-flow bias with a defined zero line |
| Volume-Price Trend (VPT) | Cumulative volume scaled by percentage price change | Weighted by size of the price move | Separating small drifts from large conviction moves |
| VWAP | Volume-weighted average traded price for a session | Price-based, not cumulative flow | Intraday fair value, institutional benchmarking, mean reversion |
| Volume Moving Average | Average raw volume over N bars | Undirected: no up or down assignment | Judging whether a single bar’s volume is unusual |
Notice the split. OBV and A/D answer “who has been winning over time?” CMF answers “who is winning right now?” VWAP answers “is price cheap or expensive relative to where volume traded?” A volume moving average answers “is this bar even worth paying attention to?”
Layering three tools that all answer the same question is duplication dressed up as confluence. Pairing OBV with a non-volume tool, relative strength index for momentum or MACD for trend phase, gives you genuinely independent information.
Common OBV Questions Answered
Is OBV a good indicator?
OBV is a good confirmation indicator and a poor standalone signal generator. Its strength is that it uses volume, a genuinely separate data stream from price, so it can tell you something a price-derived oscillator cannot. Its weakness is the crude all-or-nothing volume assignment, which makes it noisy on choppy bars and unreliable in markets without true traded volume. Used as one input among several, it earns its place on the chart.
What is the best way to use the OBV indicator?
The best use is comparing OBV’s slope and pivots against confirmed price swing points to validate or question a move you already identified. Mark structure first, then check whether OBV agrees. On breakouts, look for OBV expanding in the direction of the break; inside ranges, look for a steady OBV climb or decline that hints at accumulation or distribution before the resolution. Always require a price-based trigger before entering.
What does a falling OBV indicate?
A falling OBV means more volume is being transacted on down-closes than up-closes, indicating net selling pressure over the measured period. If price is also falling, that confirms the downtrend has real participation behind it. If price is rising while OBV falls, you have a bearish price-volume divergence, which is a warning about the rally’s quality, not a short signal on its own.
What is the difference between OBV and accumulation/distribution?
The difference is how each assigns a bar’s volume. OBV gives 100% of the volume to one side based purely on close versus prior close, while Accumulation/Distribution splits the volume proportionally based on where the close sits within the bar’s high-low range. A/D therefore reacts to intrabar strength that OBV ignores, but it also ignores the previous bar’s close entirely. They frequently disagree, and that disagreement itself can be informative.
Does OBV work better on higher time frames?
Yes, OBV is generally more reliable on daily and weekly charts than on intraday timeframes. Higher timeframes have fewer bars where the close barely moves, less session-boundary distortion, and more meaningful volume per bar, which reduces the noise in a cumulative line. Intraday OBV can still be useful, particularly for spotting volume surges on breakouts, but expect a higher rate of false divergences below the hourly chart.
How accurate is OBV divergence?
OBV divergence is better understood as a probability shift than an accuracy figure, and in strong trends it fails frequently. Divergences can persist for many bars while price continues in the original direction, which is why fading a trend on divergence alone is a losing habit. Treated as an alert that prompts you to wait for a break of market structure, its practical value rises considerably. Backtest it on your own instrument and timeframe rather than trusting a general claim.
Treat OBV as One Vote, Not a Verdict
The mindset shift is small but it changes everything. OBV confirms or questions a move that price has already made. It never confirms a trade by itself, because it has no opinion on entry price, stop distance, or position size.
Do this tonight. Pull up a chart you’re currently watching, on the daily timeframe. Mark the last confirmed swing high and the last confirmed swing low, the ones price has clearly left behind, not the ones still forming.
Then add OBV and ask a single question: does the volume line make matching highs and lows, or does it disagree?
That’s the whole exercise. Five minutes, no optimization, no settings to tune.
And the decision rule that follows is just as simple. If OBV and price structure agree, treat the trend as validated and look for entries in its direction. If they conflict, do nothing until price confirms the change with a broken level or a failed swing.
Volume gets a vote. It doesn’t get the verdict.
Sources
Risk Disclaimer: Trading involves risk. Past performance doesn't guarantee future results. Only trade with money you can afford to lose. PipTrend is a tool to assist your trading decisions, not financial advice.