What a Moving Average Crossover Actually Tells You
On this page
Why Every Trader Misreads This Signal
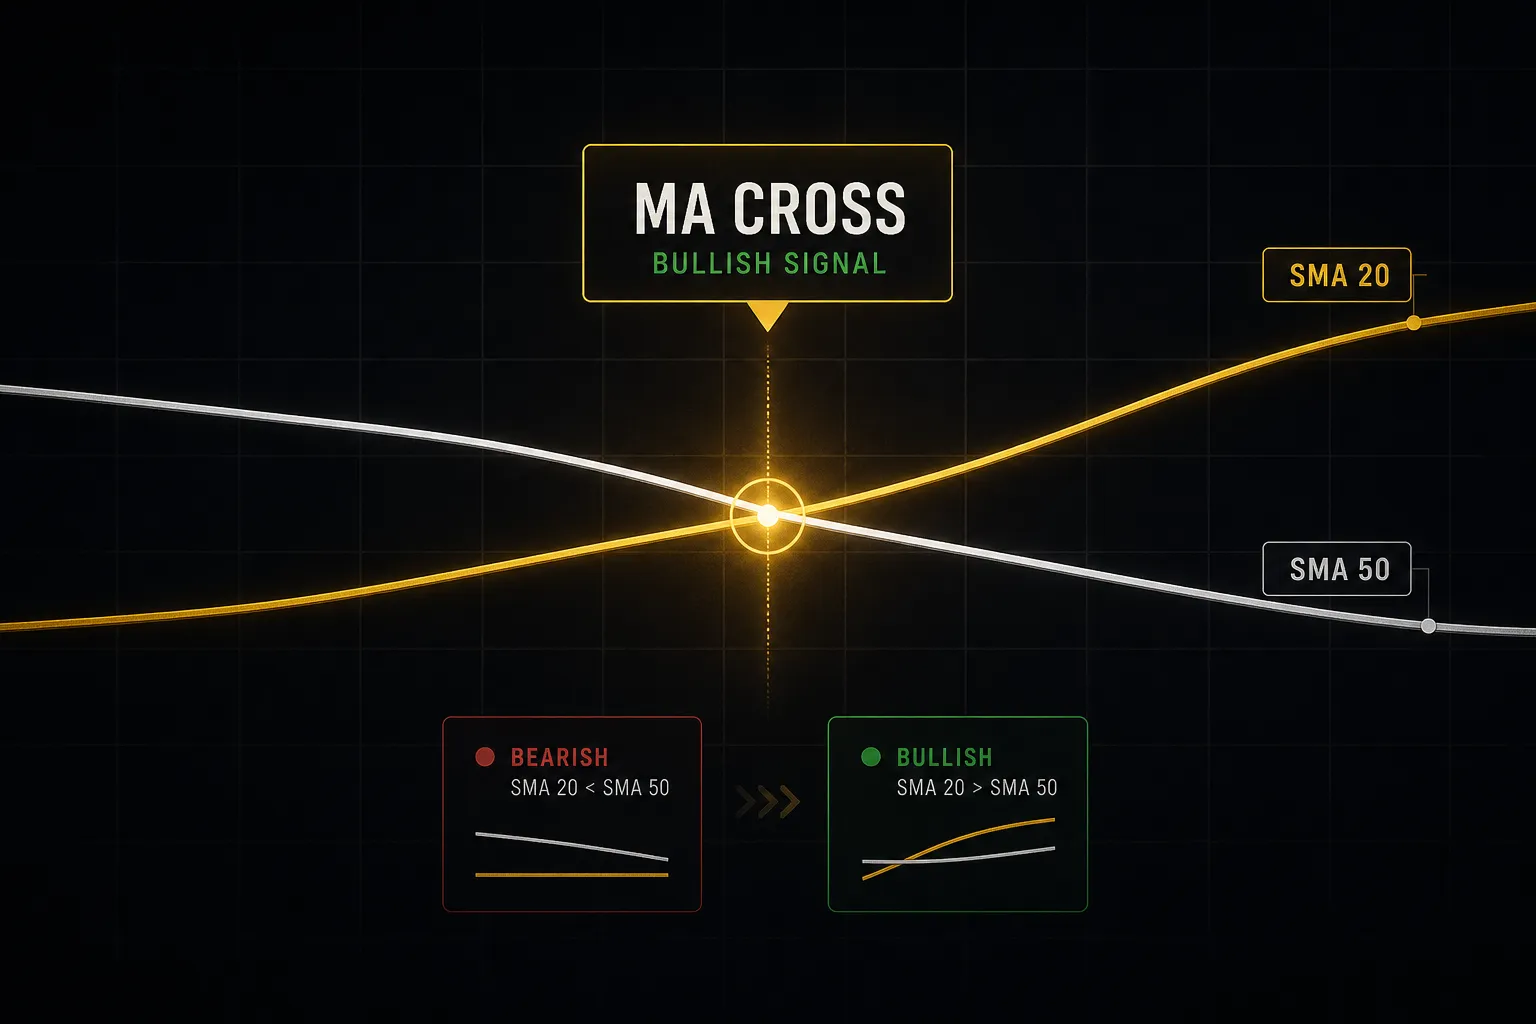
A moving average crossover happens when two averages with different lookback periods swap positions on the chart. The fast moving average (say, a 50-period) climbs above or drops below the slow moving average (say, a 200-period).
Two lines. One intersection.
That is not the same thing as price crossing a single moving average.
Price crossing one line is a faster, noisier event that can happen dozens of times in a week on a 5-minute chart. A crossover between two averages is slower, quieter, and carries different information entirely.
Here is the thesis this whole article rests on: a crossover is a trend-confirmation event assembled from lagging data, not a buy or sell trigger.
It tells you something has already changed. It does not tell you the change is about to pay you.
Financial media treats the golden cross and death cross like breaking news. Headlines fire, retail traders pile in, and by then a meaningful chunk of the move is history.
On the S&P 500, the 50-day crossing above the 200-day has frequently printed after the index has already recovered 15% to 25% off its low.
The signal is real. The timing is late.
So what do you actually do with it?
That is what the rest of this covers: how to judge whether a cross is high quality or garbage, when to require confirmation before entering, how to align timeframes so a small signal does not fight a big trend, and how to define risk before the trade rather than after it goes wrong.
What Happens When Averages Cross
Mechanically, nothing mystical is happening.
A 50-period average is the mean of the last 50 closes. A 200-period average is the mean of the last 200. When recent closes run hot enough for long enough, the 50 value climbs past the 200 value and the lines visually intersect.
The cross is arithmetic, not prophecy.
It happens because recent price action has strengthened (or weakened) relative to the longer baseline by enough to flip the order of two numbers.
A bullish cross means the shorter average has moved above the longer one. Recent momentum is now outrunning the established trend.
A bearish cross is the mirror image: recent closes have deteriorated enough to drag the fast average below the slow one.
What makes this useful is also what makes it frustrating.
Because both averages are built from past closes, the cross can only ever describe a shift that has already begun. That is the trade-off you accept with every trend-following indicator.
Golden Cross vs Death Cross Explained
The golden cross is the 50-day simple moving average crossing above the 200-day. The death cross is the same pair crossing the other way.
The names are dramatic; the mechanics are ordinary.
Both are delayed confirmations by design.
Consider the 2020 sequence on the S&P 500: the death cross printed in late March, within days of the actual bottom, and the golden cross did not appear until early July, well after the index had already recovered a substantial portion of the crash. Anyone treating those two signals as literal entry and exit commands sold near the low and bought back significantly higher.
The 2022 death cross told a different story, arriving in March and preceding many months of weakness.
That is the honest picture. Sometimes the lag costs you, sometimes the confirmation saves you from a full bear market. Neither outcome is predictable in advance from the cross alone.
The 50/200 pair is best understood as a long-term regime gauge. It answers “which side of the market am I on” far better than it answers “where do I enter.”
Treat it as a filter on your directional bias. Above the golden cross, favour long setups. Below a death cross, be far more skeptical of bullish entries.
The cross frames the trade; it does not place it.
SMA or EMA for Crossovers?
The simple moving average weights every close in the lookback window equally. The exponential moving average weights recent closes more heavily, so it turns faster.
That single difference cascades into everything.
An EMA crossover fires earlier, which is exactly what you want in a clean trending market and exactly what destroys you in a sideways market. Faster response means more crosses, and more crosses in chop means more whipsaw.
The SMA smooths harder.
It confirms trend changes later, ignores single-bar spikes, and produces fewer signals overall. Fewer signals with a higher hit rate, at the cost of later entries.
Practical guidance: use EMAs on lower timeframes and in fast-moving instruments where a few bars of lag matters. Use SMAs for higher-timeframe regime reads, where you actively want the noise filtered out.
And do not switch between them mid-strategy because one looked better on a particular chart last week.
Judging a Crossover’s Quality
Two crossovers can look identical in a headline and behave nothing alike on the chart.
One rips 400 points. The other reverses in three bars and stops you out.
The difference is almost always visible before you enter, if you know what to measure. Three things carry most of the weight: the slope of both averages, the separation between them after the cross, and where price sits relative to recent structure.
| Characteristic | Strong Crossover | Weak Crossover | What It Signals |
|---|---|---|---|
| Slope of both averages | Both angled clearly in the cross direction; fast average steeper than slow | Both near-horizontal; fast average curling back within 2-3 bars | Steep slope means directional conviction; flat slope means the cross is a mathematical accident of a range |
| Separation after the cross | Gap widens for 5+ bars, typically exceeding 0.5x average true range | Averages stay glued together or re-touch within a few bars | Widening separation confirms momentum; narrow separation predicts a reverse cross |
| Price location | Price breaking above the prior swing high (bullish) with room to the next resistance | Price crossing directly into overhead resistance or a prior supply zone | Location determines your risk-reward ratio before you place a single order |
| Market structure | Established series of higher highs and higher lows already in place | Cross appears after weeks of horizontal drift with no clear swing pattern | Structure tells you whether the cross confirms a trend or invents one |
| Volume behaviour | Expanding volume on the impulse leg that caused the cross | Flat or declining volume through the crossover bar | Volume confirmation separates participation from drift |
| Recent cross history | First cross after 30+ bars of one-directional separation | Third or fourth cross in the last 20 bars | Repeated crosses in a short window are the signature of a range |
Slope, Separation, and Price Location
Moving average slope is the single fastest quality read available.
Look at the fast average five bars after the cross. If it is climbing at a visible angle and the slow average has started to turn in the same direction, momentum is real.
If both lines are running nearly flat and hugging each other, the cross was produced by tiny fluctuations around a mean.
That is not a trend.
That is arithmetic noise wearing a trend costume.
Separation works as a confirmation clock.
Measure the gap between the two averages in average true range units rather than raw points, so the reading travels between instruments. A gap that expands past roughly half an ATR and keeps widening is behaving like a trend. A gap that stalls under a quarter ATR is telling you the reverse cross is coming.
Price location decides whether the trade is even worth taking. A bullish cross with price already extended 3 ATR above the slow average offers you a terrible entry, because your logical stop sits far below and your first realistic target is close.
Same signal, worse geometry.
Reading Market Structure First
Structure comes before the indicator.
Always.
Before you interpret a single cross, mark the last three or four swing highs and swing lows on the chart.
If those swings are stepping upward, a bullish cross is confirming what price action already established. The cross adds evidence to an existing case.
That is the highest-probability version of the signal.
If the swings are flat, overlapping, and bounded by clear support and resistance levels, the cross is happening inside a range. In that market regime, crossovers generate the worst results of any environment, because ranges mean-revert and crossovers are built to chase.
The uncomfortable conclusion: roughly the same signal that produces your best trades in a trending market produces your worst in a range.
Identifying the regime is not a preliminary step. It is the step.
Trading the Cross: Entry to Exit
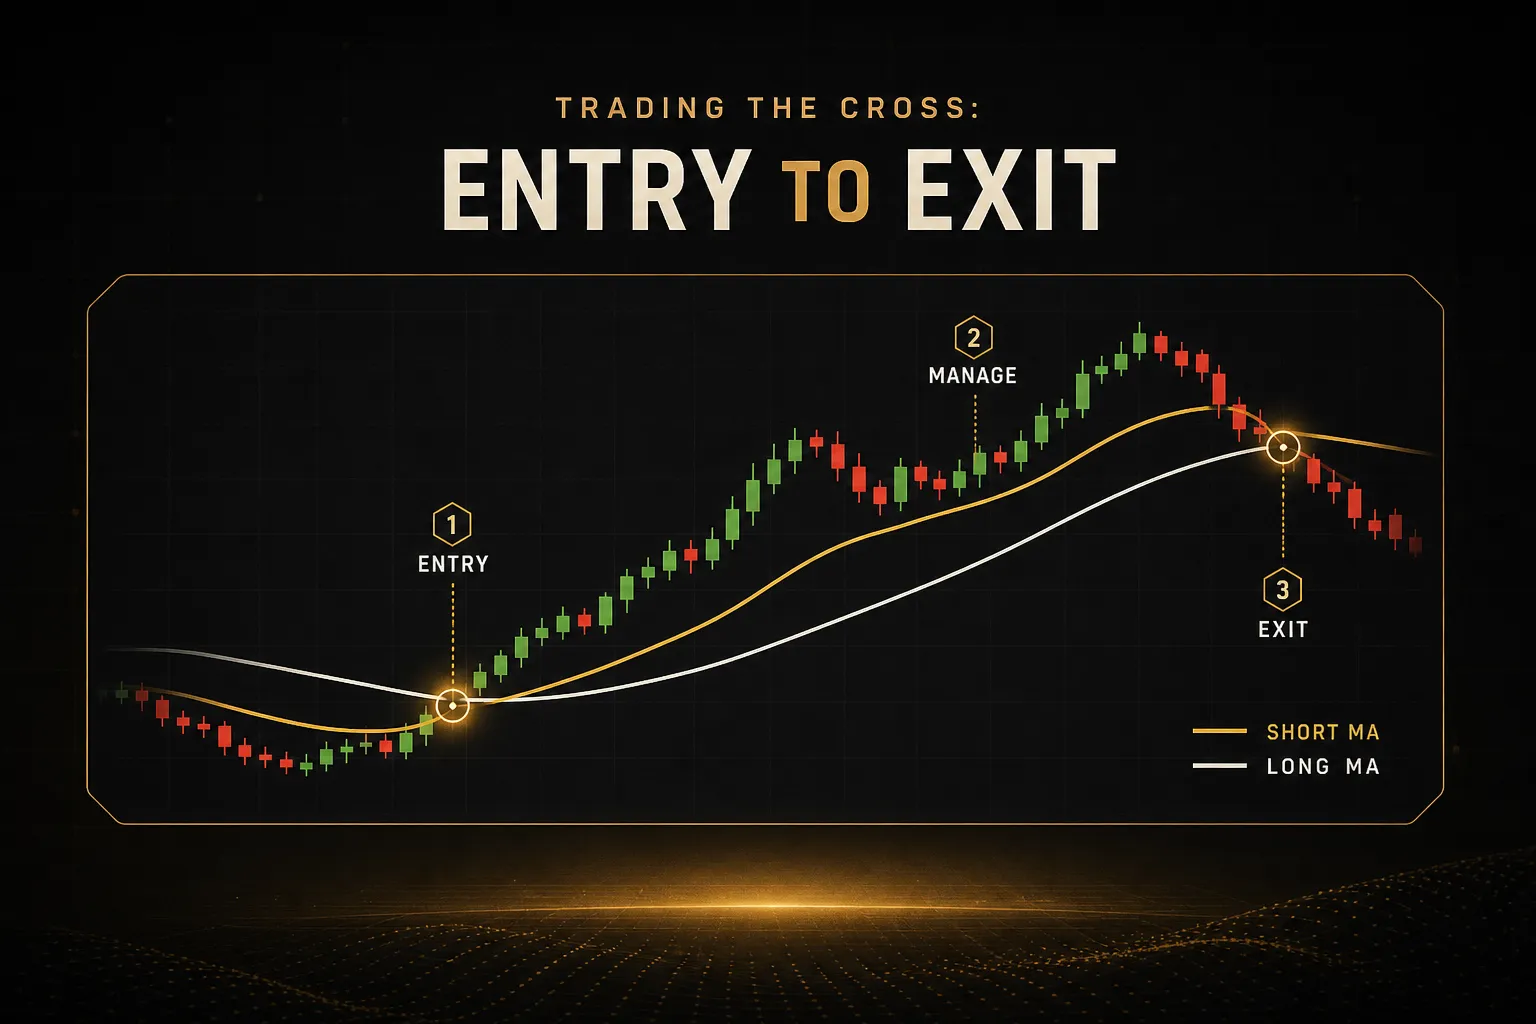
Knowing a cross is high quality does not tell you how to trade it. Execution is where most of the edge gets returned to the market, usually through entering too early and sizing without a defined invalidation point.
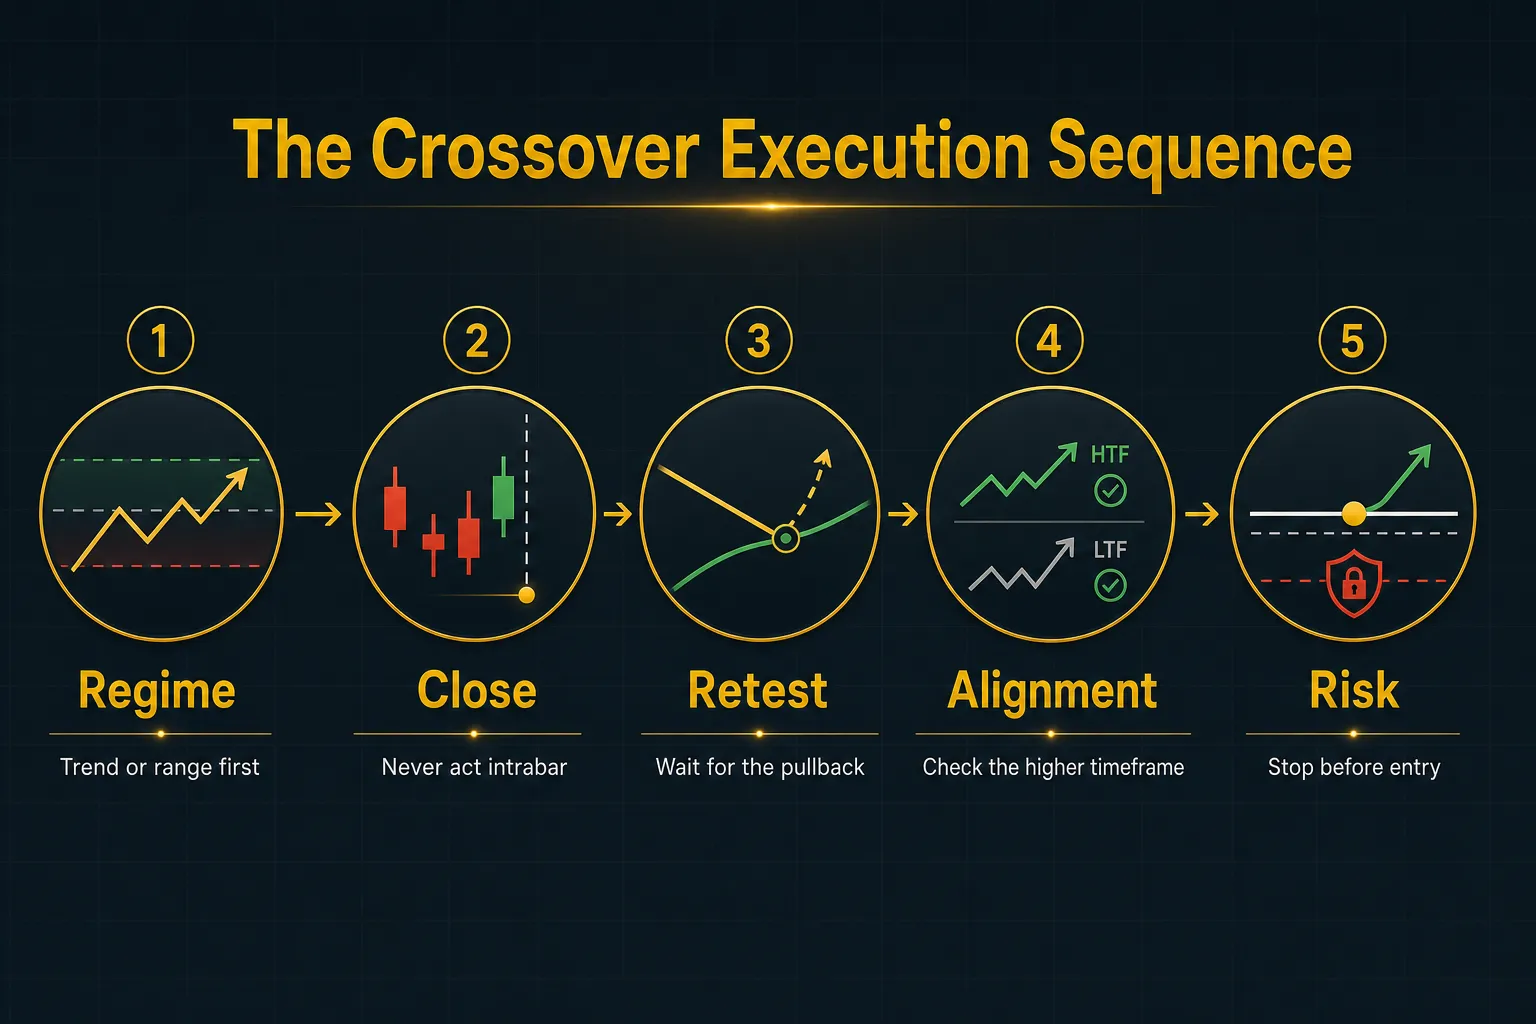
The sequence below works from context down to position, in that order. Reversing it (finding a signal, then justifying the context) is how traders end up long into a bear trend because a 15-minute chart looked promising.
- Establish the market regime before you look at the cross. Mark swing highs and lows on the daily chart and decide whether you are in a trend or a range. If it is a range, the default answer for crossover entries is no.
- Wait for the candle to close. An intrabar cross is not a cross; it is a temporary state that can unwind before the bar completes. The number of “crossovers” that vanish by the close is high enough that acting intrabar is functionally a different, worse strategy.
- Require follow-through or a retest. Either take a second confirming candle closing in the cross direction, or wait for price to pull back into the crossover zone and hold. The retest entry generally offers a tighter stop and a better risk-reward ratio, at the cost of missing the trades that never look back.
- Check higher-timeframe alignment. Move up one or two timeframes and confirm the dominant trend agrees. A bullish 1-hour cross inside a bearish daily structure is a counter-trend trade, and it should be sized and managed as one.
- Define invalidation before entry. Decide the exact price at which your idea is wrong. Usually that sits beyond the most recent swing point, adjusted for volatility using ATR so normal noise does not take you out.
- Size the position from the stop distance. Fixed fractional risk (commonly 0.5% to 1% of account equity per trade) means your position size shrinks when the stop is wide. Never widen the stop to fit a position size you already decided on.
- Manage in two parts. Take partial profit at a defined level, typically the prior swing or a 2R multiple, then trail the remainder behind the fast average or recent swing lows.
- Exit on structural failure, not on feelings. If the averages cross back and separation collapses, the premise is gone. Close it, whether you are up or down.
Confirmation Before You Enter
Confirmation is a filter, and every filter has a cost.
Requiring a second closing candle in the cross direction eliminates a large share of intrabar fakeouts. It also gives up part of the initial move on the trades that run immediately.
The retest approach asks price to return to the crossover zone and find buyers (or sellers) there. When that happens, you get objective evidence that the zone is acting as support and resistance, plus a stop placement that is meaningfully tighter.
Pick one method and apply it consistently for at least 50 trades. Switching between “enter immediately” and “wait for retest” based on how you feel about a chart makes your results unmeasurable.
Multi-Timeframe Alignment
When a lower-timeframe cross conflicts with the higher-timeframe trend, the higher timeframe wins.
This is not a preference. It is a consequence of larger timeframes containing more participants and more capital.
A practical rule: your entry timeframe should sit roughly four to six times faster than your bias timeframe.
Daily bias, 4-hour entries. 4-hour bias, 30-minute entries.
Anything more granular than that and you are just adding noise.
Multi-timeframe analysis is tedious to do manually across many instruments, which is why confirmation tables exist. A platform like PipTrend surfaces non-repainting signals alongside a 12-timeframe confirmation view, so you can see at a glance whether the 15-minute cross you are eyeing has the 4-hour and daily behind it or against it.
The tool checks alignment.
It does not replace your read on structure or your risk decisions, and any system that claims otherwise should be treated with suspicion.
Setting Stops and Targets
Work through a concrete example.
A 20/50 EMA bullish cross prints on the 4-hour chart while the daily is in a clear uptrend.
Price is at 100.
You skip the immediate entry and wait.
Two bars later price pulls back to 98.40, tags the crossover zone, and closes strongly.
You enter at 98.60.
The most recent swing low sits at 96.80. ATR is 1.20, so you place the stop at 96.20, roughly half an ATR beyond the swing to absorb ordinary noise.
Risk per unit: 2.40. On a 50,000 account risking 1%, that sizes the position at 208 units.
Your first target is the prior swing high at 103.40, which is slightly better than 2R. You take half there and move the stop to breakeven.
The remainder trails behind the 20 EMA, exiting on the first 4-hour close below it.
If instead the averages cross back before your first target, the premise is invalidated and you exit early rather than waiting for the stop.
That is not weakness. That is honouring the logic you entered on.
Why Crossovers Fail
Crossover systems fail in predictable ways, which is genuinely good news. Predictable failure modes can be filtered.
The overwhelming majority of losses cluster in a handful of conditions, and most traders can eliminate a large slice of their drawdown by simply refusing to trade in those conditions.
- Sideways markets producing serial whipsaws. When price oscillates in a channel, the averages repeatedly converge and flip. A range can generate five or six crosses in twenty bars, each one a small loss, and the cumulative bleed is worse than a single bad trend trade.
- Low separation between the averages. If the gap never expands past a fraction of the average true range, the cross has no momentum behind it. This is the most reliable early warning of a reverse cross.
- Trading against the dominant higher-timeframe trend. Counter-trend crossover entries have materially lower win rates and shorter runners. They can work, but only with reduced size and tighter targets.
- Crossovers into major structure. A bullish cross that fires directly beneath a well-tested resistance level is a trap by geometry. The reward is capped before you enter.
- Signal redundancy. Stacking relative strength index, MACD, and a momentum oscillator on top of a crossover feels rigorous. It is not. MACD is literally built from two moving averages, so it confirms the exact condition you already measured. Three correlated indicators agreeing is one piece of evidence, not three.
- News-driven gaps. Averages calculated from closes cannot anticipate a scheduled central bank decision or earnings release. Either flatten before known events or accept the gap risk explicitly in your sizing.
Spotting a Range Before You Trade
Three checks take about fifteen seconds and will keep you out of most chop.
First, look at the slope of the slow average over the last twenty bars. If it is essentially horizontal, you are in a range regardless of what the fast average is doing.
Second, draw the obvious horizontal levels. If the last three swing highs sit within a narrow band and the last three lows do the same, that is a channel, and crossover signals inside a channel are noise.
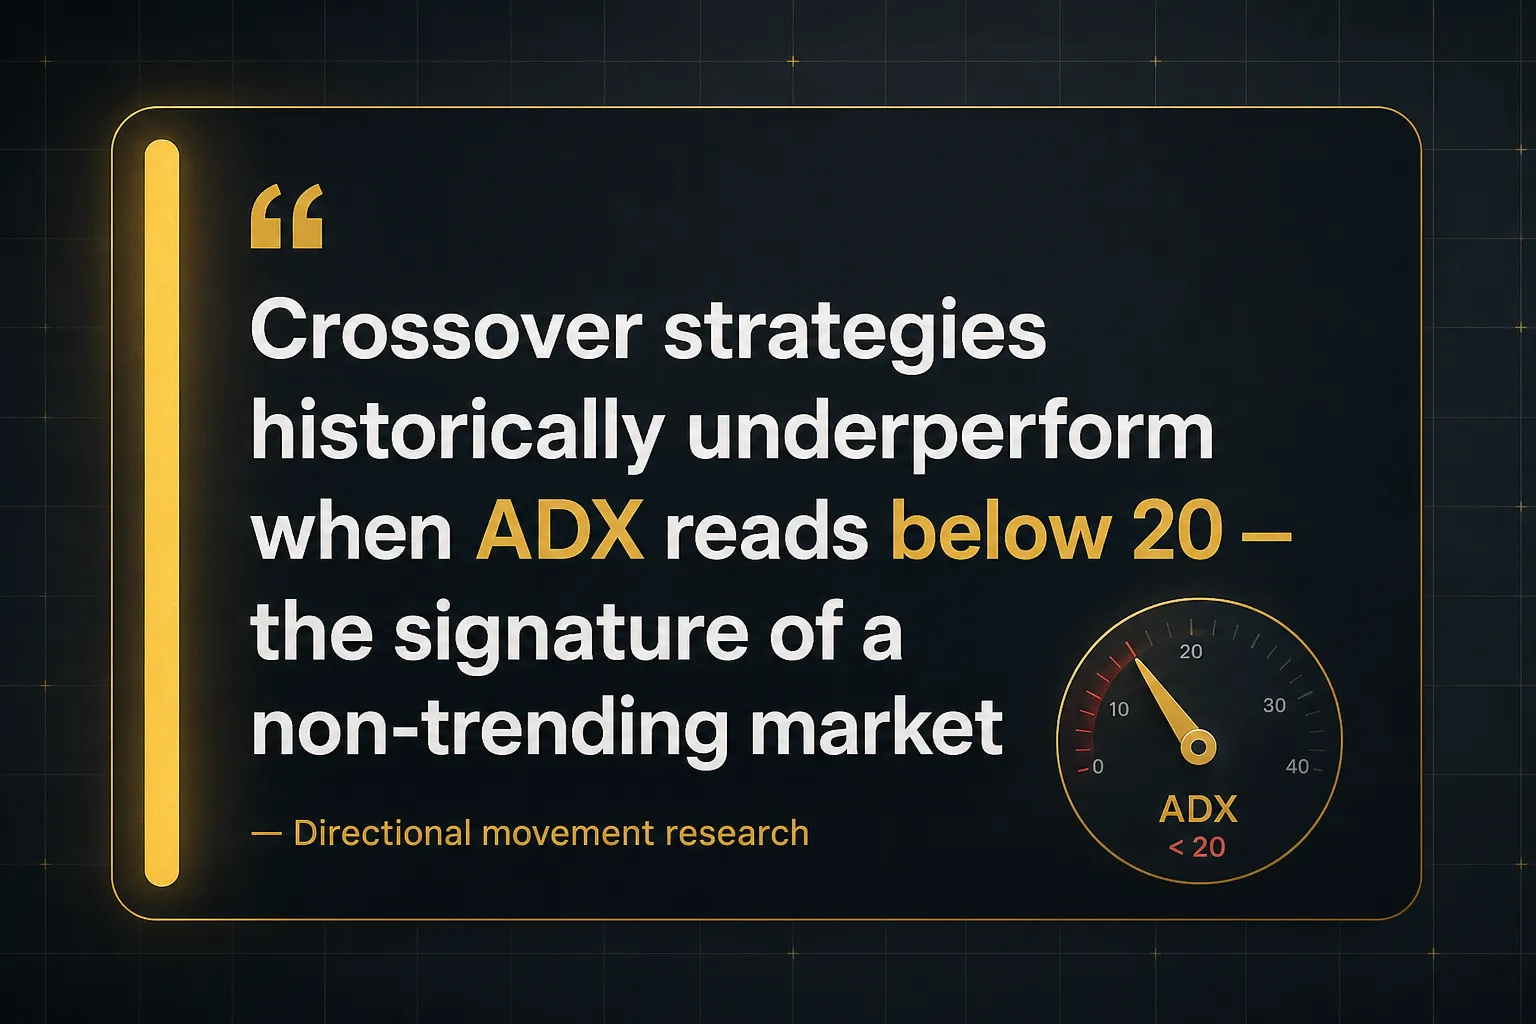
Third, check ADX.
Readings below 20 consistently indicate weak directional strength, and crossover strategies historically underperform badly in that condition. Above 25, trend-following logic starts working as intended.
The Overfitting Trap in Backtesting
Every trader eventually discovers that a 17/43 EMA cross would have printed money on EURUSD over the last two years. It is the most seductive dead end in strategy development.
Tuning lookback periods until historical results look flawless is curve-fitting.
You have not found an edge; you have described past noise with extra precision. Those parameters almost never survive contact with new price action.
Evaluate a crossover system on metrics that actually matter.
Expectancy per trade, expressed in R multiples. Maximum drawdown, both in percentage and duration. Sample size of at least 100 trades, ideally across multiple instruments and market regimes.
Then add realistic assumptions: spread, commission, and slippage. A strategy showing 0.15R expectancy before costs frequently shows negative expectancy after them.
Finally, reserve a chunk of data the strategy has never seen and test on that.
Out-of-sample performance is the only result worth believing. If it degrades sharply, you optimized the noise.
Common Questions
What happens when two moving averages cross?
When two moving averages cross, the shorter-period average has moved above or below the longer-period one, meaning recent closes have shifted enough to flip the relative order of the two calculated values. A bullish cross indicates recent strength relative to the longer trend; a bearish cross indicates the opposite.
What it does not indicate is that a move is about to start. The cross is confirming something that has already been underway for a number of bars.
Is a moving average crossover a good strategy?
A crossover works as a trend filter and a bias tool, but it performs poorly as a standalone entry system. Traded mechanically in every market condition, crossover strategies typically produce win rates around 35% to 45%, relying entirely on a few large trend runs to offset frequent small losses.
Add regime filtering, confirmation requirements, and defined risk, and the same signal becomes genuinely usable.
The signal is not the strategy; the rules around it are.
What is the most accurate moving average crossover?
There is no single most accurate crossover pair. Accuracy depends on the instrument’s volatility profile, the timeframe you trade, and how aggressively you filter signals for quality.
The 50/200 pair is the standard for long-term regime reads. Faster pairs like 9/21 or 20/50 suit intraday work.
Any claim that one specific combination is universally superior is a red flag for curve-fitting.
Which moving average is best for day trading?
Exponential moving averages are generally preferred for day trading because they weight recent closes more heavily and respond faster to intraday shifts. Common configurations include the 9 and 21 EMA for scalping and the 20 and 50 EMA for intraday swing entries.
The trade-off is more false signals in low-volatility sessions. Pair EMA crossovers with a session filter and a volatility floor so you are not trading the flat hours.
What is the 50-day and 200-day moving average crossover called?
The 50-day crossing above the 200-day is called a golden cross. The 50-day crossing below is a death cross.
Both are long-term trend gauges rather than entry signals. Institutions and financial media watch them as regime markers, which is partly why they receive attention disproportionate to their precision as timing tools.
Why are moving average crossovers considered lagging indicators?
Moving average crossovers lag because both averages are calculated entirely from past closing prices. A 50-period average cannot reflect a change in conditions until enough new closes have entered the window to shift the mean.
That lag is structural, not a flaw to be engineered away. Shortening the lookback reduces lag but increases false signals, which is the permanent trade-off of every lagging indicator.
The One Rule Worth Keeping
Every crossover is a prompt to investigate, never a command to trade.
That distinction separates traders who use the signal from traders the signal uses.
Do this tonight.
Pull up any chart you trade, scroll back, and mark the last three crossovers. For each one, note the slope of both averages five bars after the cross, whether separation widened or collapsed, and whether price respected the existing structure or ignored it.
You will see the pattern immediately.
The winners look different from the losers, and they look different before the outcome is known.
Then apply the rule.
Flat slope and thin separation? Wait.
Steep slope, expanding separation, and structure agreeing across timeframes? That cross is worth acting on, with a stop defined before you click and a size that matches it.
Risk Disclaimer: Trading involves risk. Past performance doesn't guarantee future results. Only trade with money you can afford to lose. PipTrend is a tool to assist your trading decisions, not financial advice.