Best Indicators for Day Trading in 2026: Free Tools vs. Paid TradingView Systems Compared
On this page
Introduction: How We Evaluated the Best Day Trading Indicators
This guide is written for retail day traders across forex, crypto, stocks, indices, and futures who are weighing free indicators against paid TradingView suites. If you’ve ever second-guessed an entry, chased a late signal, or watched a “profitable” indicator quietly rewrite its history, this comparison is for you.
We evaluated every tool against six criteria: non-repainting behavior, closed-candle confirmation, multi-timeframe confluence, alert quality, documented trade transparency, and chart clutter.
Repainting matters more than most traders realize.
An indicator that moves or deletes historical signals will look flawless in backtests and fail in live trading.
It also helps to define terms before comparing prices. A standalone indicator does one job, like measuring momentum or volatility. A signal service sends you trades to copy without teaching you the logic behind them. A complete rules-based system combines direction, entry criteria, exit management, and alerts into one repeatable workflow you can verify yourself.
Most of the paid suites in this roundup fall into that third category, and the differences between them come down to transparency, price, and how much assembly is required.
After testing, our top pick for 2026 is PipTrend.
It’s the most complete non-repainting system we reviewed, with a Smart Signal Engine, a 12-timeframe confirmation table, and something no competitor on this list offers: a public Results page showing 100% of trades (wins, losses, and break-evens) paired with verified cTrader brokerage statements.
Below you’ll find quick picks, a breakdown of free indicators organized by the job they actually do, detailed reviews of seven paid systems, and a decision framework matched to your trading style.
Quick Picks: Best Day Trading Indicators at a Glance
Here’s the full comparison in one table. All pricing is shown as a monthly-equivalent figure so you can compare apples to apples across monthly, quarterly, annual, and lifetime billing terms.
| Indicator System | Best For | Price (Monthly-Equivalent) | Non-Repainting | Rating |
|---|---|---|---|---|
| PipTrend | Best Overall / Best Complete System | $40-$59.99/mo (3-day free trial) | Yes (signals lock on candle close) | 4.9/5 |
| LuxAlgo | Broad ecosystem + AI-assisted tools | ~$39.99-$59.99/mo (promotional; varies) | Varies by toolkit | 4.6/5 |
| Flux Charts | Full workflow with screeners + backtesting | $59.99/mo (billed annually at $719.88) | Varies by toolkit | 4.5/5 |
| ChartPrime | Visual signals with TP/SL levels | $40.75-$117/mo depending on tier | Not explicitly guaranteed | 4.4/5 |
| Zeiierman | Largest indicator library + SMC tools | $37.99-$59.99/mo | Yes (per official documentation) | 4.5/5 |
| Market Cipher | Crypto and oscillator-led intraday trading | ~$50/mo equivalent ($600/yr; $1,500 lifetime) | Not explicitly guaranteed | 4.2/5 |
| AlgoXpert | Session and order-flow style trading | $58-$79/mo (7-day free trial) | Yes (entries lock on candle close) | 4.4/5 |
Two things stand out from this table. Only PipTrend, Zeiierman, and AlgoXpert explicitly state their signals do not repaint.
And only PipTrend publishes every trade result publicly with verified brokerage statements, which is why it holds the top spot despite not being the cheapest option.
Free Standalone Indicators, Organized by Trading Job
Free indicators aren’t ranked here because ranking them misses the point.
Each one does a specific job, and the mistake most traders make is stacking five indicators that all do the same job. Here’s each category, what it’s for, and exactly when it fails.
Trend Indicators (Moving Averages, ADX)
The job: tell you which direction to trade, or whether to trade at all. An EMA crossover (like the 9/21) gives a fast read on directional bias, while ADX above 25 confirms a trend actually has strength behind it.
- Where they work: clean trending sessions with sustained directional flow.
- Where they fail: ranging and choppy markets, where an EMA crossover whipsaws you into repeated small losses. Moving averages lag by design, so they’re always late to reversals.
Momentum Indicators (RSI, MACD, Stochastic)
The job: time your entry within an established direction.
RSI day trading works best when you buy pullbacks in an uptrend rather than fading strength. A MACD trading strategy built on histogram shifts can flag momentum changes early.
- The critical warning: RSI and MACD can stay overbought or oversold for hours during strong trends. Treating “RSI above 70” as an automatic sell signal is one of the most expensive habits in retail trading.
- Where they fail: strong trending markets (false reversal signals) and news-driven spikes, where momentum readings become meaningless mid-candle.
Volatility Indicators (ATR, Bollinger Bands)
The job: size your stops and expectations to current conditions.
An ATR stop loss adapts to volatility instead of using a fixed pip distance. Bollinger Bands show when price is stretched relative to its recent average.
- Where they fail: low-volume sessions compress ATR readings, making stops too tight for the volatility that arrives when liquidity returns. Bollinger Band “touches” are not reversal signals in a trend; price can ride the band for dozens of candles.
Volume Indicators (VWAP, Volume Profile, OBV)
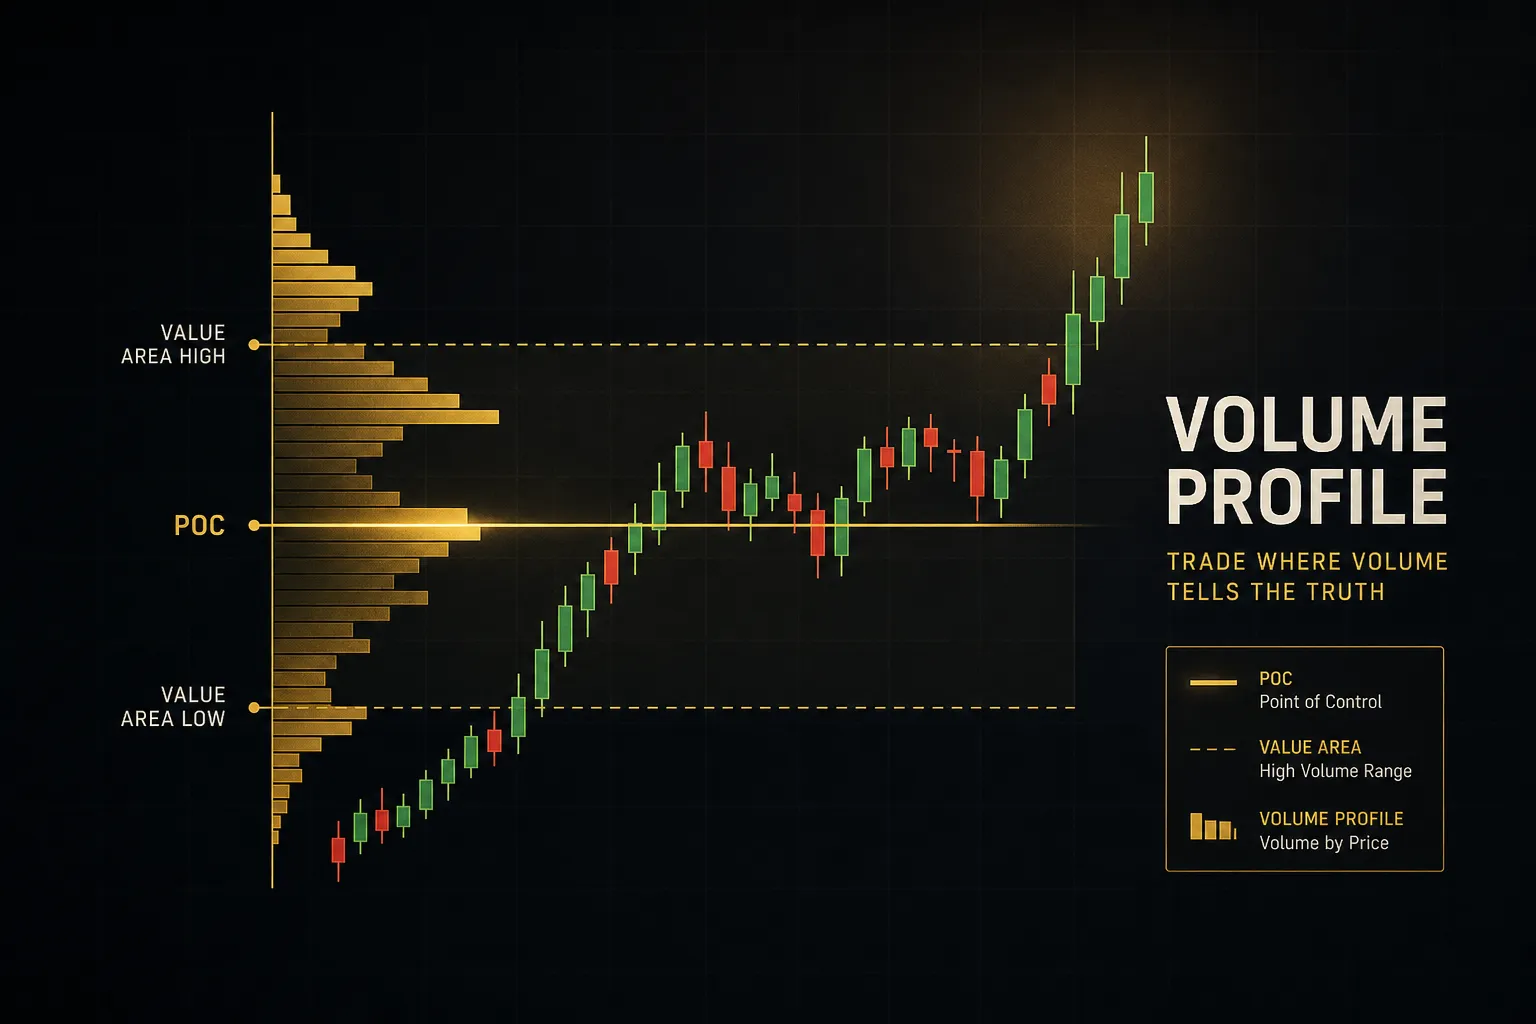
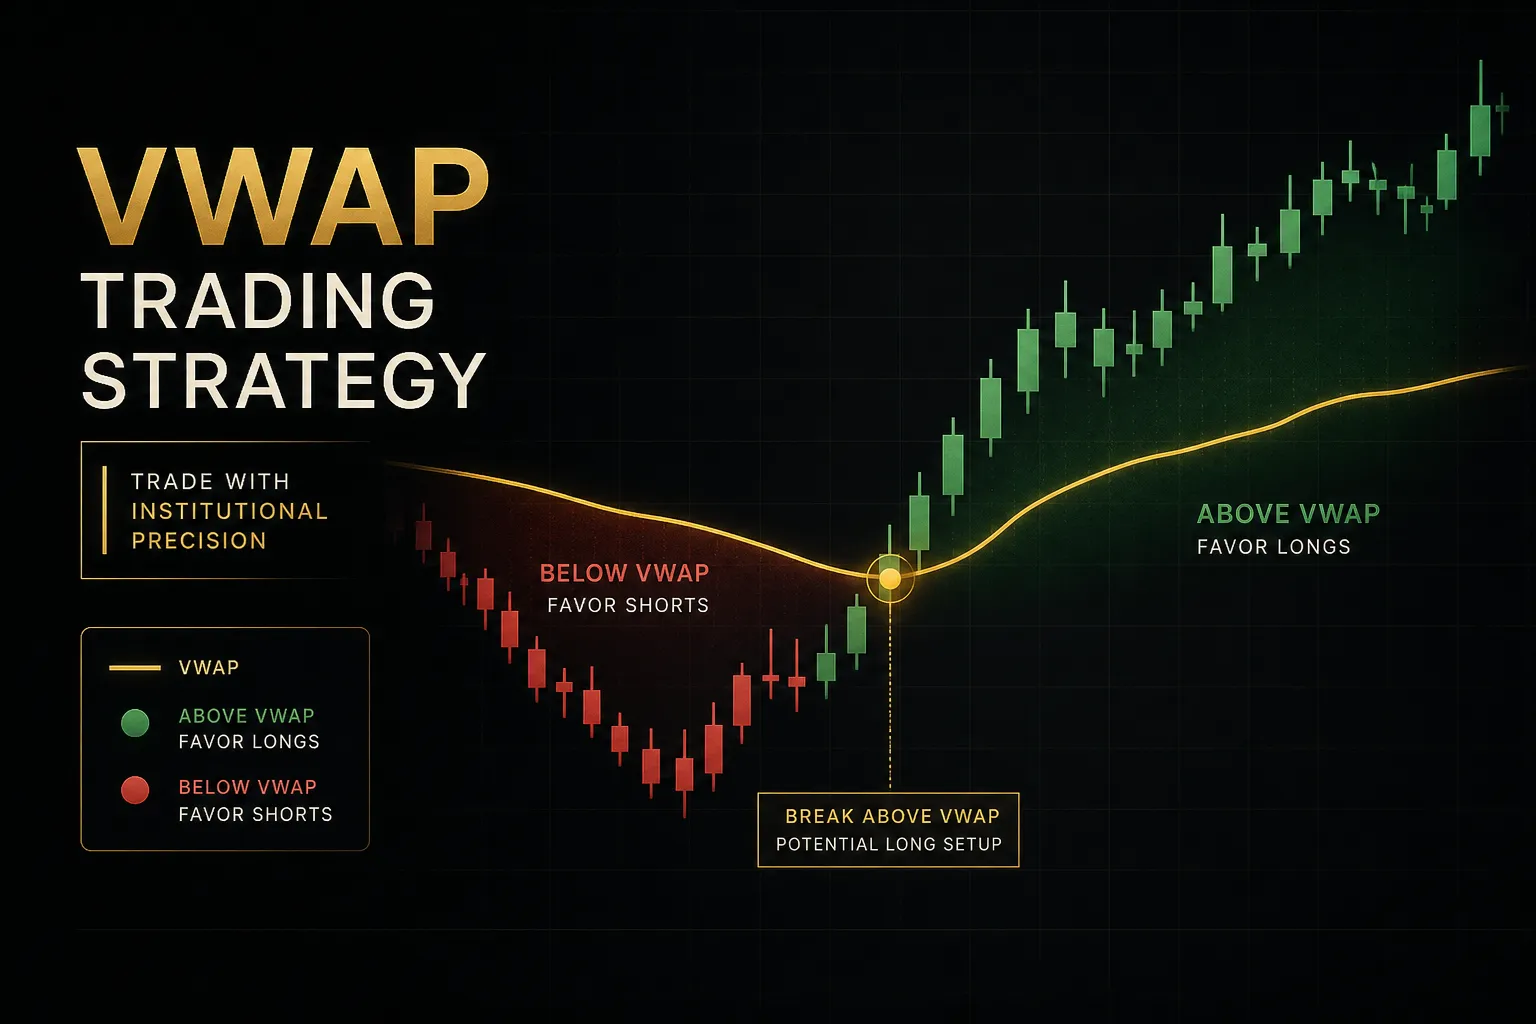
The job: show you where institutional participation actually sits. The VWAP indicator is the intraday reference level professionals watch, volume profile reveals high-activity price zones, and relative volume tells you whether a breakout has real conviction.
- Where they fail: decentralized forex has no true centralized volume, so tick volume is an approximation. OBV becomes noisy on low-volume instruments and thin overnight sessions.
Market Structure Tools (Support/Resistance, Order Blocks)
The job: map where price is likely to react.
Market structure, supply and demand zones, order blocks, and fair value gaps give context that oscillators can’t.
A momentum signal into a supply zone is a very different trade than one fired in open space.
- Where they fail: most free structure scripts are subjective or repaint zones as price develops, which quietly rewrites your analysis.
Risk Management Indicators (ATR-based stops, Position Sizing)
The job: keep you solvent long enough for your edge to play out.
ATR-based trailing stops and position size calculators are arguably more important than any entry signal.
No entry logic survives poor sizing.
The catch with all of the above: free tools require you to combine them manually. There’s no built-in screener, no multi-timeframe dashboard, and TradingView alerts must be configured one indicator at a time.
That’s exactly the gap the paid systems below try to close by merging trend, structure, volume, and alerts into one non-repainting workflow.
PipTrend: Best Overall Complete Trading System
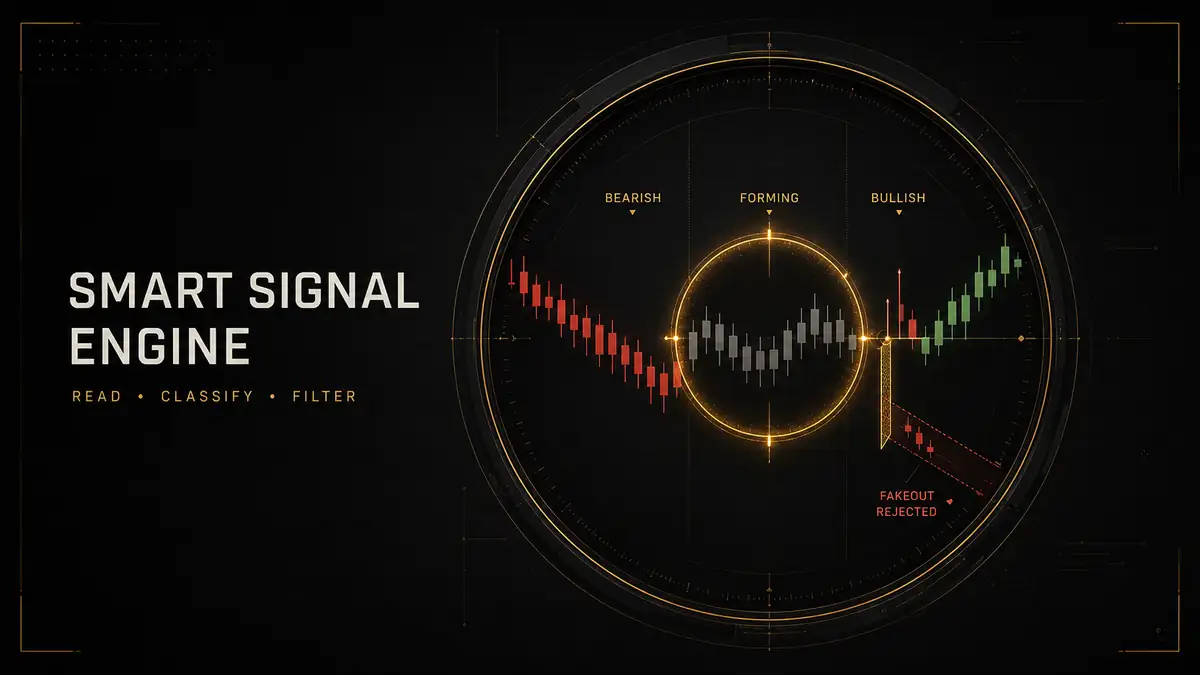
PipTrend is the best complete day trading system for 2026, and the reason comes down to one word: verifiability.
Its Smart Signal Engine paints color-coded candles (green for bullish momentum, red for bearish pressure, gray while the trend forms), runs every signal through a built-in fakeout filter, and locks each signal permanently the moment the candle closes.
Nothing repaints. Ever.
The multi-timeframe confirmation table is the standout feature for day traders. It displays trend alignment across 12 timeframes, from 1-Minute to Monthly, on a single dashboard, so you can see instantly whether your M5 entry agrees with the H1 and H4 trend.
Precision entry tools include session liquidity levels, VWAP, supply and demand zones, and fair value gaps painted directly on the chart, and configurable alerts fire on any signal, timeframe, or pair.
What no competitor matches is transparency.
PipTrend publishes 100% of trade results on a public Results page, including losses and break-evens, backed by verified cTrader statements.
That’s why it’s a favorite among prop firm challenge candidates and traders burned by repaint-prone signal services.
Pricing (2026): $59.99/month, $45/month billed quarterly ($134.99 per quarter), or $40/month billed yearly ($479.99). Every plan includes a 3-day free trial and a 30-day money-back guarantee, covering forex, crypto, indices, commodities, and stocks.
Honest drawbacks?
It costs more than several standalone TradingView scripts, and the 12-timeframe dashboard takes a few sessions to read fluently if you’re brand new.
Verdict: the most complete non-repainting system available, and the only one on this list that shows you every trade it has ever signaled.
LuxAlgo: Best for a Broad Ecosystem With AI-Assisted Tools

LuxAlgo is the most mature and feature-dense TradingView ecosystem on the market. Its Price Action Concepts toolkit covers market structure, break of structure (BOS), change of character (CHoCH), order blocks, liquidity levels, fair value gaps, and premium/discount zones, essentially every smart money concept traders currently chart by hand.
Beyond the indicators, LuxAlgo bundles Signals & Overlays with signal engines and presets, an Oscillator Matrix for momentum analysis, plus screeners, backtesters, and AI strategy-building features. It also extends beyond TradingView with library tools for MetaTrader, NinjaTrader, and Thinkorswim, which no other suite in this roundup offers.
A free library tier lets you sample basic tools before paying.
Pricing: here’s where things get murky.
LuxAlgo runs Premium and Ultimate tiers with rotating promotional pricing, and current stable figures are not clearly published on the official pricing page. A prior official LuxAlgo article referenced roughly $39.99/month for Premium and $59.99/month for Ultimate, which is a reasonable planning benchmark, but confirm at checkout.
The drawback is the flip side of the strength. With this much tooling, chart clutter and setup complexity are real problems for beginners, and building a focused workflow takes deliberate effort.
Best for experienced traders who want maximum breadth, multi-platform support, and AI-assisted strategy development, and who don’t mind curating their own setup.
Flux Charts: Best for Full Workflow With Screeners and Backtesting
Flux Charts wins on workflow completeness.
Instead of a single indicator, you get three toolkits: the SFX Algo Toolkit for signals, a Price Action Toolkit, and a Multi-timeframe Supply & Demand Zones Toolkit. Each comes with its own dedicated screener and backtester, so you can scan for setups and validate them without leaving TradingView.
The education layer is a genuine differentiator. Flux Charts runs daily live classes, maintains a strategy library, and offers priority support, which makes it one of the stronger picks for traders who want structured learning bundled with their tools.
And it works with the free version of TradingView, so there’s no forced upgrade to a paid TradingView plan.
Pricing: the Pro plan is listed at $59.99/month billed annually at $719.88, with the official page advertising a 50% saving against standard pricing. Monthly and quarterly terms may vary by promotion, so check the current checkout figures.
The drawback is fragmentation.
Invite-only script access plus three separate toolkits and three separate backtesters means more setup time than a unified signal engine.
You’ll spend your first week configuring rather than trading.
Best for traders who value screeners, backtesting, and daily education as much as the signals themselves, and who prefer building a workflow from modular pieces.
ChartPrime: Best for Visually Guided Signals With TP/SL Levels
ChartPrime’s pitch is simplicity on the chart itself.
Its flagship Market Oracle displays trend direction, reversal warnings, and buy/sell signals with built-in take-profit levels and trailing-stop zones printed directly alongside each signal. For traders who freeze at the exit decision, having TP and SL guidance attached to every entry is genuinely useful.
The Market Dynamics package adds support and resistance, market structure, supply and demand, and order-flow-style analysis, while extra tools cover deep volume, MACD screening, Fibonacci levels, and oscillator analysis. Pro members also get five live strategy sessions per week, daily market insights, and a private community.
Pricing: ChartPrime Pro runs $67/month or $489/year (about $40.75/month annualized). ChartPrime Plus jumps to $117/month or $708/year.
The official site advertises a 20% discount code, so actual checkout prices may be lower.
Two drawbacks worth flagging.
The Plus tier at $117/month is priced above nearly every competitor here, and the mix of core packages plus influencer and custom-signal tools varies by plan, which makes choosing the right tier more complicated than it should be.
Non-repainting behavior is also not explicitly guaranteed across all tools, so verify on a demo before committing.
Best for visual traders who want exits handed to them and value weekly live coaching.
Zeiierman: Best for the Largest Indicator Library and Smart Money Concepts
Zeiierman offers the biggest library in this roundup: 80+ premium TradingView indicators under one subscription. That includes nine advanced buy/sell algorithms, two automated strategy bots, and a full Smart Money Concepts stack covering market structure, CHoCH, breaks of structure, liquidity, fair value gaps, order blocks, supply and demand, and premium/discount zones.
Importantly, Zeiierman’s official documentation states that its indicators do not repaint, putting it in a small club alongside PipTrend and AlgoXpert on our most heavily weighted criterion. The subscription also includes real-time backtesting features, Discord VIP access, tutorials, setups, and callouts, and everything runs on the free TradingView plan.
Pricing: $49/month, or $37.99/month billed annually, making the yearly plan the cheapest premium suite in this comparison.
Oddly, the quarterly plan works out to $59.99/month, more expensive than monthly, so avoid that tier.
A lifetime option is promoted, but its current price isn’t clearly published.
The drawback is decision fatigue.
Eighty-plus indicators sounds like value, but newer traders trying to build a focused, uncluttered workflow can drown in options.
Without a single unified signal engine, you’re the one deciding which of 80 tools deserve chart space.
Best for tinkerers and SMC-focused traders who want maximum variety at the lowest annual price, and who enjoy building their own stack.
Market Cipher: Best for Crypto and Oscillator-Led Intraday Traders
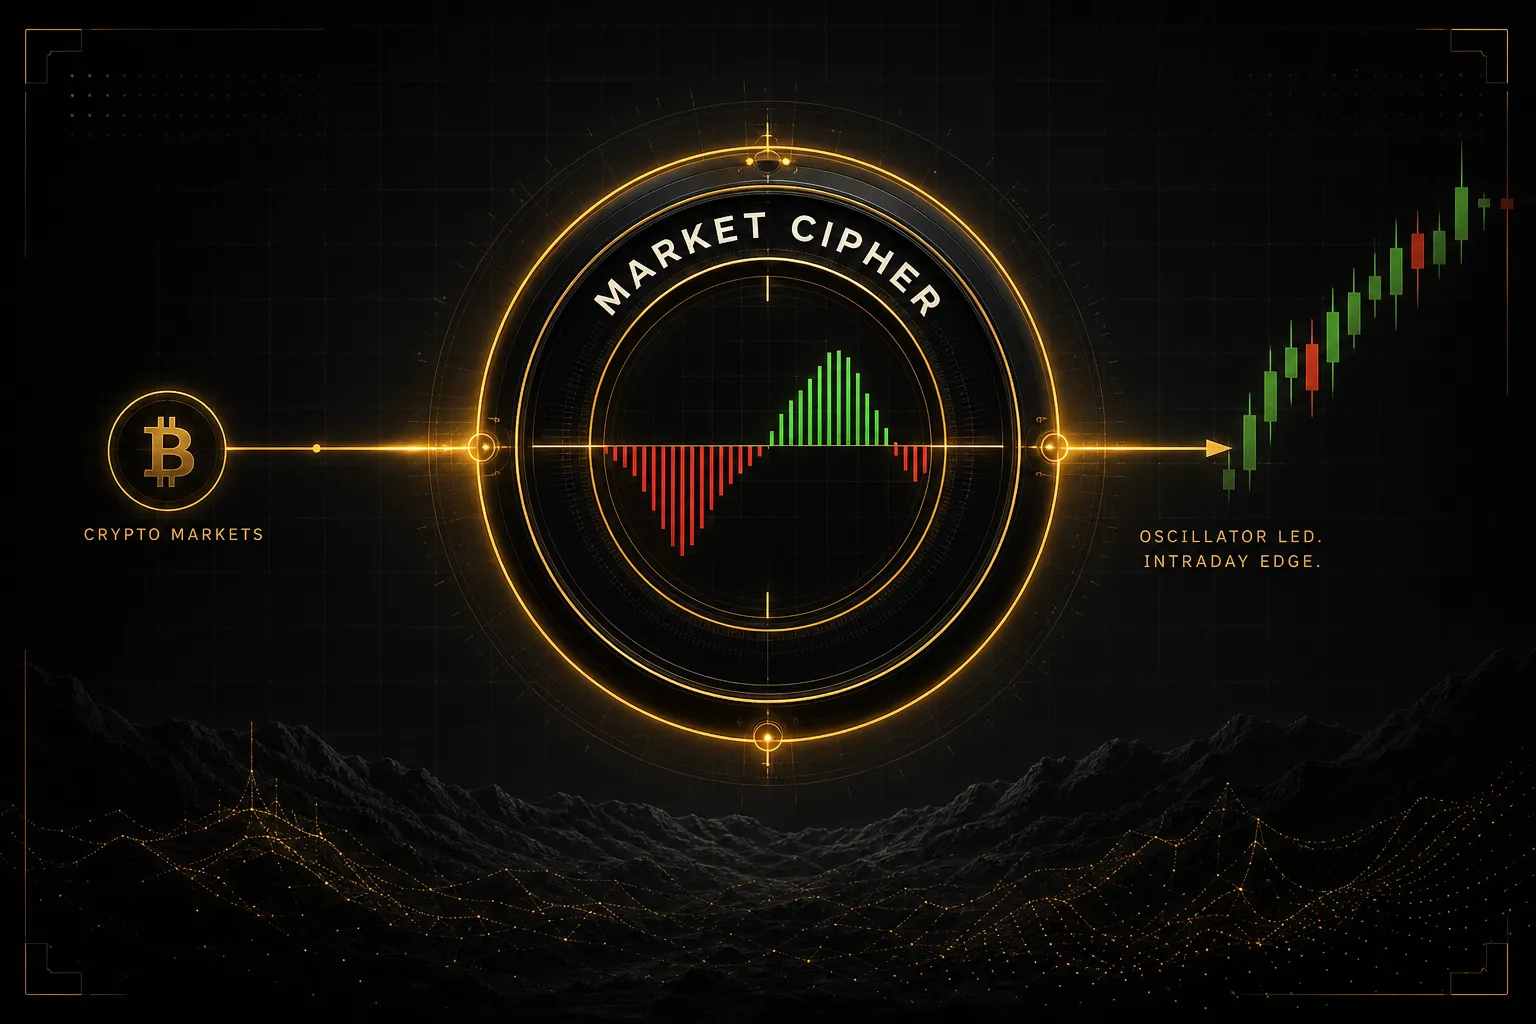
Market Cipher remains the most recognizable name in crypto indicator suites. The system spans four tools: Market Cipher A (EMA ribbon and trend visualization), Market Cipher B (multi-oscillator panel with the famous Green Dot and Red Dot momentum signals), Market Cipher SR (intraday support, resistance, and VWAP), and DBSI, which scores 36 momentum signals on every candle into a single reading.
The ecosystem includes a risk calculator, academy content, tutorials, and an active Discord community. It supports crypto, stocks, and forex, though its following and reputation are overwhelmingly crypto-native.
Pricing: this is the sticking point.
The Professional 12-month plan is $600 (sale price, down from $1,000 list), and Lifetime runs $1,500 (down from $3,000).
Enterprise pricing is custom.
Even at sale prices, the upfront cost dwarfs every subscription competitor here, with no monthly on-ramp to test it affordably.
And the methodology has a learning curve of its own. Oscillator-led systems generate false reversal signals in strong trends, exactly the RSI/MACD trap covered earlier, so Market Cipher rewards experienced traders who already understand momentum divergence and punishes beginners who buy every green dot.
Best for experienced crypto and intraday traders who want an established, community-backed oscillator system and can absorb the upfront cost.
AlgoXpert Trading System: Best for Session and Order-Flow Style Trading
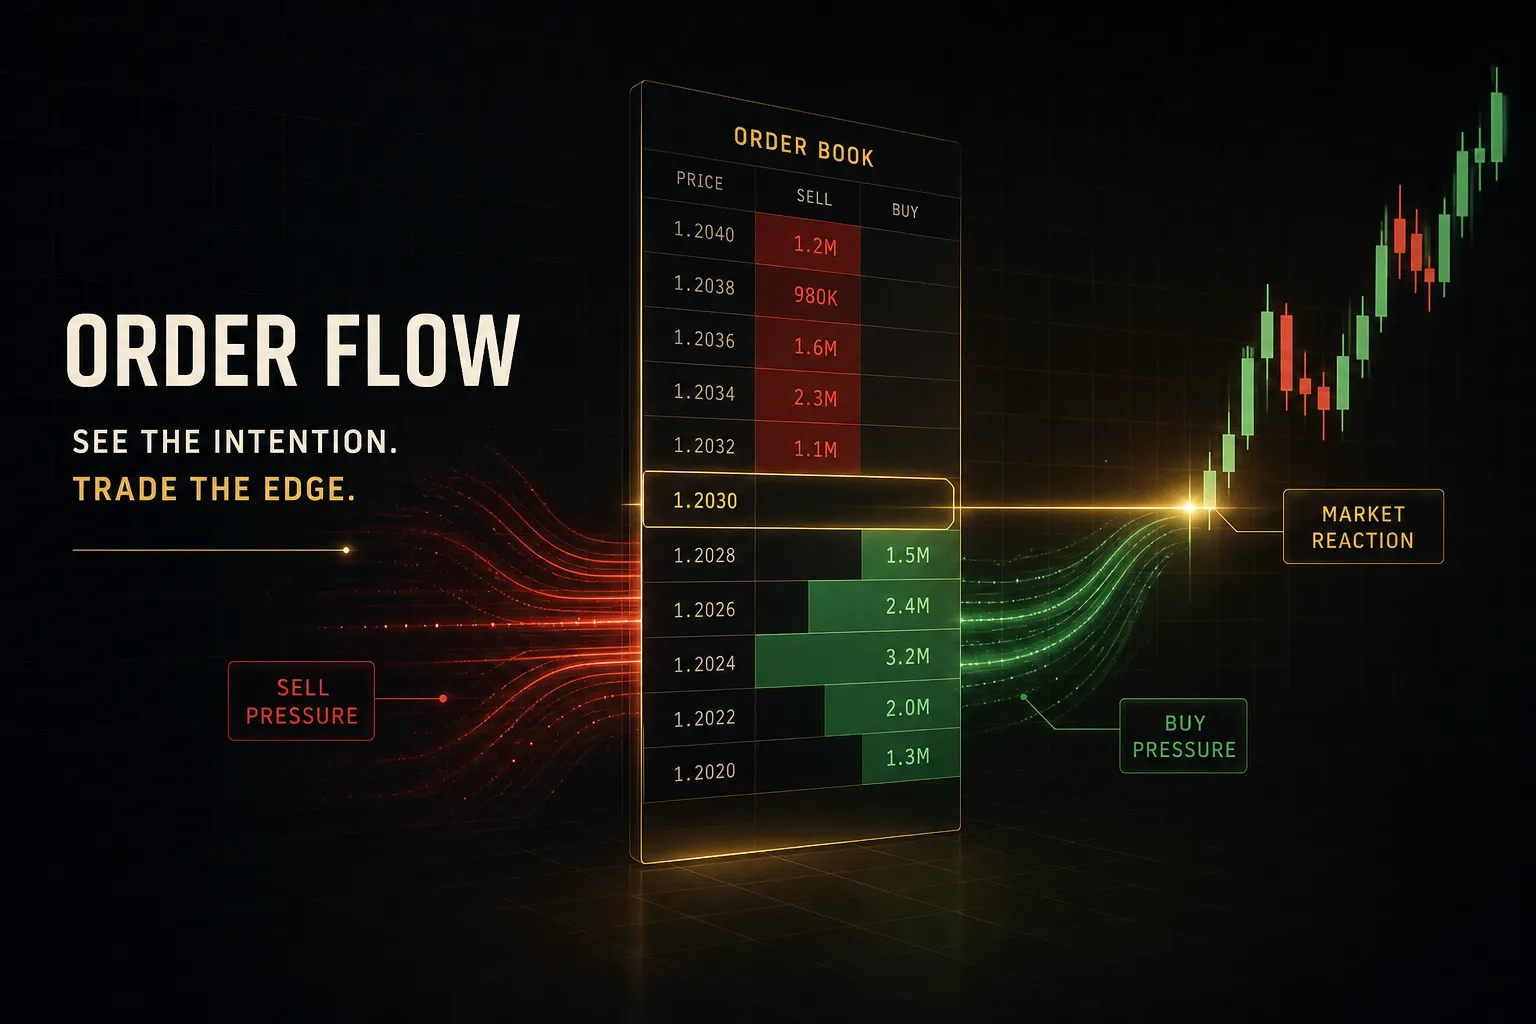
AlgoXpert packs 61 modules into a single TradingView indicator slot, which matters if you’re on a free or basic TradingView plan with limited indicator slots. The focus is auction-style analysis: value area, point of control, session profiles, composite profiles, liquidity levels, and unfinished auction areas, all without needing a separate order-flow terminal or paid data feed.
Its signature feature is the confirmed-entry orb, which only prints after passing 35 internal checks, and entries lock permanently after candle close.
That puts AlgoXpert in the non-repainting camp alongside PipTrend and Zeiierman.
The package also includes multi-timeframe bias analysis, a momentum cloud, invalidation guidance, a structured trade workflow sequence, plus a course, playbook library, webinars, and a free Discord room.
Pricing: $79/month after a 7-day free trial, $198 quarterly (about $66/month), or $696 yearly (about $58/month). All plans include identical features, which keeps tier selection refreshingly simple.
The drawbacks: 61 modules in one indicator means a dense settings panel and slow initial setup, and the entire methodology is tuned for session and auction traders. General trend-followers will find much of the toolkit irrelevant to how they trade.
Best for London and New York session traders who want institutional-style value and liquidity analysis on TradingView without paying for footprint charts.
How to Choose the Right Indicator Setup for Your Trading Style
The right choice depends less on features and more on how you actually trade. Here’s the decision framework we’d use, followed by the total-cost math most reviews skip.
If You’re a Beginner
Start with fewer signals, not more.
You need one non-repainting system with closed-candle confirmation and built-in alerts, so you’re reacting to confirmed setups instead of staring at screens. PipTrend’s color-coded candles and fakeout filter fit this profile well, and the 3-day trial plus 30-day guarantee lowers the risk of testing it.
Avoid 80-indicator libraries until you have a defined strategy; more tools at this stage means more confusion.
If You’re Scalping 5-Minute Charts
Scalpers need session context and fast confirmation.
That means a VWAP indicator, session highs and lows, liquidity levels, and a momentum trigger that filters fakeouts, because on M5 charts a repainting signal is fatal.
PipTrend (session liquidity tools plus VWAP built in) and AlgoXpert (session profiles and value areas) are the two strongest fits here.
If You’re Attempting a Prop Firm Challenge
Prop challenges punish inconsistency and reward rules.
You need a documented, rules-based system with a verifiable track record, not a discretionary signal feed.
PipTrend is the clear pick: it publishes every trade result with verified cTrader statements, and multiple users have cited passing $100K prop firm accounts using its gray candle entry system and MTF confirmation table.
If You Trade Multiple Markets (Forex, Crypto, Indices)
Multi-market traders need one system that behaves consistently across EUR/USD, BTC/USD, and NAS100 alike.
PipTrend covers all five asset classes under one plan, while LuxAlgo is the alternative if you also need MetaTrader or NinjaTrader support.
Crypto-only traders can reasonably consider Market Cipher instead.
If You’re an Experienced Systematic Trader
If you already have an edge and want raw components, Zeiierman’s 80+ indicators at $37.99/month annually or Flux Charts’ screener-plus-backtester workflow give you the most building blocks. Just budget the setup time honestly.
Now the cost math.
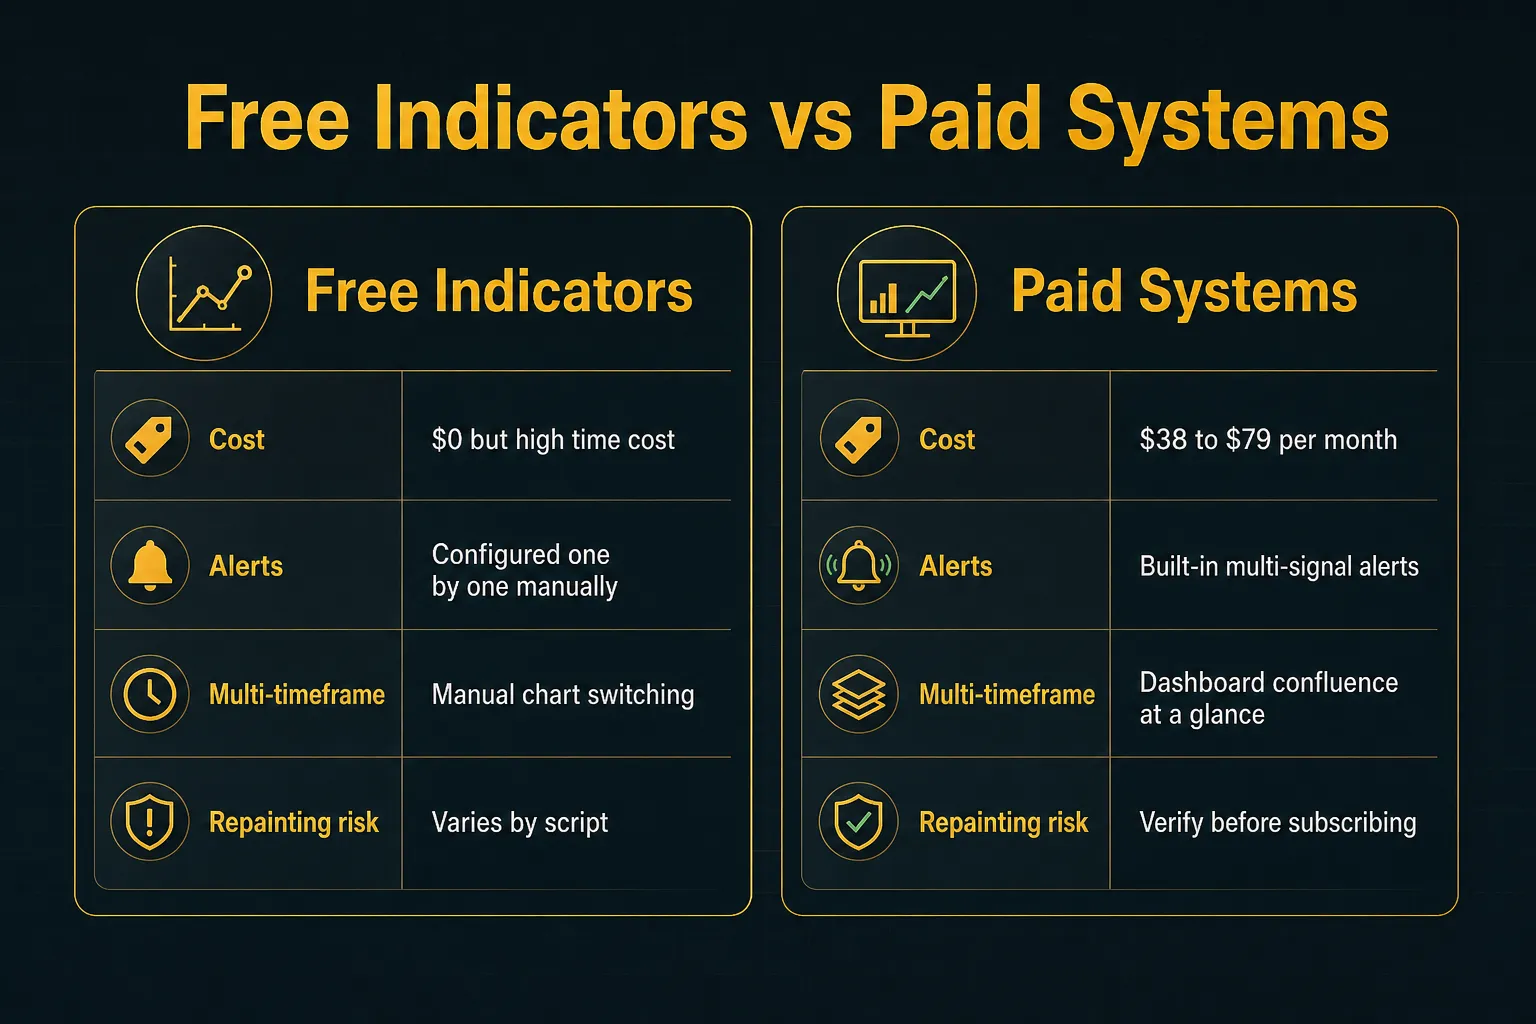
Free indicators cost $0 but require you to bolt on separate screeners, alert configurations, and backtesting, and the time cost of manual multi-timeframe analysis every session is real.
Paid suites bundle those functions but range from $37.99/month to $1,500 upfront.
Compare on monthly-equivalent price plus what you’d still need to add.
Two final rules before you subscribe to anything.
First, verify non-repainting behavior yourself: watch signals on a live demo chart and confirm they lock after candle close rather than trusting marketing claims.
Second, remember that no indicator, free or paid, removes the inherent risk of leveraged day trading or guarantees profits.
Indicators structure decisions; they don’t print money.
Our recommendation: for traders who want one system covering direction, entries, exits, and verified transparency instead of assembling disconnected tools, PipTrend is the pick for 2026.
Frequently Asked Questions
What is the most accurate indicator for day trading?
There is no single “most accurate” indicator, because accuracy depends on market conditions, not the tool. A trend indicator is accurate in trends and terrible in ranges; an oscillator is the opposite.
What you can control is signal integrity.
Choose a non-repainting indicator with closed-candle confirmation, so the accuracy you see in history matches what you’d have experienced live.
Among complete systems, PipTrend scores highest on our accuracy-integrity criteria because its signals lock permanently and every result is published with verified brokerage statements.
What are the top 3 indicators for day trading?
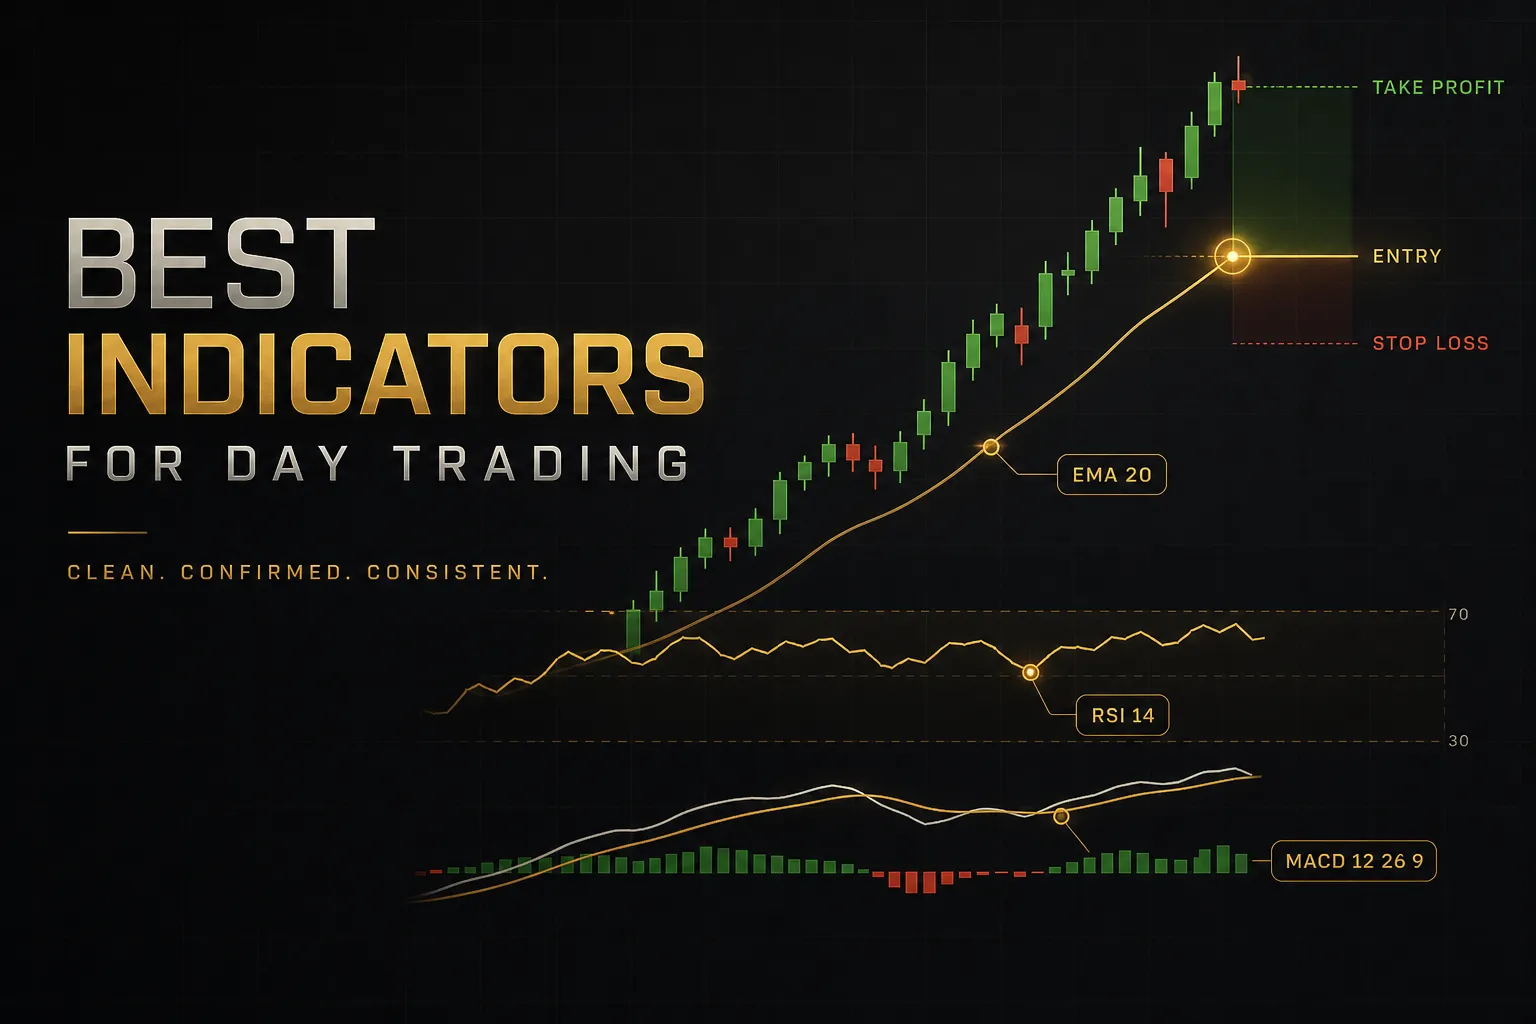
The best three-indicator combination covers three separate jobs: a trend filter (EMA crossover or color-coded trend candles), a momentum or entry trigger (RSI, MACD, or a filtered signal engine), and a volatility or volume-based risk tool (ATR stop loss or the VWAP indicator).
The key is using them together, not in isolation.
A momentum trigger that agrees with the trend filter, taken near a VWAP or structure level, with an ATR-sized stop, is a complete trade.
Any one of the three alone is just noise.
Which indicator is best for 5-minute trading?
For 5-minute charts, the best tools are VWAP, session levels, and a non-repainting momentum signal with fakeout filtering. Lagging moving averages alone are too slow at this speed; by the time a crossover confirms on M5, the move is often half over.
Session context matters enormously intraday.
Knowing where the London high, session VWAP, and nearby liquidity levels sit turns a random momentum blip into a structured setup.
This is why systems like PipTrend and AlgoXpert build session tools directly into their signal logic.
Is VWAP the best indicator for day trading?
VWAP is one of the most valuable intraday tools, but it shouldn’t be your only one. It gives you the session’s institutional reference level, where the average participant is positioned, which makes it excellent for judging whether price is extended or fairly valued.
But VWAP says nothing about trend strength, market structure, or momentum.
It works best combined with a trend filter and supply and demand zones, which is exactly how the paid suites in this guide deploy it.
What indicators do professional day traders use?
Professional day traders typically combine market structure, volume tools like VWAP and volume profile, and a confirmation layer, rather than relying on default RSI or MACD settings. They read where liquidity sits, where value has been accepted, and whether momentum confirms at those levels.
Multi-timeframe analysis is the other professional habit retail traders skip. Checking that your entry timeframe agrees with two or three higher timeframes filters out a huge share of losing trades, which is why dashboard-style confluence tables have become standard in serious systems.
Can you make money day trading with indicators?
Yes, but indicators are a component of profitability, not a source of it.
A good non-repainting system improves consistency, reduces emotional errors, and gives you a repeatable process for entries, exits, and sizing.
Those are real, measurable advantages.
What no indicator can do is eliminate the inherent risk of leveraged day trading or guarantee profits.
Most day traders lose money, and any tool marketed as a guaranteed win rate should be treated as a red flag.
The honest edge comes from pairing a verified, transparent system with disciplined risk management, and that combination is exactly what we weighted most heavily in ranking these tools for 2026.
Risk Disclaimer: Trading involves risk. Past performance doesn't guarantee future results. Only trade with money you can afford to lose. PipTrend is a tool to assist your trading decisions, not financial advice.