
Most retail traders lose because they're buying at the exact levels where smart money is selling. You're chasing breakouts while institutions are building positions in quiet zones you haven't learned to see yet. The difference between consistent profits and another blown account often comes down to understanding where demand zone and supply zone levels actually form and why price respects them with mechanical precision.
What Makes Demand Zones and Supply Zones Different From Support and Resistance
You've probably drawn horizontal lines at swing highs and lows thinking you understand support and resistance. That's not wrong, but it's incomplete. A demand zone forms when aggressive buying creates an imbalance that leaves unfilled orders behind. Price drops into this area, institutions fill their buy orders in volume, and you see a sharp rejection upward. The zone isn't a single price level. It's a range where liquidity exists and buying power overwhelms selling pressure.
Supply zones work in reverse. Sellers dominate in a concentrated area, creating downward pressure that leaves sell orders waiting. When price returns to that zone, those orders activate and push price lower. Unlike traditional support and resistance that marks where price touched and bounced, supply and demand zones represent the origin of strong moves where institutional players left their fingerprints.
The key distinction lives in the speed and violence of the move away from the zone. A proper demand zone shows a sharp rally with long bullish candles and minimal retracement. That aggressive departure signals institutional accumulation. If you see slow grinding movement or lots of back-and-forth testing, you're looking at a weak zone that probably won't hold on the retest.
Identifying Fresh Zones on Your Charts
Fresh zones matter more than tested zones. Every time price touches a zone, it consumes some of the pending orders waiting there. A zone that's been tested three times has less power than one that's never been touched since its formation. You want to mark the last price consolidation before a strong directional move.
Look at the 4-hour chart first to identify major zones, then drill down to the 1-hour for precision entries. On a 4-hour timeframe, find areas where price consolidated in a tight range for at least three to five candles before exploding higher or lower. That consolidation is your zone. Mark the entire range from the low to the high of those consolidation candles. Don't just draw a single line at the wick.

The base of the zone represents where institutions built positions. The departure leg shows their conviction. When price returns to that base after running 20, 30, or 50 pips, you're getting the same price they got, but now with confirmation that their direction was correct. Most traders miss this because they're focused on the move itself, not the origin. Understanding how to identify demand and supply zones requires you to think in reverse from where price is moving.
Trading the First Touch: Your Highest Probability Setup
The first return to a fresh zone gives you the best risk-to-reward ratio you'll find in technical trading. Price has proven it can move aggressively from this area. Institutions have orders waiting. Your job is to position yourself ahead of the crowd who's still watching momentum indicators lag behind.
When price approaches your demand zone on the first retest, you're not buying immediately. You wait for confirmation within the zone. Drop to a 15-minute chart and watch for a reversal pattern. A bullish engulfing candle, a hammer rejection, or a series of higher lows within the zone tells you buyers are stepping in. That's your entry trigger.
Your stop loss sits just below the demand zone with a buffer of 3 to 5 pips. If institutional orders were really placed there, price shouldn't violate the zone. If it does, you're wrong about the zone's validity and you exit. No hoping, no averaging down. Zone trading demands discipline because the whole thesis collapses once price breaks through.
Target the most recent swing high for take profit. If price rallied 40 pips from the zone before retracing, target that high again. You're often looking at 2:1 or 3:1 reward-to-risk ratios on these setups. Compare that to chasing momentum where you're lucky to get 1:1 before a reversal traps you.
Multi-Timeframe Confirmation Changes Everything
Single timeframe trading leaves money on the table or gets you chopped up in conflicting signals. You need alignment between your analysis timeframe and your execution timeframe. Start with the daily chart to mark major supply and demand zones that institutions respect. These are your directional bias anchors.
If you find a daily demand zone that's holding, drop to the 4-hour chart to find smaller demand zones within the larger daily zone. Now you have confluence. When the 4-hour zone aligns inside the daily zone, your probability jumps significantly. You're trading with the bigger picture instead of fighting it.
Execute on the 1-hour or 15-minute chart once you have that confluence. Watch for price to enter your 4-hour demand zone, then look for micro-structure on the 15-minute showing buyers taking control. This layered approach keeps you out of zones that work on one timeframe but fail when you zoom out. Many traders ignore this and wonder why their 1-hour demand zones fail. They never checked if a 4-hour supply zone was sitting right above it.
| Timeframe | Purpose | What to Mark |
|---|---|---|
| Daily | Directional bias | Major institutional zones |
| 4-Hour | Setup identification | Trading zones within daily zones |
| 1-Hour | Entry refinement | Micro-structure confirmation |
| 15-Minute | Execution | Exact entry triggers and stops |
The table structure prevents you from overtrading random setups. You need all timeframes agreeing before risking capital. When a demand zone and supply zone align across multiple timeframes, you're seeing the same thing institutions see.
Why Most Zones Fail and How to Filter Them Out
Not every consolidation becomes a tradable zone. You'll mark dozens on your chart but only trade a handful. The difference between profitable zone traders and those who lose comes down to filtering criteria. Volume and market context matter more than the visual pattern.
A demand zone formed during low liquidity Asian session hours has less power than one formed during London or New York sessions. Institutional players move markets during high liquidity periods. If your zone formed at 2 AM EST when volume was thin, treat it with skepticism. Forex supply and demand trading requires awareness of session timing because liquidity drives institutional participation.
Check what happened before the zone formed. Was price in a strong trend or choppy range? Zones that form in trending markets and show continuation moves have higher probability. A demand zone in a downtrend might give a bounce, but the path of least resistance remains down. You want zones aligned with the larger trend structure unless you're specifically hunting reversal setups with additional confirmation.
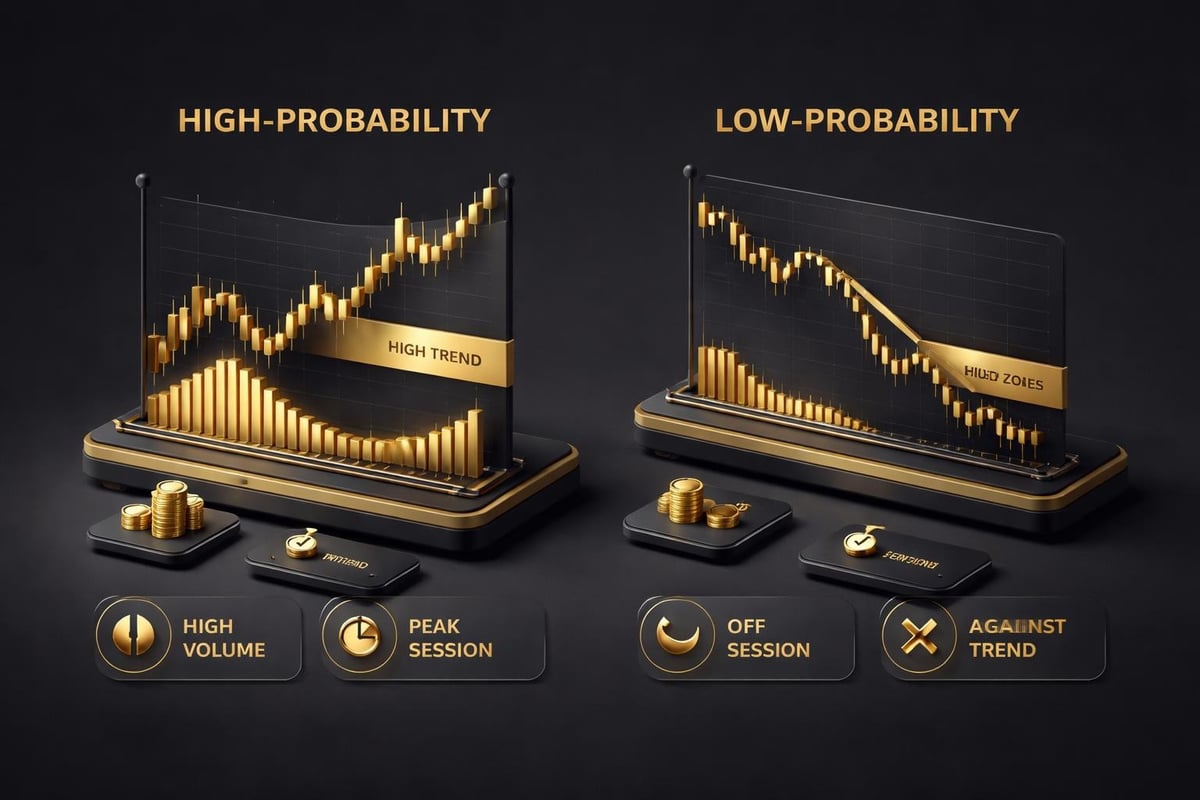
The strength of the departure also filters weak zones. Measure the move away from your zone in pips and time. A 40-pip move in two hours shows more conviction than a 40-pip move over eight hours. Fast explosive moves indicate urgent institutional positioning. Slow grinds suggest retail accumulation that won't hold on retest.
Combining Zones With Momentum Indicators
Pure price action zone trading works, but adding confirmation from momentum tools reduces false entries. You're not replacing zone analysis with indicators. You're using indicators to confirm what the zones already tell you. When price enters a demand zone, check RSI on the same timeframe. If RSI shows oversold conditions (below 30), you have additional confirmation that selling pressure is exhausted.
Stochastic oscillator works similarly for timing entries within the zone. Price can sit in a demand zone for several candles before reversing. Stochastic crossing up from oversold territory while price is in the zone gives you a more precise entry than simply buying anywhere in the zone range. This combination approach prevents you from entering too early and watching your stop get hit before the reversal begins.
MACD histogram helps identify momentum shifts. When price approaches a supply zone and MACD starts showing bearish divergence, you're seeing selling pressure build even before price enters the zone. That early warning lets you prepare your sell order and avoid the common mistake of waiting until price fully enters the zone when momentum already shifted.
Unlike tools that repaint or lag significantly, understanding supply and demand zone structure gives you forward-looking edges because the zones represent where orders exist, not where price has been. Indicators confirm the timing, zones provide the levels.
Advanced Zone Trading: Flips and Cascading Orders
Once you master basic zone trading, the next level involves understanding how zones flip polarity and how multiple zones create cascading price action. A demand zone that gets broken doesn't disappear. It often becomes a supply zone on the next test from below. This polarity flip happens because traders who bought in that zone are now trapped. When price returns, they sell to break even, creating supply where demand used to exist.
Watch for these flip scenarios on the 4-hour chart. Mark your original demand zone in one color, then mark it in a different color once broken. When price rallies back to that former demand zone, you have a supply zone setup. The psychology is powerful because retail traders often think the old demand will hold again. Institutions know better and sell into that misplaced optimism.
Cascading zones create compression patterns that lead to explosive moves. When you have a supply zone at 1.1050, another at 1.1080, and a third at 1.1100, price hitting all three in sequence builds selling pressure. Each zone adds sell orders to the stack. The eventual breakdown from that compression often runs fast and far because three zones worth of selling hits the market.
Position sizing should reflect zone quality. A fresh daily demand zone with 4-hour confluence deserves 2% risk. A second touch of a 1-hour supply zone with no higher timeframe backing might only warrant 0.5% risk. Scaling your risk to probability keeps you in the game when lower-quality setups fail.
Integrating Zones Into Your Trading Plan
Zone trading isn't a standalone strategy. It's a framework for understanding where institutions operate. Your complete trading plan needs entry rules, exit rules, and position management guidelines that incorporate demand zone and supply zone analysis alongside your other tools.
Start each trading session by marking fresh zones on daily and 4-hour charts. This takes 10 minutes and provides your roadmap for the session. You know where price is likely to react before it gets there. When news moves price into one of your marked zones, you're not scrambling. You already have a plan.
Document every zone trade in your journal with screenshots showing the base, the departure, and your entry. Track which timeframes give you the best results. Many traders find 4-hour zones on the 15-minute execution timeframe provides the sweet spot between setup frequency and reliability. Your data might differ based on your trading session and pairs.
Review failed zones monthly to identify patterns in your mistakes. Did you trade against the higher timeframe trend? Did you ignore session timing? Were you entering zones without confirmation candles? The patterns in your losses teach you more than the patterns in your wins because they show you exactly which rules you're breaking.
Use tools that help you maintain consistency without overthinking each setup. PipTrend’s multi-timeframe approach aligns with zone trading methodology because both require seeing how different timeframes confirm each other before committing capital. When your indicator suite shows trend alignment and you have a fresh demand zone at the same level, you're stacking probabilities in your favor rather than hoping a single signal works.
Common Mistakes That Kill Zone Trading Accounts
The biggest error traders make with zones is treating them like exact price levels. A demand zone is a range. Buying at the top of the zone because price touched it leaves you with poor risk-to-reward. Wait for price to work into the lower portion of the zone before entering. That extra patience often means the difference between a 20-pip stop and an 8-pip stop.
Overtrading weak zones destroys more accounts than any other zone trading mistake. You marked 15 zones on your chart and feel compelled to trade each one. Most will fail because they lack the criteria outlined earlier. Trading one high-quality setup per day beats forcing five mediocre setups. Quality over quantity isn't a cliché in this context. It's survival.
Ignoring the larger trend context causes consistent losses even when your zones are valid. A demand zone in a strong downtrend might bounce, but that bounce is a selling opportunity for trend traders, not a reversal signal. Unless you see multiple higher timeframes showing exhaustion and reversal patterns, respect the trend and only trade zones that align with it.
Moving stops before they're hit is the fastest way to turn winning zone strategies into losing ones. You placed your stop below the demand zone because that's where the thesis invalidates. Price wicks down, almost hits your stop, and you move it lower thinking the zone still holds. Then price collapses through the entire zone and you lose three times what you planned. Effective supply and demand zone trading demands you respect your invalidation points without emotion.
Practical Application: Building Your Zone Trading Checklist
Create a pre-trade checklist that prevents you from taking impulsive zone trades. The checklist keeps you honest when a setup looks appealing but doesn't meet your criteria. Include these minimum requirements: fresh zone not previously tested, formed during high liquidity session, aligned with higher timeframe trend, clear departure leg, and confirmation candle within the zone.
Before entering any zone trade, verify at least four of those five criteria. If you can't check off four, the setup isn't ready. This systematic approach removes the guesswork and emotional decision-making that plague discretionary trading. You're following a process that accounts for the variables that actually impact success rates.
Time of day matters more than most traders acknowledge. A demand zone setup at 8 AM EST during London open has different characteristics than the same zone tested at 4 PM EST when liquidity is draining. Session awareness combined with zone analysis creates precision that single-method approaches can't match.
Backtest your zone strategy on 100 setups before trading it live. Mark zones on historical charts, note where you would have entered and exited, and calculate your win rate and average risk-to-reward. This practice builds pattern recognition and confidence. You'll also discover which pairs and timeframes work best with your zone trading approach. EURUSD zones behave differently than GBPJPY zones because of volatility and session participation differences.
Mastering demand zone and supply zone trading gives you the ability to see markets through the lens of institutional order flow rather than lagging retail indicators. When you combine proper zone identification with multi-timeframe analysis, session awareness, and disciplined execution, you're trading with the smart money instead of being their exit liquidity. PipTrend removes the confusion of conflicting signals so you can focus on high-probability zone setups with the confidence that comes from true trend clarity across all your trading timeframes.