
You keep hitting stop losses on trades that looked perfect. The trend seems obvious, you enter with confidence, then price reverses five minutes later and you're out with a loss. The problem isn't your discipline or risk management. You're reading the wrong signals. Most traders stack their charts with every indicator they've heard about, turning clean price action into a confusing mess of conflicting data. The truth is simpler: you need day trading indicators that answer specific questions about momentum, trend strength, and volatility. Not decorations that make you feel professional. Tools that give you an actual edge when seconds matter.
Why Most Traders Use Indicators Wrong
You load up your chart with MACD, RSI, Stochastic, Bollinger Bands, and three moving averages because you saw them in a YouTube video. Then you wait for all of them to agree before taking a trade. That trade never comes, or when it does, you're entering at the worst possible moment because lagging indicators finally caught up to price movement that already happened. This approach fails because you're treating indicators as magic signals instead of what they are: mathematical representations of price behavior that answer specific questions.
Each indicator serves one purpose. Moving averages show trend direction. Oscillators measure momentum extremes. Volatility bands identify expansion and contraction. When you understand what question you're asking, you can pick the right tool to answer it. You don't need ten indicators saying the same thing. You need three or four that tell you different aspects of what price is doing right now.
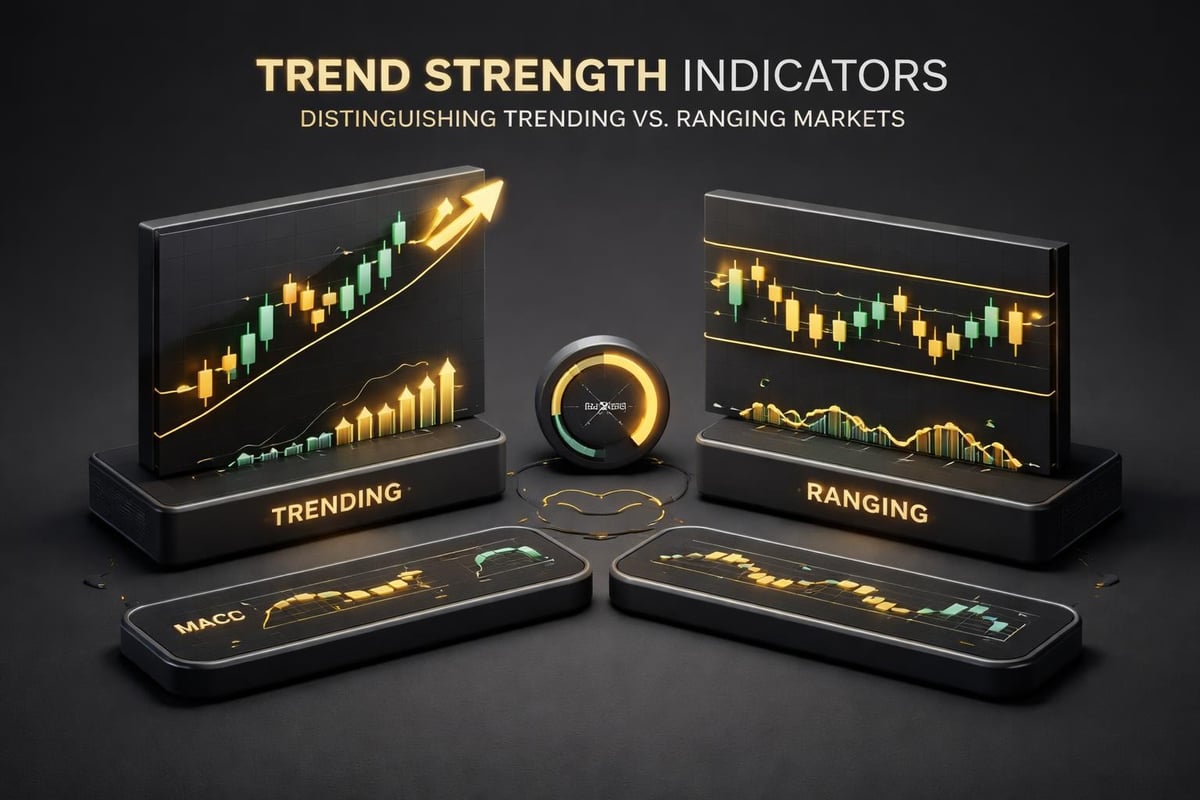
The Average Directional Movement Index measures trend strength, not direction. A reading above 25 tells you a trend exists. Below 20 means you're in a range. That's the question it answers: "Is this market trending strongly enough to justify a momentum trade?" Once you know that, you can choose your strategy accordingly. Trade breakouts in strong trends, mean reversion in weak ones.
Momentum Indicators That Show Exhaustion Before Reversals
Price makes a strong move up. You want in. But is momentum accelerating or fading? That's where oscillators earn their place on your chart. The Stochastic Oscillator compares current price to its range over a set period, typically 14 periods. When it crosses above 80, the market is overbought. Below 20, oversold. But here's what matters for day trading: you don't fade every overbought reading in an uptrend. You watch for divergence.
Price makes a higher high while Stochastic makes a lower high. That's bearish divergence, and it shows momentum fading even as price grinds higher. This setup gives you early warning of reversals before they show up in price action. On a 5-minute chart during the New York session, you'll see this pattern repeatedly at key resistance levels. The move might continue for another few bars, but the probability of reversal just increased significantly.
RSI works similarly but measures the magnitude of recent price changes. A setting of 14 periods is standard, but day traders often drop to 9 for more responsive signals. Above 70 is overbought, below 30 is oversold. The real edge comes from understanding that in strong trends, RSI can stay pegged above 70 for extended periods. You're not looking for an absolute reading. You're looking for failure to reach previous extremes, which signals weakening momentum even as trend continues.
Combine these tools with price action and you have a framework. Price breaks resistance, RSI hits 75, Stochastic crosses above 80. You don't short that. You wait. If price makes another leg up but RSI only reaches 68 and Stochastic fails to exceed its previous peak, now you have divergence. Now you have a reason to consider a counter-trend trade with a tight stop above the recent high.
Trend Strength Tools That Keep You Out of Chop
Choppy markets destroy day traders. You enter a breakout, price whipsaws, stops you out, then continues in your original direction without you. The problem is trading directional setups in directionless markets. You need day trading indicators that measure trend strength before you risk capital on momentum plays. ADX does this better than almost anything else, but most traders misunderstand what it's telling them.
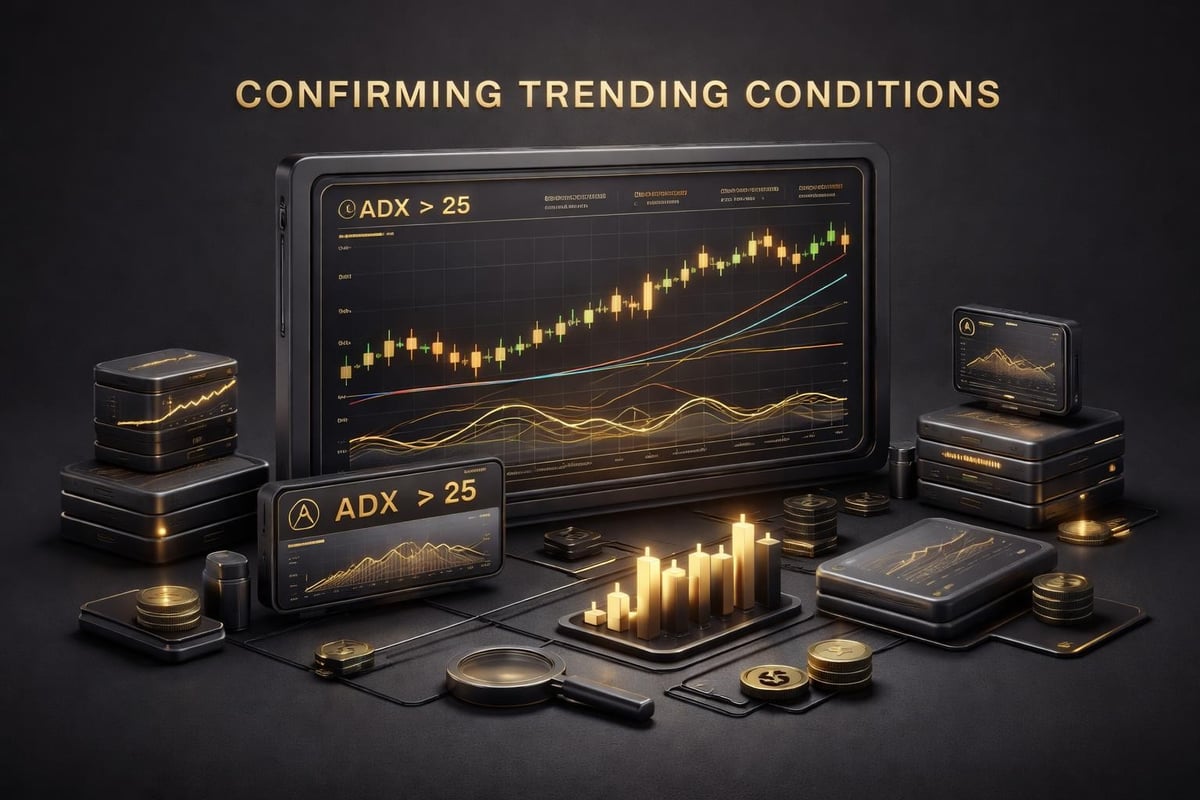
ADX above 25 means trend is strong enough to trade directionally. Between 20 and 25, trend is developing but not confirmed. Below 20, you're in a range and breakouts will likely fail. The indicator doesn't tell you whether trend is up or down, just whether one exists. You combine ADX with directional movement indicators (+DI and -DI) to get the full picture. When +DI is above -DI and ADX is rising above 25, you have a confirmed uptrend with strengthening momentum. That's your environment for long entries.
Here's the practical application on a 15-minute chart: you see price breaking above a consolidation zone at 9:45 AM EST. ADX is at 18. You wait. By 10:00 AM, price has pushed higher and ADX crosses above 25 with +DI clearly above -DI. Now you're looking for pullback entries in the direction of trend, not breakout entries that might fail in weak momentum conditions.
Moving averages add another layer of trend confirmation, but you need to use them differently than retail traders. Don't wait for crossovers. Use them as dynamic support and resistance. A 20-period EMA on a 5-minute chart shows you the short-term trend. Price staying above it means buyers are in control. When price touches the EMA during a trend and bounces, that's institutional money defending the level. That's your entry with a stop just below the moving average.
| Indicator | Best Timeframe | Key Signal | What It Tells You |
|---|---|---|---|
| ADX | 15-min, 1-hour | Above 25 | Strong enough trend to trade directionally |
| 20 EMA | 5-min, 15-min | Price bounce | Dynamic support/resistance in trends |
| 50 SMA | 1-hour, 4-hour | Price position | Longer-term trend bias |
| Stochastic | 5-min, 15-min | Divergence | Momentum exhaustion before reversal |
The Keltner Channel combines moving averages with ATR-based bands to show both trend and volatility. When price consistently touches or exceeds the upper channel, you have a strong uptrend with expanding volatility. When price stays inside the channels and ADX is below 20, you're in a range. Trade mean reversion, not breakouts. This combination prevents you from forcing directional trades in markets that aren't cooperating.
Volatility Measures That Time Your Entries
You've identified trend direction and confirmed momentum strength. Now you need to know whether volatility supports your trade. Low volatility means tight stops and small targets. High volatility means wider stops but bigger profit potential. ATR (Average True Range) answers this question with a single number: the average price movement over your chosen period, typically 14 bars.
On EUR/USD during London session open, ATR on a 15-minute chart might read 12 pips. That tells you the average move over the past 14 periods is 12 pips. Your stop loss needs to account for this normal volatility. Setting a 5-pip stop in a market moving 12 pips on average means you'll get stopped out by noise. A 1.5x ATR stop gives you 18 pips, enough room for the market to breathe while still maintaining reasonable risk.
But here's where day traders gain edge: ATR also shows you when volatility is expanding or contracting. After a period of low volatility (tight ATR readings), expansion is coming. That's when breakouts have the highest probability of follow-through. You can see this pattern clearly during the Asian session, when ATR typically contracts, then expands rapidly as London opens. If you're trading breakouts, you want that volatility expansion confirmed before entry.
Bollinger Bands visualize this volatility cycle. When bands squeeze together, volatility is contracting. When they expand rapidly, volatility is increasing. The "squeeze" setup works because markets alternate between low and high volatility. After bands compress to their tightest width in 20 or more periods, a significant move is imminent. You don't know direction yet, but you know the market is coiling for expansion. Combine this with trend indicators and you have a complete picture.
Price is in an uptrend, ADX is rising, Bollinger Bands just completed a squeeze, and ATR is beginning to expand. That's your highest-probability breakout setup. You're not guessing. You're stacking evidence that all points to the same outcome: directional movement with enough volatility to reach meaningful profit targets.
Volume and Market Sentiment Indicators for Context
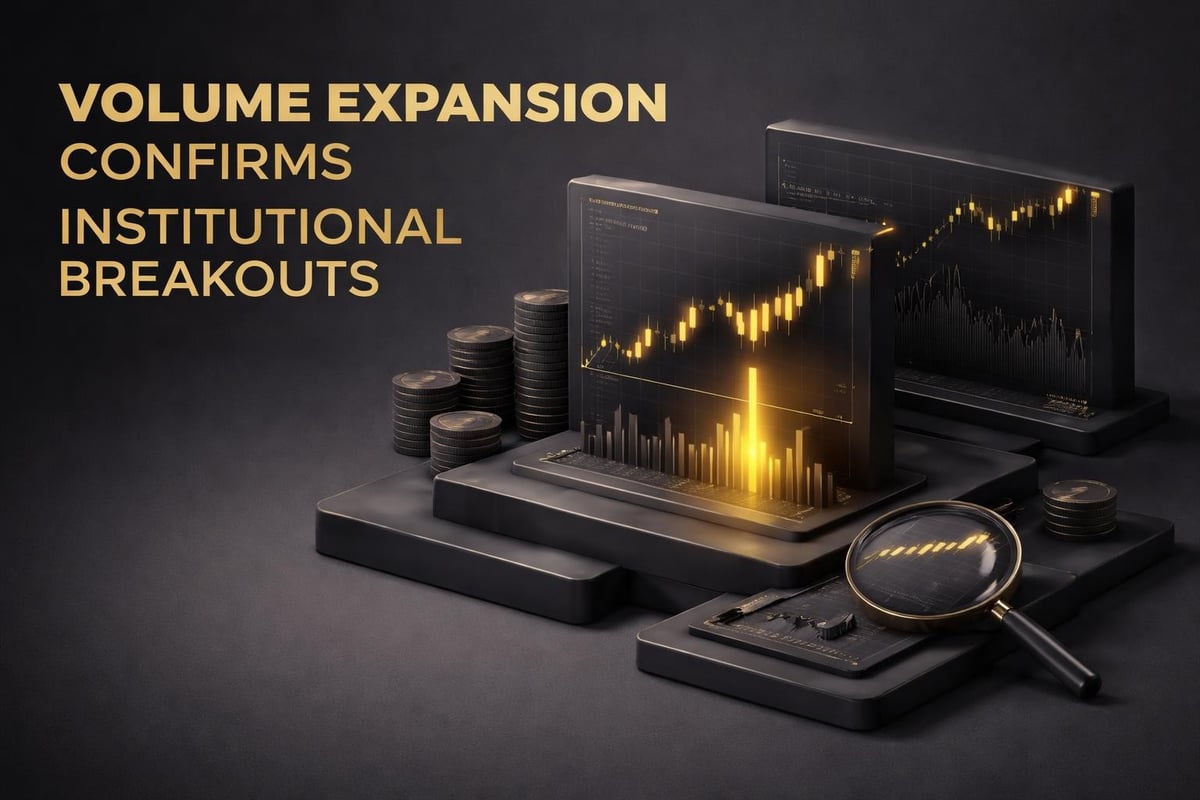
Price and volatility tell you what's happening. Volume tells you who's participating. Most retail platforms show volume bars below the chart, but few traders use them correctly. You're not looking for absolute volume. You're looking for relative volume compared to recent periods. When price breaks a key level on volume that's 150% or 200% of the recent average, institutions are participating. That breakout has conviction. When price breaks on weak volume, it's probably retail traders chasing and the move will fail.
The advance-decline line concept applies to broader markets but the principle works for day trading: you want confirmation from multiple participants, not just price movement. In forex, you can watch correlated pairs. If EUR/USD is rallying but EUR/GBP and EUR/JPY are flat, that's dollar weakness, not euro strength. The context changes your trade management. Dollar weakness can reverse quickly on news or data. Euro strength might persist longer.
The Smart Money Index tracks institutional behavior by giving more weight to late-day price action versus opening prices, based on the theory that professionals trade later while retail rushes in at the open. While you can't apply this directly to intraday forex, the concept matters: watch what happens during key institutional trading hours. The first 30 minutes of New York session (8:00-8:30 AM EST) often shows retail enthusiasm. The moves that develop between 10:00 AM and 2:00 PM tend to have institutional backing.
For practical application, mark the high and low of the first 30-minute candle after New York open. If price breaks above that high with increasing volume after 9:30 AM, you're likely seeing institutional confirmation of the early move. If price stays inside that range or breaks it on declining volume, the early move was retail noise and reversal is probable.
Building Your Indicator Stack for Different Market Conditions
You don't need the same day trading indicators for every market environment. Trending markets require different tools than ranging ones. High volatility sessions need different risk parameters than quiet Asian hours. Your indicator stack should adapt to conditions, not remain static regardless of what the market is doing. Here's how to think about it practically.
Trending Market Stack: When ADX is above 25 and price respects moving averages, you want momentum confirmation and trend-following tools. Use 20 EMA for dynamic support/resistance, RSI for divergence warnings (not absolute levels), and ATR for stop placement. You're riding the trend until momentum indicators show exhaustion. Your entries come on pullbacks to the EMA when RSI bounces from oversold (in uptrends) or overbought (in downtrends). Your exits come when divergence appears and price fails to make new extremes.
Ranging Market Stack: When ADX drops below 20 and price oscillates without clear direction, switch to mean reversion tools. Bollinger Bands show the edges of the range. Stochastic helps time entries when price reaches those edges and momentum reverses. You're selling resistance, buying support, and taking profits quickly because trends don't develop in these conditions. Your risk-reward might only be 1:1, but your win rate should exceed 60% if you're patient with entries.
Breakout Stack: When volatility is contracting (Bollinger Band squeeze, declining ATR readings) and price forms a tight consolidation, you're preparing for expansion. Use ATR to measure the squeeze, volume to confirm the breakout, and ADX to verify that trend strength is developing. You enter on the first pullback after breakout confirmation, not on the breakout candle itself. This gives you better pricing and proves that the breakout has holding power.
| Market Condition | Primary Indicator | Confirmation Tool | Entry Trigger |
|---|---|---|---|
| Strong Uptrend | 20 EMA / ADX >25 | RSI divergence | Pullback to EMA with bounce |
| Strong Downtrend | 20 EMA / ADX >25 | RSI divergence | Rally to EMA with rejection |
| Range-Bound | Bollinger Bands | Stochastic | Extreme readings at band edges |
| Pre-Breakout | ATR / Band Squeeze | Volume expansion | First pullback after break |
The mistake most traders make is using trending indicators in ranging markets and mean-reversion tools in trending markets. ADX solves this by telling you which environment you're in before you choose your strategy. When you see ADX climbing through 20 toward 25, you're transitioning from range to trend. That's when you stop fading moves and start following them. When ADX falls from 30 back through 25, the trend is weakening and you should tighten profit targets or exit entirely.
Real-Time Application on Multiple Timeframes
Single-timeframe analysis leaves money on the table and increases losing trades. You need context from higher timeframes to know whether your 5-minute setup aligns with the bigger picture or fights against it. The process is straightforward: start with the 1-hour chart to identify trend and key levels, drop to 15-minute for entry timing, then use 5-minute for precise execution. Your day trading indicators work the same way on each timeframe, but they answer different questions.
On the 1-hour chart, you're asking whether the daily bias is bullish or bearish. Is price above or below the 200 SMA? Is the 20 EMA sloping up or down? Is ADX showing a strong trend or weak chop? You're not taking trades from this timeframe. You're establishing context. If the 1-hour shows a clear uptrend with ADX at 32 and price well above the 20 EMA, you know your bias for the session: look for long setups, avoid shorts unless you see exceptional reversal signals.
Drop to 15-minute and you're looking for structure. Where are the swing highs and lows? Where did price consolidate overnight? These levels become your support and resistance zones. When price approaches these levels and your indicators align (RSI showing momentum in trend direction, ATR confirming volatility, volume increasing), you're close to an entry opportunity.
The 5-minute chart is execution. You wait for price to pull back to your identified level (maybe a previous consolidation zone that aligns with the 15-minute 20 EMA). You watch for Stochastic to reach oversold and turn up. You verify that volume is present and ATR supports the move. Then you enter with a stop below the recent swing low and a target at the next resistance level identified on your 15-minute chart.
This multi-timeframe approach prevents you from taking perfect 5-minute setups that fight the 1-hour trend. It also helps you avoid weak setups that look good in isolation but lack higher-timeframe support. When all three timeframes align with your indicators confirming the same story, you have the highest-probability trades of your session. These are the setups worth risking capital on.
Common Indicator Mistakes That Kill Accounts
You've probably made every mistake in this section. Most traders have. The difference between consistent profits and blown accounts often comes down to fixing these specific errors in how you interpret day trading indicators. First, stop treating indicators as entry signals. They're not. They're confirmation tools for setups you identified through price action, support and resistance, and market structure. An RSI oversold reading isn't a buy signal. It's confirmation that momentum has reached an extreme, which might support a buy if price is at significant support and higher timeframes show uptrend bias.
Second, quit waiting for "perfect" setups where every indicator aligns. You'll miss most moves waiting for six indicators to agree. You need three things: trend direction (from ADX and moving averages), momentum confirmation (from RSI or Stochastic), and volatility support (from ATR or Bollinger Bands). If those three elements align with your price action setup, that's enough. Adding more indicators doesn't increase your edge. It increases analysis paralysis.
Third, understand indicator lag. Moving averages and MACD are lagging indicators built from historical data. They tell you what already happened. By the time they signal a trend change, price has already moved significantly. You use them for confirmation, not prediction. Leading indicators like Stochastic and RSI can show momentum shifts before price confirms them, but they're also prone to false signals. The solution isn't choosing one type over the other. It's using both appropriately: lagging indicators for trend context, leading indicators for entry timing.
Fourth, stop changing settings constantly. Searching for the "perfect" RSI period or moving average length is procrastination disguised as optimization. Standard settings (14 for RSI, 20 and 50 for EMAs, 14 for ATR) exist because they work across most timeframes and markets. If you're going to customize, test thoroughly and understand why you're making changes. Dropping RSI from 14 to 9 makes it more responsive but increases false signals. That might work on a 5-minute chart during high volatility sessions. It will destroy your account during low volatility ranges.
How Professional Setups Stack Indicators With Price Action
The indicators professionals use don't differ much from what you have access to. The difference is how they're applied. Professionals don't wait for indicators to tell them what to do. They identify key price levels where institutional money operates, then use indicators to time entries and confirm that their read on market structure is correct. Here's what that looks like in practice during a live trading session.
You identify a key level: yesterday's high at 1.0850 on EUR/USD. Price has tested it twice overnight during Asian session and rejected both times. That's your level. Now you wait for New York session to open and watch how price behaves. At 8:30 AM EST, price pushes toward 1.0850 again. You check your indicators: ADX on the 15-minute is at 28 (strong trend), RSI is approaching 70 (momentum present but nearing extreme), ATR is expanding (volatility supporting movement), and volume is increasing above recent averages.
Price touches 1.0850 and rejects with a strong bearish candle. RSI immediately shows bearish divergence (price made an equal high, RSI made a lower high). Stochastic crosses down from above 80. You have your setup: short from 1.0845 with a stop at 1.0860 (15 pips, about 1.5x current ATR) and a target at 1.0820 (the previous swing low on 15-minute chart, giving you a 2:1 reward-risk). The trade isn't based on indicators. It's based on price rejecting a key level. Indicators confirmed that momentum was exhausted, trend strength supported continuation lower, and volatility was sufficient to reach your target.
That's the difference. Indicators enhance your price action reading. They don't replace it. When you see traders with consistent results, they're reading market structure first and using day trading indicators as filters to eliminate low-probability setups. The setup comes from levels where institutions operate: previous day high/low, session open, overnight consolidation ranges, significant round numbers. Indicators tell you whether conditions support your trade or suggest waiting for better timing.
You can learn more about common day trading indicators and how they're applied across different strategies, but the core principle remains the same: indicators serve your analysis, not the other way around. When you build your process around price action and market structure first, then layer indicators for confirmation and timing, you stop second-guessing every trade and start executing with conviction.
The indicators on your charts don't need to be complicated or exotic to produce consistent results. You need the right tools answering the right questions at the right time: trend strength before you trade directionally, momentum confirmation before you enter, and volatility measures to set intelligent stops and targets. When you stop collecting indicators and start using fewer tools with deeper understanding, your results improve immediately. PipTrend eliminates the guesswork by giving you pre-filtered signals that stack multiple confirmation factors into clear buy and sell alerts, so you can focus on execution instead of analysis paralysis. Your charts can tell you exactly when to trade. You just need the right framework to read them.