
Most traders treat the commodity channel index cci indicator like a simple overbought-oversold tool and wonder why their signals fail. You enter when CCI crosses above +100, expecting a strong trend, only to watch price reverse two bars later. The real power of this indicator isn't in the levels everyone watches. It's in understanding what those levels actually measure and how price behaves around statistical extremes.
The commodity channel index cci indicator calculates how far price has moved from its statistical average over a specific period. Unlike RSI or Stochastic that measure momentum within a bounded range, CCI operates in unbounded territory. The indicator moves above and below zero without artificial limits, which means those extreme readings above +100 or below -100 represent genuine statistical outliers. When you see CCI at +200, price isn't just overbought. It's moving at a rate that occurs less than 5% of the time based on recent volatility. That's the difference between noise and actionable information.
Understanding the Statistical Foundation
The standard setting for the commodity channel index cci indicator is 20 periods, and this number matters more than you think. Donald Lambert designed CCI to identify cyclical turns in commodities, and 20 periods represented roughly one month of trading data. You can adjust this period to match the cycle you're trading, but understand what you're measuring. A 14-period CCI reacts faster to price changes and generates more signals, while a 50-period CCI smooths out short-term volatility and focuses on major swings.
The calculation divides the difference between typical price and its simple moving average by the mean absolute deviation, then multiplies by a constant of 0.015. This constant ensures approximately 70-80% of CCI values fall between -100 and +100 under normal conditions. When price breaks outside this range, you're witnessing statistically significant momentum that deserves attention. The mean absolute deviation component makes CCI self-adjusting to volatility, unlike fixed percentage bands that ignore changing market conditions.
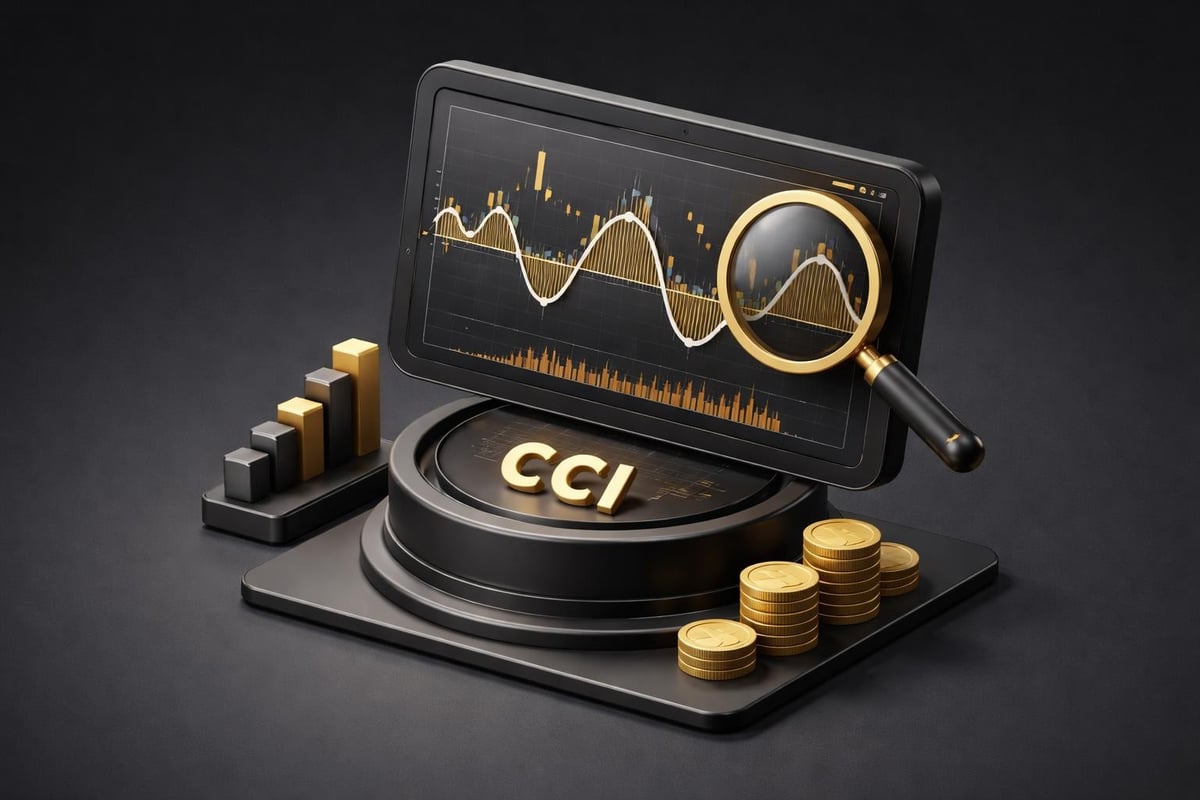
Most platforms display CCI as a single oscillating line with horizontal reference lines at +100, 0, and -100. You'll see the line cross these levels frequently on shorter timeframes like the 5-minute or 15-minute chart. The key is distinguishing between noise crossings and momentum-confirming crossings. A quick spike above +100 that immediately reverses tells you nothing useful. A sustained move above +100 with rising highs on each pullback tells you strong directional pressure exists.
Trading CCI Signal Combinations
The basic crossover strategy fails because it ignores context. You don't trade CCI crossing above +100 in isolation. You trade it when price structure confirms the momentum signal. Watch for CCI to cross above +100 while price breaks above a consolidation range or recent swing high. This combination means momentum is accelerating and price structure is resolving in the same direction. Your entry comes on the pullback after the initial thrust, when CCI dips back toward +100 but holds above zero. This gives you a better entry price with reduced risk compared to chasing the initial breakout.
The reverse applies for short setups. CCI crosses below -100 while price breaks below support or a key swing low. Wait for the first bounce attempt, where CCI rallies back toward -100 but stays below zero. This bounce represents weak hands trying to pick a bottom before the real selling resumes. Your entry comes when price rolls over again and CCI confirms with a fresh lower low. Stop placement goes just above the bounce high with a minimum 2:1 reward-to-risk ratio targeting the next major support level.
Divergence patterns on the commodity channel index cci indicator provide some of the highest probability reversal signals when you apply them correctly. Regular bearish divergence forms when price makes a higher high but CCI makes a lower high. This pattern works best on the 1-hour and 4-hour timeframes where you have enough data to identify genuine trends. You need at least two clear peaks on both price and CCI to validate the divergence. Hidden divergence, where price makes a higher low but CCI makes a lower low during an uptrend, signals trend continuation rather than reversal and offers excellent re-entry opportunities.
Timeframe-Specific Applications
On the daily timeframe, the commodity channel index cci indicator excels at identifying major trend exhaustion and potential reversals. CCI readings above +200 or below -200 occur roughly 2-3 times per year on most actively traded pairs and stocks. These extreme readings don't signal immediate reversals, but they tell you to tighten stops on existing positions and watch for reversal patterns. Price often extends another 3-7 days after hitting these extremes before turning. Your edge comes from recognizing when CCI starts forming lower highs from extreme positive territory or higher lows from extreme negative territory while price continues grinding.
The 4-hour chart offers the sweet spot for swing traders using CCI. You get enough data points to smooth out intraday noise while maintaining sensitivity to multi-day moves. A CCI cross above +100 on the 4-hour chart, confirmed by a bullish engulfing pattern or demand zone bounce, provides entries with typical hold times of 2-5 days. Set your stop below the swing low that triggered the CCI signal and target previous resistance levels or a measured move equal to the consolidation range that preceded the breakout.
Intraday traders operating on 15-minute or 30-minute charts need additional filters with the commodity channel index cci indicator because these timeframes generate excessive false signals. Combine CCI with session-specific analysis. The most reliable CCI signals on the 15-minute chart occur during the London open (3:00-6:00 AM ET) and New York open (8:00-11:00 AM ET) when institutional volume drives genuine momentum. Outside these windows, CCI crossovers on short timeframes often represent range-bound chop rather than trending opportunity. The characteristics of the Commodity Channel Index make it particularly sensitive to price acceleration, which makes session timing critical for short-term applications.
| Timeframe | Optimal Period Setting | Key Signal | Typical Hold Time | Best Market Condition |
|---|---|---|---|---|
| Daily | 20 | Extreme readings +/- 200 | 1-3 weeks | Major trend changes |
| 4-Hour | 20 | Divergence + structure break | 2-5 days | Swing trends |
| 1-Hour | 14 | Zero-line rejection | 4-18 hours | Strong intraday trends |
| 15-Minute | 14 | +100/-100 with session confluence | 1-4 hours | London/NY opens |
Advanced CCI Pattern Recognition
The zero-line strategy transforms how you use the commodity channel index cci indicator for trend trading. Instead of treating zero as a meaningless midpoint, recognize it as dynamic support and resistance that reveals trend strength. During strong uptrends, CCI pulls back to zero and bounces without crossing below it. Each bounce represents a consolidation in price where weak hands exit and smart money accumulates before the next leg higher. Your entries come when CCI touches zero from above and starts curling higher while price forms a tight consolidation or bull flag pattern.
Failed zero-line breaks signal powerful continuation moves. Watch for CCI to push below zero during an uptrend, spending only 1-3 bars in negative territory before reversing back above zero. This brief penetration shakes out breakeven traders and stop-runs obvious support before momentum resumes. The stronger the trend, the less time CCI spends below zero during pullbacks. If CCI drops below zero and stays there for 5+ consecutive bars, the trend is either transitioning to range conditions or preparing to reverse. This distinction matters for position management.

Overbought-oversold mean reversion trades work differently with CCI compared to bounded oscillators. When CCI reaches -100 in a ranging market, you're identifying a statistical extreme that typically reverts to mean. But CCI at -100 in a strong downtrend simply confirms powerful momentum that's likely to continue. The context separator is price structure. If price is making lower lows and lower highs, CCI readings below -100 are trend-following signals, not reversal signals. You only trade mean reversion when price shows range characteristics with defined support and resistance containing recent swings. The Commodity Channel Index calculation and interpretation clarifies how the indicator adapts to different market conditions.
Multiple Timeframe CCI Alignment
Your highest conviction trades occur when the commodity channel index cci indicator aligns across multiple timeframes pointing in the same direction. Start with the daily timeframe to identify the dominant trend. If daily CCI is above zero and rising, you're in an uptrend environment. Drop down to the 4-hour chart and wait for CCI to pull back toward zero or briefly below it. This pullback on the lower timeframe represents a minor correction within the larger uptrend visible on the daily chart.
Your entry signal comes when the 4-hour CCI curls back above zero while the daily CCI remains positive. This alignment means short-term momentum is rejoining the established trend direction. Place your stop below the swing low that formed during the pullback with a target at the previous daily high or a measured extension. The typical reward-to-risk ratio on these aligned setups ranges from 3:1 to 5:1 because you're catching early entries in continuation moves rather than chasing late-stage breakouts.
Avoid the trap of waiting for perfect alignment across every timeframe you monitor. If you're watching daily, 4-hour, 1-hour, and 15-minute charts, requiring all four CCI readings to align creates analysis paralysis and missed opportunities. Focus on two-timeframe alignment where your trade timeframe and one higher timeframe confirm each other. A 4-hour trader needs daily alignment. A 15-minute trader needs 1-hour alignment. This two-tier approach provides sufficient confirmation without overthinking.
Combining CCI with Price Action
The commodity channel index cci indicator reaches its full potential when you integrate it with specific price action patterns rather than treating it as a standalone system. Demand and supply zones mark price levels where institutional orders previously created imbalance and likely remain active. When price returns to a daily demand zone and CCI simultaneously reaches oversold territory below -100, you've identified statistical and structural convergence. The zone provides your entry area and stop placement below the zone, while CCI confirms that momentum has reached an extreme that typically precedes reversals.
Breakout traders face the constant challenge of distinguishing genuine breakouts from false breaks. CCI adds the momentum confirmation layer that improves your hit rate. Price breaking above resistance means nothing if momentum isn't expanding. Watch CCI as price approaches resistance. If CCI is already at +150 or higher before the breakout occurs, momentum is likely exhausted and the break will fail. The strongest breakouts happen when CCI sits between +50 and +100 as price reaches resistance, then accelerates above +150 as the break occurs. This pattern shows momentum building but not yet overextended, which creates room for follow-through.
The application of CCI in different market cycles demonstrates how effective the indicator becomes when adapted to specific asset characteristics. Commodities with strong seasonal patterns show more reliable CCI extremes than assets with erratic volatility. Adjust your extreme thresholds based on the instrument you're trading. Volatile cryptocurrency pairs might require +/- 150 as your extreme thresholds while stable forex majors work better with standard +/- 100 levels.
Managing Trades with CCI
Position management separates profitable CCI traders from those who give back their gains. Your initial stop placement comes from price structure-below the swing low for longs, above the swing high for shorts. But your profit-taking strategy should incorporate CCI behavior. When your trade moves in your favor and CCI reaches extreme territory above +200 or below -200, move your stop to breakeven immediately. These extreme readings signal that momentum has reached statistical outliers that rarely sustain for long.
Partial profit-taking works well with CCI milestone levels. Take 30-40% of your position off when CCI first reaches +100 in the direction of your trade. This books partial profit during the initial momentum thrust. Hold the remainder for the potential extended move, moving your stop to breakeven on the remaining position. If CCI continues to +200, take another 30-40% and trail your stop using the swing lows that form during the move. This scaled approach captures profits during the high-probability initial move while leaving room for the occasional runner that delivers outsized gains.
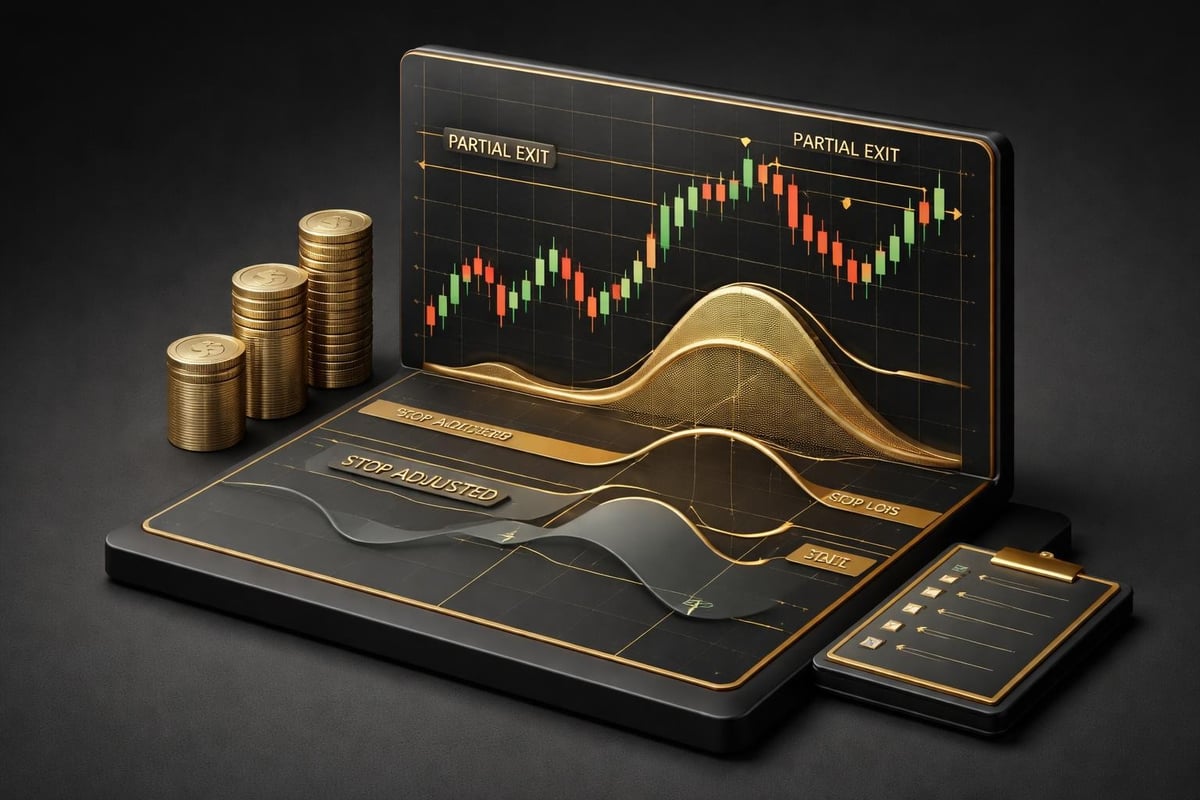
Trailing stops based on CCI zero-line behavior protect profits during strong trends better than arbitrary percentage stops. During an uptrend position, hold as long as CCI holds above zero on pullbacks. When CCI crosses below zero and closes there for two consecutive 4-hour bars, exit the position. This approach lets you ride extended trends while using momentum deterioration rather than arbitrary price levels to signal the exit. The detailed CCI interpretation guide explains how zero-line dynamics reflect underlying trend health.
CCI Indicator Modifications and Settings
The standard 20-period setting works well for swing trading, but adjusting the period based on your trading style and market volatility improves results. Aggressive day traders benefit from a 14-period CCI that generates faster signals and responds quickly to momentum shifts. This faster setting produces more whipsaws in choppy conditions but catches intraday trends earlier when they develop. Conservative position traders can extend to 30 or 40 periods for a smoother indicator that filters out short-term noise and focuses on weekly and monthly trends.
Testing different period settings on your specific instruments reveals optimal parameters. Run a backtest comparing 14, 20, and 30-period CCI on your primary trading pairs over the past 12 months. Count the number of profitable signals versus false signals at each setting during both trending and ranging periods. Most traders discover that faster settings work better in low-volatility trending environments while slower settings perform better in high-volatility choppy environments. You can switch between two CCI settings based on current volatility readings from ATR or Bollinger Band width.
Some traders modify the +100/-100 thresholds to +150/-150 or +200/-200 depending on asset volatility. Higher thresholds reduce signal frequency but increase quality by identifying only the most extreme momentum conditions. This modification works particularly well on cryptocurrency pairs and small-cap stocks that exhibit higher baseline volatility than forex majors or large-cap equities. The technical guide to CCI application covers various threshold adjustments for different asset classes.
Common CCI Mistakes to Avoid
Trading every CCI crossover above +100 or below -100 guarantees losses because these crossovers occur too frequently without regard to price structure or trend context. The commodity channel index cci indicator generates dozens of extreme readings per month on active instruments. Only a small percentage of these readings lead to tradeable moves. Your job is filtering for the high-probability setups by requiring additional confirmation from price patterns, support/resistance levels, or multiple timeframe alignment.
Ignoring trend direction when taking CCI signals creates unnecessary losses. A CCI reading of -150 in a strong uptrend doesn't signal a short opportunity. It signals a deep pullback within the trend that offers a potential long entry once momentum stabilizes. Always check the higher timeframe trend before trading CCI signals on your entry timeframe. Trade with the trend using CCI to time entries, or trade against the trend only when you see clear reversal patterns and divergence on multiple timeframes converging.
Misunderstanding that CCI can stay extreme longer than you can stay solvent causes premature entries and blown accounts. Just because CCI reaches +200 doesn't mean price immediately reverses. Strong trends push CCI to extreme levels and keep it there for days or weeks. The comprehensive CCI overview explains how the indicator behaves during extended trending periods. Wait for CCI to roll over and start forming lower highs from extreme territory before taking reversal trades. The peak CCI reading means nothing without confirming price action that shows momentum actually fading.
Building a Complete CCI Trading System
A robust trading system using the commodity channel index cci indicator starts with trend identification on the daily timeframe. Mark when daily CCI crosses above or below zero and stays there. This establishes your directional bias. Above zero means you look for long setups only. Below zero means you look for short setups only. This simple filter eliminates the majority of losing trades that come from fighting the dominant trend.
Your entry triggers come from the 4-hour or 1-hour timeframe depending on your preferred hold time. On the 4-hour chart, wait for CCI to pull back toward zero during your established trend direction. When CCI touches zero and curls back in the trend direction while price forms a bullish pattern (for uptrends) or bearish pattern (for downtrends), you have your entry signal. Enter on the next bar after confirmation with a stop below the pullback low for longs or above the pullback high for shorts.
Position sizing should account for the typical volatility and distance to your stop. Risk no more than 1-2% of your trading capital on any single CCI signal. Calculate your position size by dividing your dollar risk amount by the pip or point distance from entry to stop. This consistent risk management prevents any single losing trade from significantly impacting your account even during drawdown periods when CCI signals underperform.
| System Component | Specification | Purpose |
|---|---|---|
| Trend Filter | Daily CCI above/below zero | Directional bias |
| Entry Timeframe | 4-hour chart | Signal generation |
| Entry Signal | CCI zero-line bounce + price pattern | Precise timing |
| Stop Placement | Below pullback swing | Risk definition |
| Initial Target | 2:1 reward-to-risk minimum | Positive expectancy |
| Trailing Stop | CCI closes below zero (2 bars) | Profit protection |
Risk management extends beyond position sizing to trade frequency and daily loss limits. The commodity channel index cci indicator can generate clusters of losing signals during transitional periods when markets shift from trending to ranging conditions. Set a daily maximum loss limit of 3-4% of your account. After hitting this limit, stop trading for the day regardless of what signals appear. This discipline prevents revenge trading and emotional decision-making that compounds losses. The practical applications of CCI include specific risk parameters successful traders implement.
Performance Tracking and Optimization
Track every trade you take using the commodity channel index cci indicator in a detailed journal. Record the timeframe, CCI reading at entry, price pattern that confirmed the signal, stop distance, initial target, and actual outcome. After 30 trades, analyze your results to identify patterns. You might discover that CCI signals during London session hours produce better results than those during Asian session hours. Or that divergence trades outperform crossover trades in your hands.
Calculate your win rate and average reward-to-risk ratio separately for different CCI signal types. Break down results by trend-following signals versus counter-trend reversal signals. Most traders find their edge lies in one category while the other drags down overall performance. Once you identify your strength, focus exclusively on those signal types and eliminate the underperforming category from your playbook. A 45% win rate with a 3:1 average reward-to-risk produces consistent profits, while a 60% win rate with a 1:1 average reward-to-risk leads to breakeven results after commissions.
Optimization doesn't mean constantly adjusting your CCI period settings chasing perfect parameters. It means identifying market conditions where your CCI system performs best and scaling up during those periods while scaling down or sitting out during unfavorable conditions. If your backtesting shows CCI signals perform poorly during low ATR environments with choppy range-bound action, reduce your position size by 50% or skip trades entirely when ATR drops below its 20-day average. This adaptive approach improves overall results without changing your core strategy.
The difference between profitable CCI trading and frustration comes down to confirmation and context. The indicator itself simply measures statistical deviation. Your skill in interpreting that deviation within the framework of trend, structure, and timeframe alignment determines your success. Every losing trade teaches you something about market conditions where CCI signals fail. Every winning trade reinforces the patterns and contexts where CCI excels. This feedback loop, tracked and analyzed over hundreds of trades, builds the experience that transforms the commodity channel index cci indicator from a confusing oscillator into a reliable edge.
The commodity channel index cci indicator works when you stop treating it as a magic signal generator and start using it as a momentum confirmation tool within a complete trading framework. Combining CCI with trend analysis, price structure, and proper timeframe selection creates high-probability setups with defined risk. If you're ready to trade with genuine conviction backed by multi-timeframe clarity and filtered signals that cut through market noise, PipTrend eliminates the guesswork and shows you exactly when momentum aligns with opportunity across all the timeframes that matter.