On this page
Why this question has no yes or no answer
A signal service with a 90% win rate can drain your account faster than one that loses most of its trades.
That sounds backwards, but it’s simple arithmetic.
And it’s the reason “are trading signals worth it” can’t be answered with a blanket yes or no.
A signal’s value comes from one thing: verified expectancy after costs.
That means the average amount you actually keep per trade once spreads, commissions, slippage, and subscription fees are paid. Marketing claims, Telegram screenshots, and cherry-picked win streaks tell you almost nothing about that number.
So instead of a verdict, this guide gives you a cost-benefit framework built on five tests:
Performance data (is there a verifiable record including losses?), cost math (what must the service earn just for you to break even?), execution quality (can you get the same fills the provider claims?), risk control (are stops, sizing, and drawdowns defined?), and consistency fit (can you follow the rules every single time?).
Most reviews you’ll find fall into two camps.
One promotes a specific provider with an affiliate link. The other dismisses every signal as a scam.
Neither camp helps you. What helps is a repeatable way to test any service objectively, with your broker, your costs, and your account size.
That’s what the rest of this article delivers.
By the end, you’ll be able to calculate whether a given service can realistically pay for itself as of 2026, before you risk a single dollar.
What actually counts as a trading signal
Ask ten traders what a “signal” is and you’ll get ten different products. Some mean a one-line “BUY EURUSD” message. Others mean a fully documented system with entries, stops, and exit rules.
The difference between those two is often the difference between profit and loss.
A raw alert vs a complete trading system
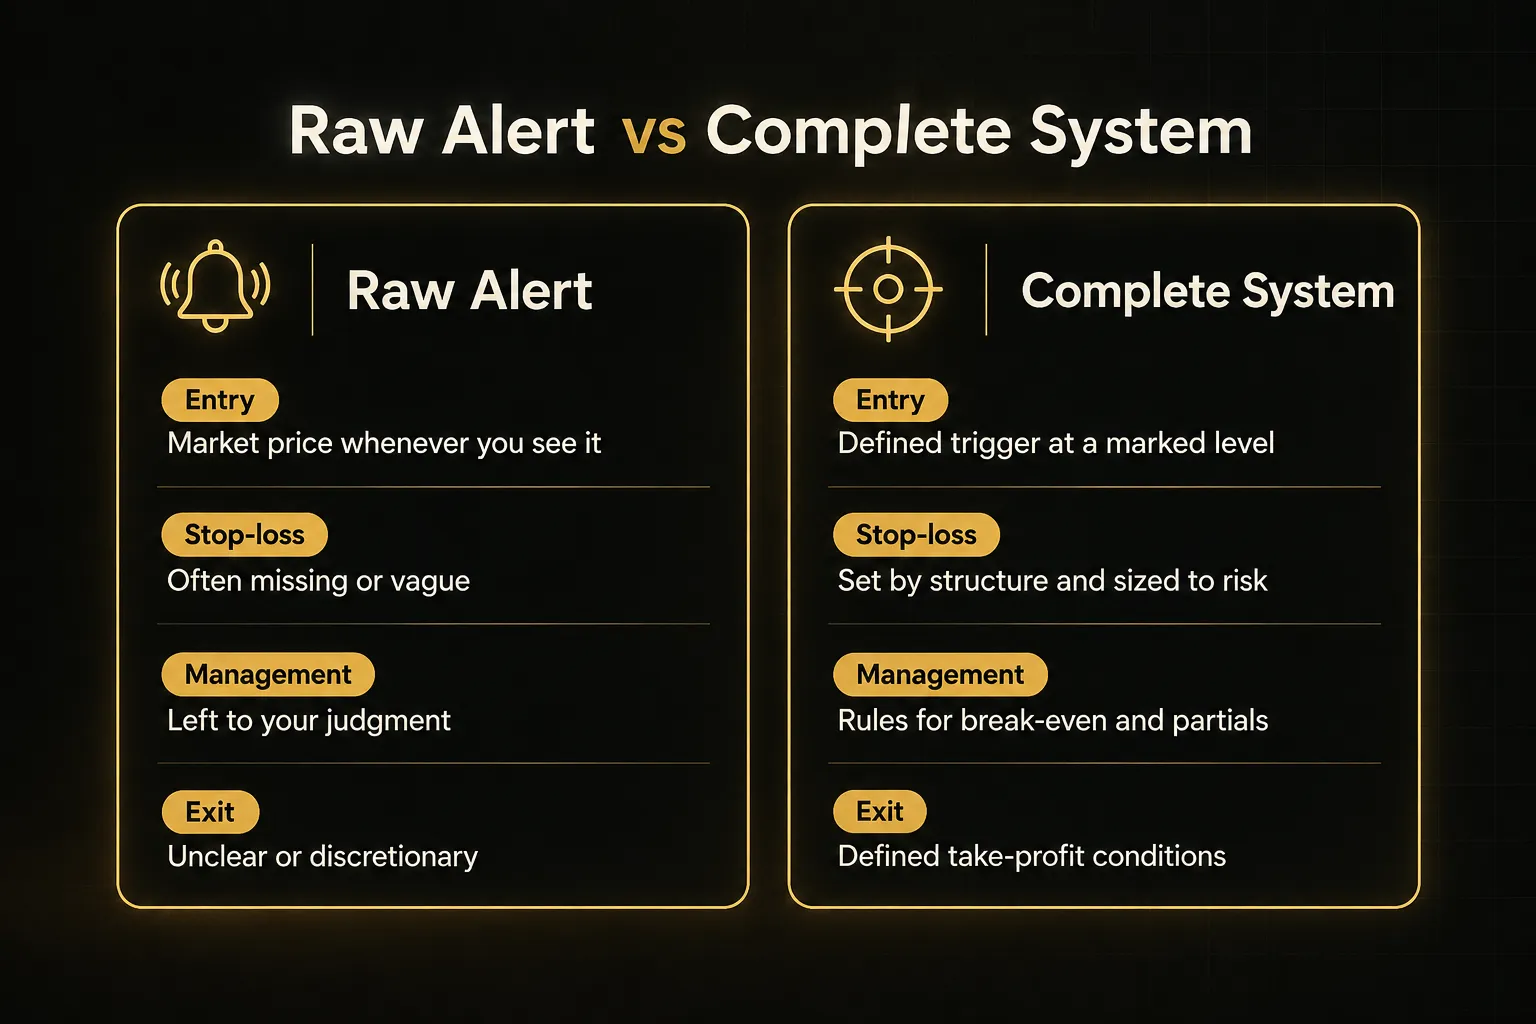
A raw alert tells you direction and little else. “Gold long” or “Sell GBPJPY now” sounds actionable, but it leaves the hardest questions completely open.
Where exactly do you enter? Where does the stop go, and how large should it be? Do you take profit at a fixed target, trail the stop, or scale out?
Those decisions are where most money is made or lost, not in the direction call itself.
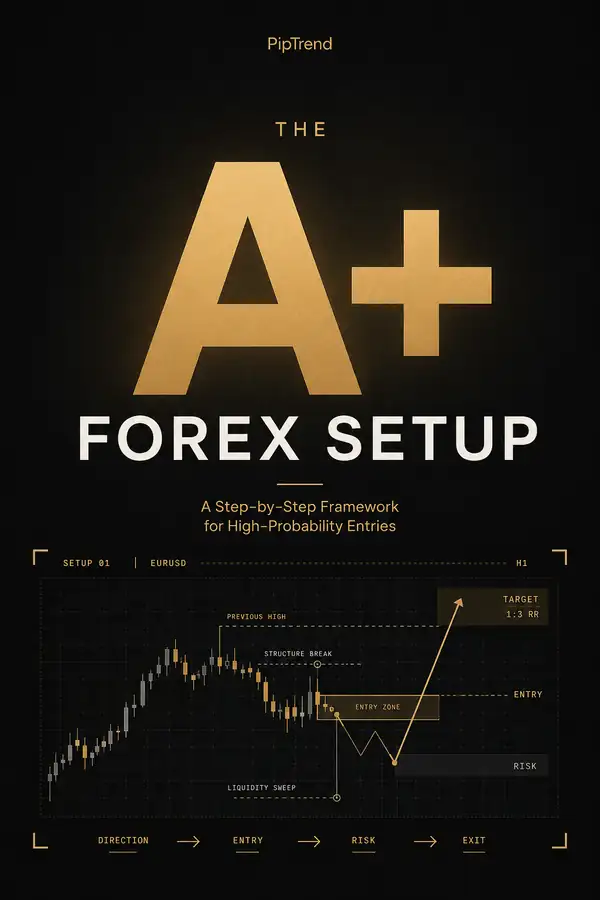
A rules-based system answers all of them. It specifies five components:
- Direction: whether you’re looking for longs or shorts.
- Entry trigger: the precise price or condition that opens the trade.
- Stop placement: where the trade is invalidated, which drives position sizing.
- Trade management: when to move to break-even, partial closes, or trailing rules.
- Exit: defined take-profit levels or conditions that close the position.
Think of it like a recipe. A raw alert says “make bread.” A system lists the ingredients, the oven temperature, and when to take it out.
Two people following the recipe get similar loaves. Two people following “make bread” get wildly different results.
PipTrend is a practical example of the system approach.
The signal itself gives direction only. Entry comes from marked liquidity levels on the chart, and a multi-timeframe table governs trade management, so the trader knows what to do after the order is filled rather than guessing.
Signals, copy trading, and stock tips aren’t the same
Competitors often lump these together. They carry very different risk and regulatory profiles.
Indicator alerts are software tools.
They generate conditions on a chart, and you decide whether to act. Because they aren’t personalized advice, they typically sit outside investment-advice licensing, which puts the responsibility for every trade squarely on you.
Social-media tips are the least accountable category.
Regulators including the UK’s FCA and the US SEC have stepped up action against unlicensed “finfluencers,” but plenty of anonymous channels still post calls with no track record and no disclosure of whether the poster even takes the trades.
Copy trading automatically mirrors another trader’s positions in your account. In the EU and UK, regulators have treated some copy trading as a form of portfolio management, so the platform usually needs authorization.
Your fills, however, can still differ from the leader’s.
Managed accounts hand trading authority to a licensed manager under a formal agreement.
That’s the most regulated option, and also the one where you learn the least.
Know which product you’re buying.
The testing method in this article works best on alerts and rules-based systems, where you control execution.
The math that decides if a signal pays off
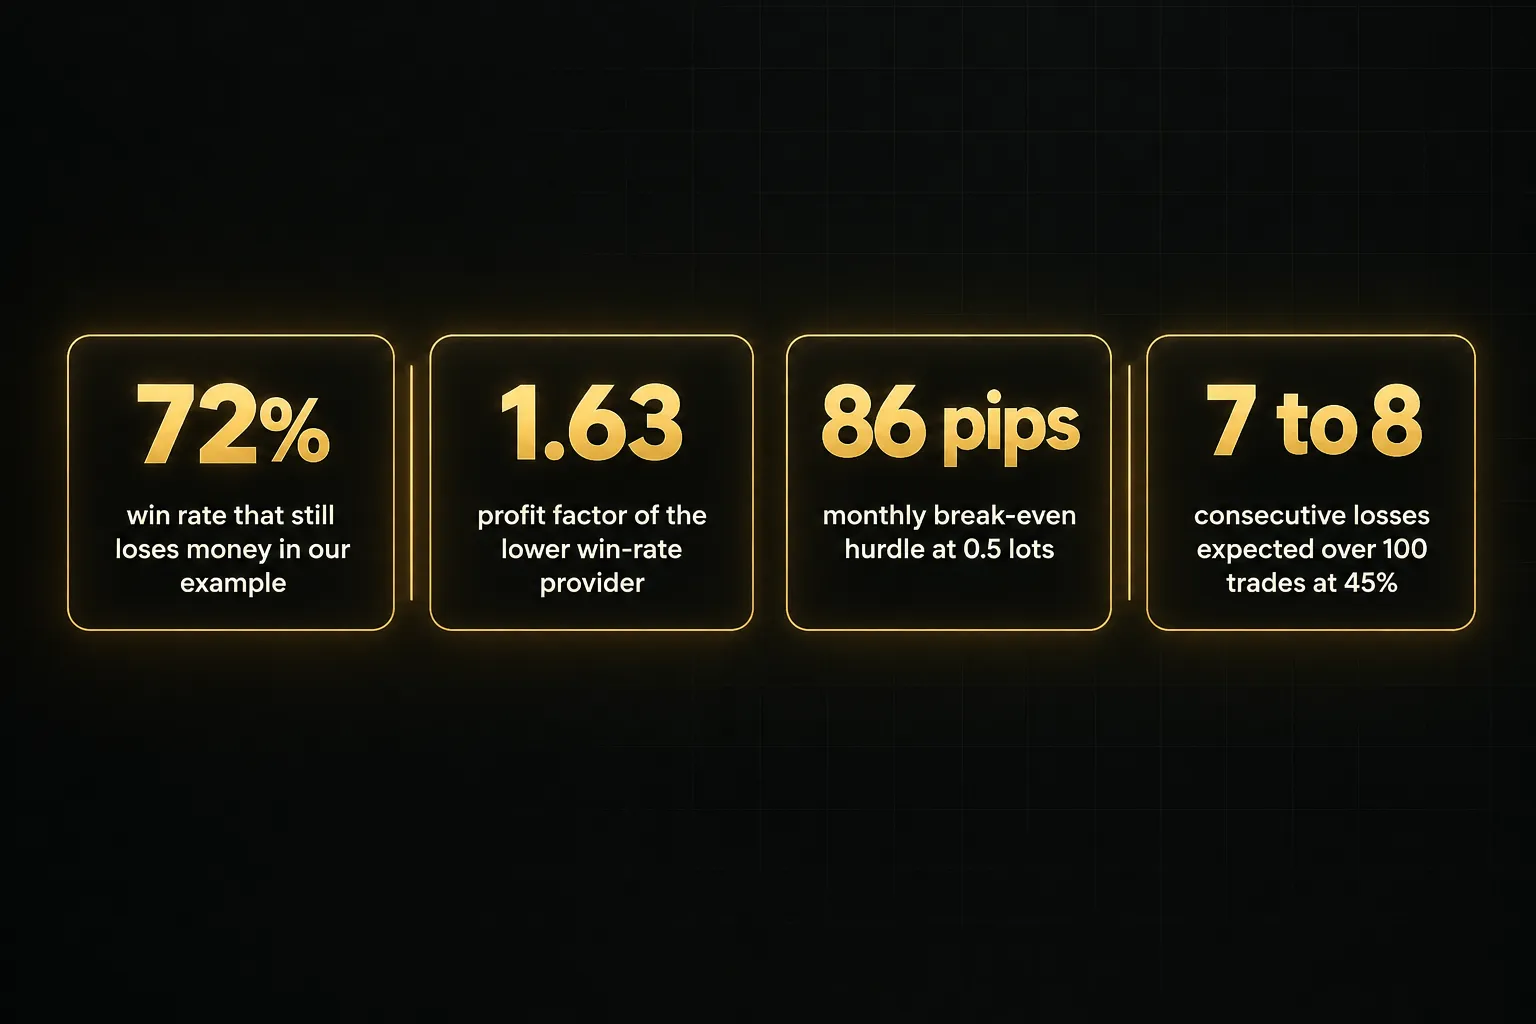
Here’s the uncomfortable truth: a provider can be right 7 out of 10 times and still lose you money every month.
The win rate is the most advertised number in the signal industry. It’s also the least useful on its own.
Win rate is the wrong first question
Four metrics matter more than win rate alone:
Trade expectancy is the average result per trade: (win rate × average win) minus (loss rate × average loss).
If it’s negative, more trades just means losing faster.
Profit factor is gross profit divided by gross loss.
Below 1.0 loses money.
Most durable strategies sit somewhere between 1.3 and 2.0, and anything far above that over a large sample deserves skepticism.
Average win vs average loss defines your realized risk-to-reward ratio. And maximum drawdown is the largest peak-to-trough decline, which tells you how much pain you’ll need to sit through.
The break-even win rate follows a simple formula: 1 ÷ (1 + reward-to-risk). At 1:1 you need 50%. At 1:2 you need just 33%.
But if your average loss is three times your average win, you need 75% just to stay flat… so a 70% win rate loses money.
Compare two hypothetical providers over a typical month of 40 trades, with 1.5 pips of total trading costs per trade:
| Metric | Provider A (“High Accuracy”) | Provider B (“Moderate Accuracy”) |
|---|---|---|
| Win rate | 72% | 42% |
| Average win | 10 pips | 45 pips |
| Average loss | 30 pips | 20 pips |
| Realized reward-to-risk | 1:0.33 | 1:2.25 |
| Gross expectancy per trade | -1.2 pips | +7.3 pips |
| Profit factor | 0.86 | 1.63 |
| Net expectancy after 1.5-pip costs | -2.7 pips | +5.8 pips |
| Net result over 40 trades | -108 pips | +232 pips |
Provider A looks better on a sales page.
Provider B is the only one that makes money.
Not even close.
What a provider must earn to cover your real costs
Now add the subscription.
Say a service costs $99 per month and you trade EUR/USD at 0.5 standard lots, where one pip is worth $5. The fee alone requires about 20 pips per month before you see any profit.
Then add per-trade friction: a 0.8-pip bid-ask spread, roughly 0.7 pips of commission, 0.3 pips of slippage, and maybe 0.4 pips lost to execution delay between alert and fill.
That’s about 2.2 pips per trade. Across 30 trades, it’s 66 pips.
Total hurdle: roughly 86 pips per month just to break even.
Drop to 0.1 lots ($1 per pip) and the subscription alone becomes a 99-pip hurdle. Small accounts pay proportionally far more for the same service.
Losing streaks matter too.
A strategy with a 45% win rate will, over 100 trades, typically produce a run of 7 or 8 consecutive losses.
That’s normal statistics, not proof the service is broken.
Position sizing decides whether you survive it.
At 1% risk per trade, eight losses cost about 7.7%. At 5% risk, the same streak wipes out roughly a third of your account.
Why the same signal performs differently for everyone
Two traders receive the identical alert at the identical second. One books a profit. The other takes a small loss.
Nobody cheated, and the signal didn’t change.
The difference sits entirely in execution and account structure.
Account size, broker, and execution variables
These are the variables that turn one signal into many different outcomes:
- Spreads: A broker quoting 0.2 pips on EUR/USD and another quoting 1.5 pips create a 1.3-pip gap on every trade. On a scalping service targeting 8 pips, that’s over 15% of the profit gone.
- Slippage: Market orders during news or thin sessions can fill several pips away from the alert price. Providers often report the ideal price, not the one you’ll realistically get.
- Order type: A limit order at a defined level either fills at your price or doesn’t fill at all. A market order always fills but at whatever the market offers, which changes both entry and the effective stop distance.
- Liquidity: Major pairs during the London and New York overlap behave very differently from exotics or crypto pairs at 3 a.m. Wider spreads and gaps punish signals in illiquid markets.
- Time zone: If an alert fires while you’re asleep or at work, you either miss it or enter late. A signal you can only take half the time has a different track record for you than for the provider.
- Entry delay: Even a 30-second lag on a fast-moving pair can shift your entry by several pips. On tight-stop strategies, that can turn a winner into a stop-out.
- Account size and leverage: A $500 account risking 1% per trade risks $5, which may be smaller than the minimum lot allows on a wide stop. Traders then oversize, and drawdown tolerance collapses even though the signal itself is unchanged.
- Market regime: Trend-following signals tend to bleed in sideways, range-bound markets through repeated small losses. Momentum signals get shaken out during sharp volatile reversals, so a service’s results in 2024 may not repeat in 2026’s conditions.
Do signals build skill or create dependency
This is the question most providers would rather you didn’t ask.
A signal can be a crutch or a training tool, and the outcome depends on how you use it:
- The copier stays dependent: A trader who only executes alerts never learns to read market structure. When the service shuts down, raises prices, or hits a regime it can’t handle, that trader has nothing to fall back on.
- The student builds transferable skill: A trader who studies the setup behind each signal learns why the entry sits where it does. With PipTrend, for example, that means understanding the marked liquidity levels that define entries and how the multi-timeframe table shapes trade management decisions.
- Journaling closes the loop: Recording each trade with a screenshot, the reason for entry, and the management outcome turns 50 signals into 50 lessons. After a few months, you can often spot setups before the alert arrives.
- Rules clarity determines learnability: You can only learn from a signal whose logic is visible. Black-box alerts with no explanation teach nothing, no matter how profitable they are.
How to test a signal service before risking capital
Most traders test a signal service with their real money first.
That’s backwards.
A structured testing protocol costs you a few weeks and zero capital, and it answers the expectancy question with your own data rather than the provider’s.
A practical testing protocol
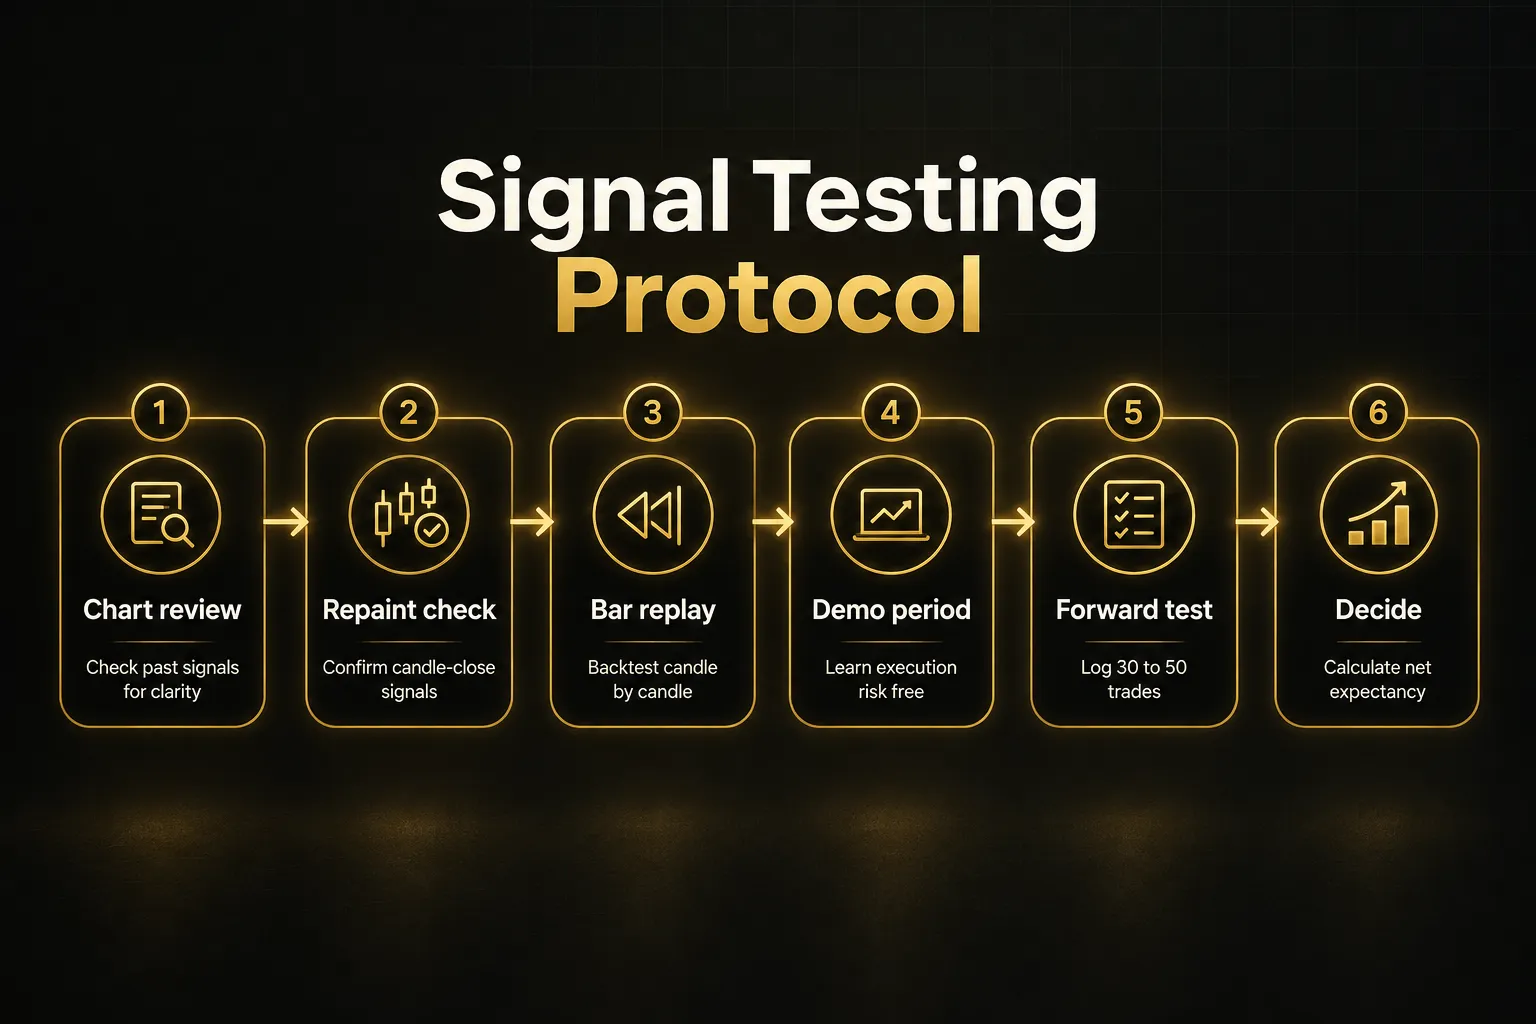
Follow these steps in order.
Skipping ahead is how people end up “testing” with a live account that’s already down 15%.
- Review historical charts. Look at past signals on the chart and check whether entries, stops, and take-profit levels were clearly defined at the time. If you can’t tell where the stop would have been, the system isn’t complete.
- Confirm the indicator doesn’t repaint. A non-repainting indicator only finalizes a signal after the candle closes, and that signal never changes afterward. Repainting tools shift or delete past arrows once price moves, which makes historical charts look far more accurate than live trading ever was.
- Run bar-replay backtesting. Use your platform’s replay mode to step through history candle by candle, taking each signal as it would have appeared. This is the closest backtesting gets to real conditions, because you can’t see the future bars.
- Demo trade for a fixed period. Commit to a set window, such as four weeks, of paper trading every signal you receive. The goal here is learning execution, alert timing, and whether the signals fit your schedule.
- Forward test 30 to 50 trades. Log every trade in live market conditions, on demo or micro lots, using your actual broker’s spread and commission. This is your out-of-sample testing: data the provider couldn’t have optimized for.
- Request closed-trade data. Ask the provider for a complete record of closed trades, not open positions or floating profits. Open trades can be held indefinitely to hide losses, while closed trades can’t be edited.
- Calculate net expectancy and decide. Subtract all costs, including the subscription, from your forward testing results. If expectancy per trade is positive and drawdown fits your risk tolerance, scale in slowly with reduced size.
Watch for four biases while you test.
Survivorship bias means you only hear about providers that haven’t failed yet. Cherry-picking shows the best months only, deleted alerts quietly erase losing calls from a channel, and hindsight bias makes past setups look obvious once you know the outcome.
Red flags of fake or misleading providers
Run every provider through this checklist.
One red flag warrants caution.
Two or more, and you should walk away.
- No verified broker statements. Legitimate providers can show third-party verified records from platforms like cTrader or MT4/MT5 tracking services. Spreadsheets and screenshots can be fabricated in minutes.
- Only win-rate screenshots. As the table earlier showed, win rate without average win and loss is meaningless. A provider who never mentions profit factor or expectancy is either hiding them or doesn’t know them.
- Guaranteed returns. No trading method guarantees returns, and promising them is a regulatory violation in most jurisdictions. “Guaranteed 20% per month” is a sales line, not a forecast.
- Pressure to upgrade tiers. VIP channels, countdown timers, and “only 5 spots left” messaging are sales tactics. A strategy’s edge doesn’t improve because you paid for the platinum tier.
- No disclosed drawdown or losing trades. Every real strategy loses. If you can’t find a single losing trade or a stated maximum drawdown, the record is incomplete by design.
Contrast that with what transparency looks like.
PipTrend’s public results page shows verified cTrader statements that include losses and break-evens, not just winners.
That’s the standard to hold every provider to: if they won’t show the losing trades, assume they’re worse than you’d guess.
Frequently asked questions
Are trading signals worth paying for
Trading signals are worth paying for only when their verified net expectancy exceeds the subscription fee plus your trading costs. On a small account, a $99 monthly fee can require 99 pips of profit just to break even.
Run the cost math at your own position size before subscribing.
Do professional traders use trading signals
Professional traders use signals constantly, but almost always signals generated by their own tested systems rather than bought from outside providers. Institutional desks rely on quantitative models with defined entries, risk limits, and exit rules.
The lesson for retail traders is that professionals treat signals as one part of a full process, never a standalone tip.
Can you make money using forex signals
Yes, you can make money using forex signals if the service has positive expectancy after your broker’s spread, commission, and slippage, and you follow it consistently. Most traders who lose with signals do so through oversized positions, skipped trades, or overriding the stop-loss.
The signal’s edge only reaches your account if your execution matches the system’s rules.
How accurate do trading signals need to be to be profitable
The required accuracy depends entirely on the reward-to-risk ratio, not on a fixed percentage. The break-even win rate equals 1 ÷ (1 + reward-to-risk): 50% at 1:1, about 33% at 1:2, and 25% at 1:3.
A 40% win rate can be highly profitable, while a 70% win rate can lose money if losses are three times larger than wins.
How can I tell if a trading signal provider is legitimate
A legitimate provider shows verified broker statements, uses non-repainting signals confirmed on candle close, and openly discloses losing trades and maximum drawdown.
Ask for closed-trade history rather than open positions. Then verify it yourself with a 30 to 50 trade forward test on your own broker.
Are free trading signals a scam
Free trading signals are not automatically a scam, but price is not the main risk factor. Many free channels exist to funnel users to affiliated brokers or paid tiers, which creates conflicts of interest.
Judge free and paid services the same way: verifiability and rules clarity matter far more than what they cost.
The bottom line on using signals
So, are trading signals worth it?
Only when three conditions are met at the same time.
The signal must have verified expectancy after your specific costs, not the provider’s ideal fills.
It must have transparent rules for entry, stop-loss management, and exit.
And you must be able to follow it consistently without second-guessing trades or turning a system into guesswork.
Miss any one of those, and the subscription becomes an expense rather than an investment.
Your next step is concrete.
Before subscribing to anything in 2026, demo-test the service for a fixed sample of 30 to 50 trades. Then calculate its net expectancy using your own broker’s spread and commission, plus the monthly fee divided across your trades.
If the number is positive and the drawdown is one you can stomach, you’ve found something worth testing with small real size.
If it’s negative, you just saved yourself months of losses for the price of a few weeks of paper trading.
The goal was never finding a signal that’s always right. It’s finding a repeatable process you can execute the same way every time.
Consistency compounds.
Accuracy alone doesn’t.
Sources
- SEC: SEC Charges Multiple Entities in Fraud Schemes Totaling at Least $15 Million That Used WhatsApp and Other Platforms to Lure Investors
- Investor.gov: Social Media and Stock Tip Scams
- Investor.gov: Updated Investor Bulletin: How to Check Out Your Investment Professional
- ScienceDirect: Technical trading revisited: False discoveries, persistence tests, and transaction costs
Risk Disclaimer: Trading involves risk. Past performance doesn't guarantee future results. Only trade with money you can afford to lose. PipTrend is a tool to assist your trading decisions, not financial advice.