Building a Complete Supertrend Trading Strategy
On this page
What the Supertrend Strategy Actually Is
Most traders who say they “trade Supertrend” are really trading a color change. Green means buy, red means sell, and everything else gets improvised in the moment.
That isn’t a system.
Supertrend is an indicator, not a strategy.
It tells you which way price is leaning relative to volatility, and that’s it. It doesn’t tell you how much to risk, where your stop belongs, when to take profit, or when to stop trading for the week after a bad run.
A complete supertrend strategy needs six components working together:
Direction (which side of the market you trade), an entry trigger (the exact condition that opens a position), stop placement (where you’re proven wrong), an exit rule (how you leave winners), position sizing (how much capital each trade risks), and a measurement method (how you know whether any of it works).
Supertrend handles the first item well.
The other five are your job.
This guide takes a framework approach. Instead of treating every green or red flip as a command, you’ll convert raw signals into testable, repeatable rules.
Think of Supertrend as a compass: useful for orientation, useless as a map.
A signal tells you something changed. A strategy tells you exactly what to do about it, how much to bet, and when to admit you were wrong.
One expectation needs setting before going further. No indicator-based system guarantees profit, and Supertrend is no exception.
Trend-following methods typically win less than half their trades and depend on a few large winners to carry the account.
That’s why validation matters.
Backtesting your specific rules on your specific market isn’t an optional extra. It’s part of using Supertrend responsibly.
How Supertrend Calculates Its Signals
Here’s what surprises many traders: Supertrend is built almost entirely from one older indicator.
The Average True Range, introduced by J. Welles Wilder in 1978, does most of the heavy lifting. Supertrend (popularized by French trader Olivier Seban) simply wraps ATR around price to create volatility-adjusted trend following.
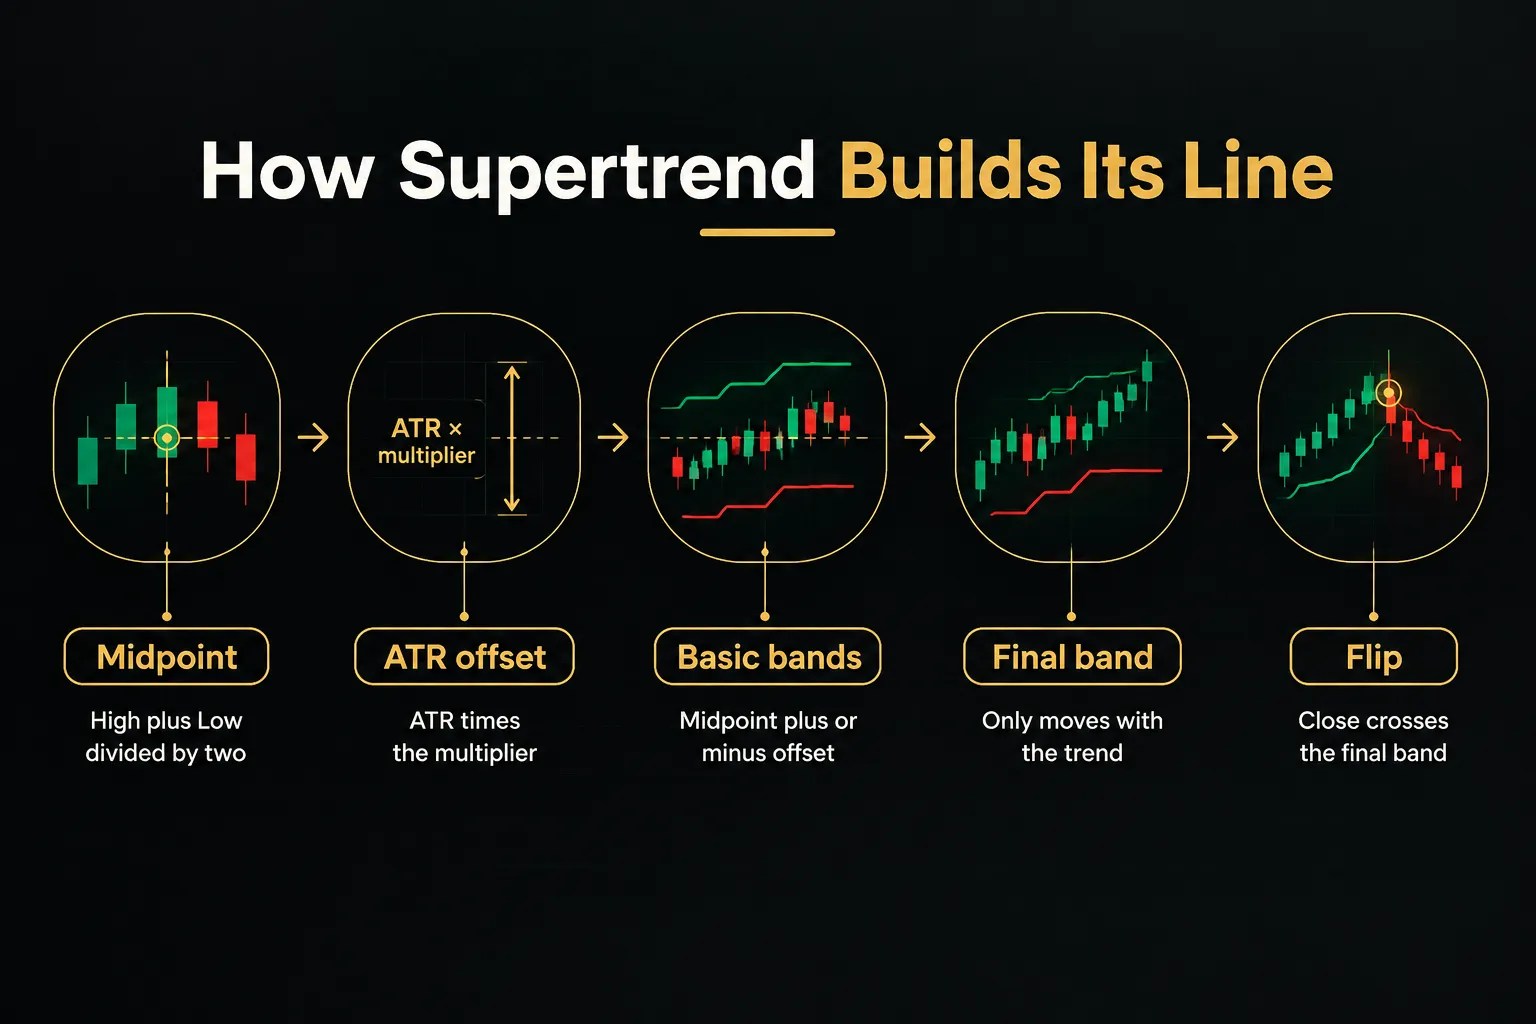
The basic calculation starts with the bar’s midpoint, (High + Low) / 2. From there, two bands are drawn:
Basic upper band = (High + Low) / 2 + (Multiplier × ATR). Basic lower band = (High + Low) / 2 − (Multiplier × ATR).
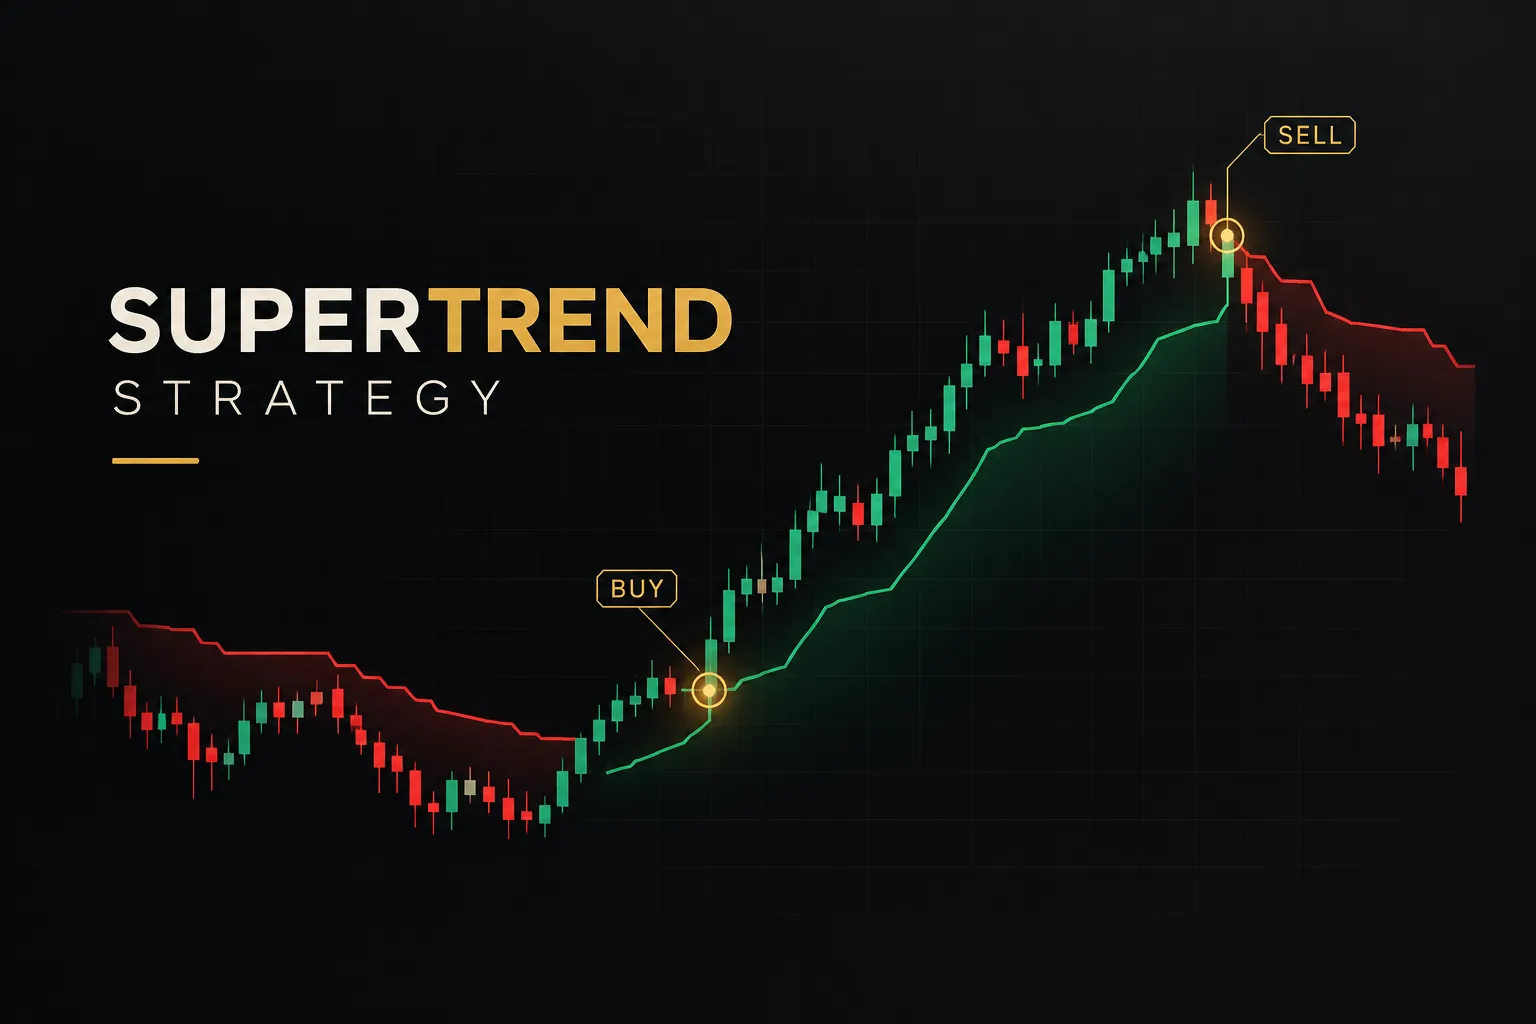
When price closes above the upper band, the trend flips bullish and the indicator plots the lower band beneath price. When price closes below the lower band, the trend flips bearish and the upper band appears above price.
The line acts as dynamic support and resistance that adapts to how violently the market is moving.
ATR Period and Multiplier Explained
Two inputs control everything.
They do very different jobs.
The ATR length (period) controls how far back volatility is measured. A 10-period ATR averages the true range of the last 10 bars, so it reacts faster to sudden volatility spikes than a 20-period ATR does.
Shorter periods produce a twitchier volatility reading.
The ATR multiplier controls how far the bands sit from price. A multiplier of 3 places the bands three ATRs away; a multiplier of 2 places them closer.
Lower multipliers mean tighter bands, more flips, and more false signals. Higher multipliers mean wider bands, fewer flips, and later entries.
A useful analogy: the period is how carefully you measure the road’s bumpiness, and the multiplier is how much suspension you add to absorb it.
The Recursive Final-Band Logic
If you plotted the raw ATR bands, they’d wobble up and down with every bar.
The Supertrend line doesn’t.
Why?
Because the plotted line is a final band built with recursive logic.
During an uptrend, the final lower band can only rise or stay flat. If today’s basic lower band is higher than yesterday’s final lower band, the line moves up; if it’s lower, the line holds at yesterday’s level.
The same ratchet works in reverse during downtrends, where the final upper band can only fall or stay flat. This one-way movement is what turns Supertrend into a natural trailing stop-loss reference.
It locks in as the trend advances and never gives ground until price actually closes through it.
Does Supertrend Repaint?
Confirmed Supertrend signals do not repaint.
Once a candle closes and the trend direction is set, that historical bar stays fixed forever. This is classic non-repainting indicator behavior.
But the current, unfinished bar is a different story. If price spikes through the band mid-candle, the line may turn green, then flip back to red before the close.
That intrabar color change was never a real signal.
This distinction matters for live trading. Acting on intrabar colors means acting on signals that may vanish, while waiting for candle-close confirmation means every signal you trade matches what your backtest would have recorded.
Turning Signals Into Entries and Exits
A color flip is information, not instruction.
The difference between a profitable supertrend strategy and a losing one usually lives in the rules that sit around the flip. Below are three entry frameworks and one exit framework, each written as explicit steps you can test.
Trend Continuation and Reversal Entries
First-reversal entries catch the start of a new move. Continuation entries join a trend already in progress.
They need separate rules because they carry different risks.
- Wait for the candle to close. A flip only counts once the bar closes beyond the final band. This single rule eliminates most false starts caused by intrabar noise and wicks.
- Classify the signal type. A new color flip after a sustained opposite trend is a first-reversal entry. A re-entry signal after the trend has already been running for 10+ bars is a continuation entry, and should be logged separately in your journal.
- Enter reversals on the next bar’s open. For first-reversal trades, open the position at the start of the bar following the confirmed flip. This avoids the temptation to chase a candle that already moved several ATRs.
- Require a fresh structure break for continuation. When re-entering an existing trend, wait for price to break the most recent minor swing high (longs) or swing low (shorts). This confirms buyers or sellers have returned after the pause.
Pullback Entries With Confirmation
Reversal entries often fill at poor prices, because the flip happens after a big candle. Pullback entries trade the retest instead, giving tighter stops and better risk-reward ratio potential.
- Confirm the trend is established. Only look for pullbacks once the Supertrend has held one color for at least a few bars. A freshly flipped line hasn’t proven itself yet.
- Mark a confirmation level. Identify where you expect buyers (or sellers) to step in: the Supertrend line itself, a prior breakout level, or a key moving average. This becomes your zone of interest.
- Wait for price to pull toward the level. Let price retrace toward your zone without closing through the Supertrend line. A close through the line invalidates the setup entirely.
- Enter on a rejection candle. Trigger the trade when a candle closes back in the trend direction after touching the zone. A bullish engulfing bar or pin bar at support works well for longs.
Stop-Loss and Trailing Exit Rules
One misunderstanding causes real losses: the Supertrend line on your chart is an analytical reference, not a broker-held stop order. Unless you manually place a stop at that price, nothing protects your position if the market gaps or your platform disconnects.
- Choose a stop placement method. Options include just beyond the Supertrend line, beyond the most recent swing high or low, or an ATR-based buffer (for example, 1.5 × ATR from entry). Pick one, test it, and stick with it.
- Place the stop with your broker immediately. Enter the actual stop order the moment your position opens. A mental stop is a hope, not a rule.
- Size the position from the stop distance. Calculate position size so that hitting the stop loses a fixed percentage of your account, commonly 0.5% to 1%. Wider stops mean smaller positions, not bigger losses.
- Choose fixed targets or a trailing exit. A fixed 2:1 risk-reward target banks profit quickly and suits choppy markets. A Supertrend trailing exit, where you move the stop to the line after each close, lets winners run and suits strong trends.
- Consider a hybrid. Take half the position off at 1.5R or 2R and trail the rest with the Supertrend line. This smooths the equity curve while still capturing outsized trends.
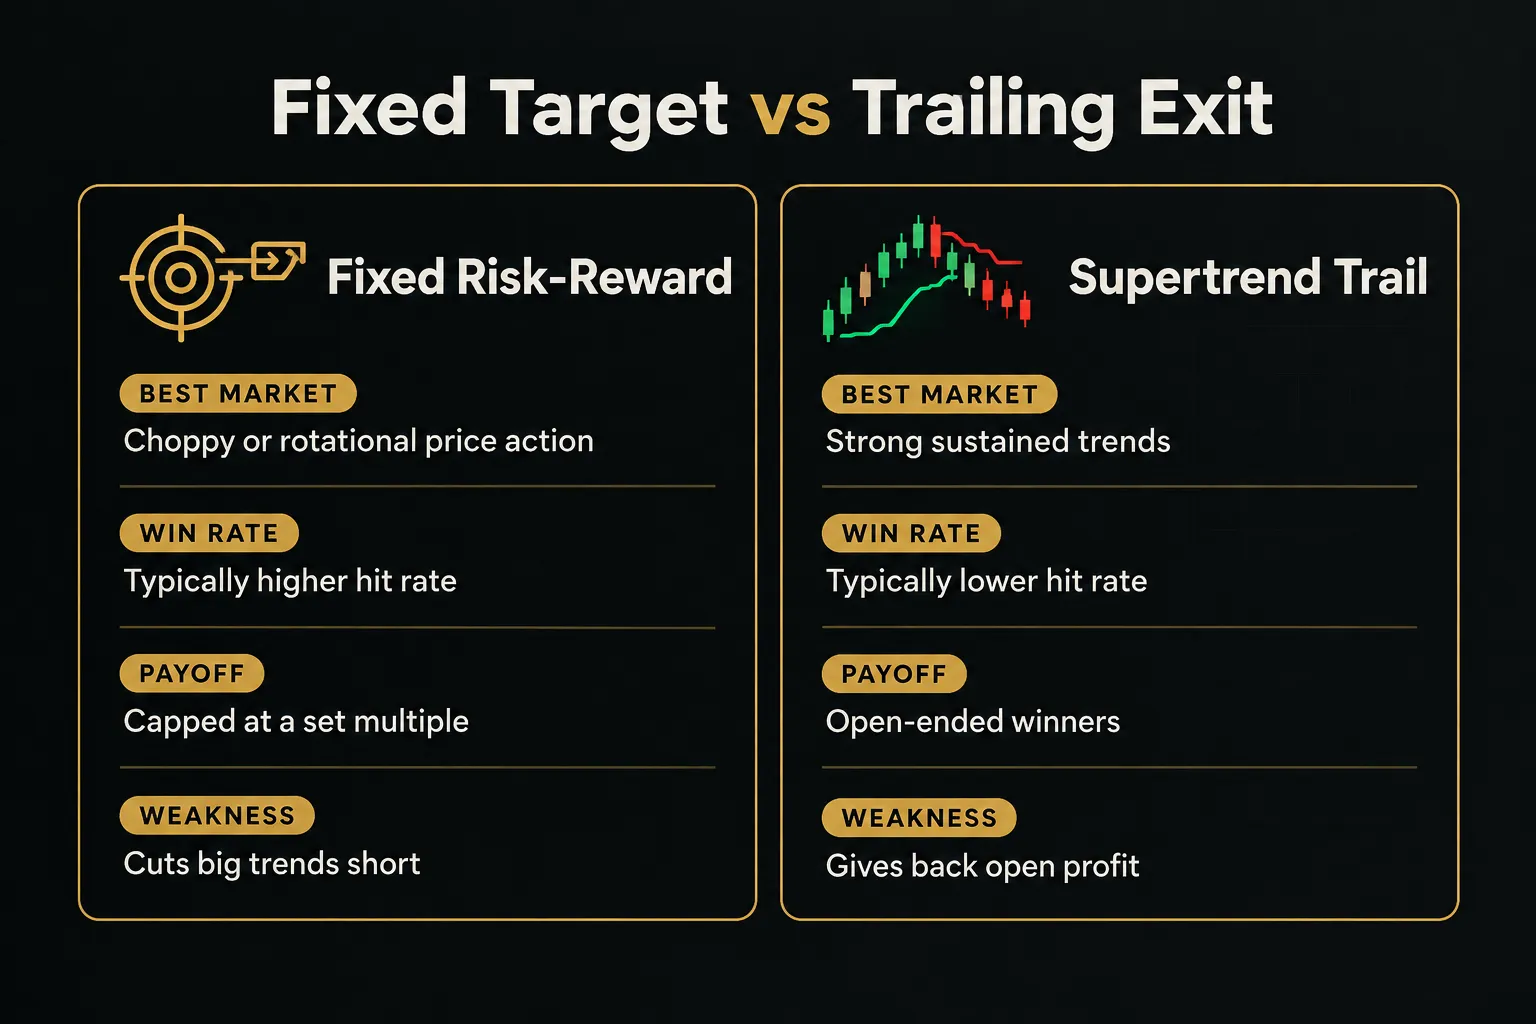
Neither approach is universally better.
Trailing exits produce fewer, larger winners; fixed targets produce more frequent, smaller ones. Your backtest should decide which fits your instrument.
Choosing Settings Without Overfitting
Search “best Supertrend settings” and you’ll find confident answers.
Most of them are wrong, or at least incomplete.
The right settings depend on your asset, spread, timeframe, and current volatility regime, and those change.
Best Settings by Market and Timeframe
Treat common settings as sensitivity starting points, not finished answers.
Each combination trades responsiveness against reliability.
- 7,3 (fast): A 7-period ATR with a 3× multiplier reacts quickly to volatility shifts. It suits intraday forex and index futures on 15-minute to 1-hour charts, but expect more whipsaws.
- 10,3 (default): The default on TradingView and many platforms. It’s a reasonable baseline for H1 to H4 charts across forex, crypto, and equities, which is exactly why it’s worth testing first.
- 10,2 (tight): A lower multiplier hugs price closely. It catches trend changes earlier but generates noticeably more false flips in ranging markets.
- 14,3 or 20,4 (slow): Longer periods and wider multipliers suit daily and weekly swing trading. Fewer signals, later entries, but far less noise.
- High-spread instruments: On exotic forex pairs or thin altcoins, wider settings help, because frequent flips multiply spread costs quickly.
To avoid curve-fitting, test only three to five settings, and run each across varied conditions: a trending year, a ranging year, and a high-volatility shock period.
A setting that performs acceptably across all three beats one that performs brilliantly in only one.
Research on backtest overfitting by Bailey, Borwein, López de Prado, and Zhu (2014) showed that testing many parameter combinations on one dataset dramatically raises the odds of selecting a configuration that fails live.
Filtering Range-Bound Conditions
Supertrend’s biggest weakness is predictable.
In sideways markets, price oscillates across the line and triggers flip after flip. A market regime filter keeps you out of those conditions.
- ADX threshold: The Average Directional Index measures trend strength, not direction. Many traders only take Supertrend signals when ADX is above 20 or 25, skipping trades when the market lacks conviction.
- Moving-average slope: A 50- or 200-period exponential moving average with a clear slope confirms directional bias. A flat EMA suggests chop and a reason to stand aside.
- Higher-timeframe direction: Only take H1 longs when the H4 or daily Supertrend is also green. This form of multi-timeframe analysis filters out counter-trend noise.
- Volume confirmation: On stocks and futures, flips accompanied by above-average volume tend to carry more follow-through than flips on thin participation.
- Price structure: Use price action and market structure to check for higher highs and higher lows (or the reverse). Overlapping candles inside a horizontal box signal a range.
Combining Supertrend With Other Indicators
More indicators don’t automatically mean more confirmation.
Stacking a 20 EMA, a 50 EMA, a Parabolic SAR, and Supertrend feels like four votes for the same trade. It’s really one vote counted four times, because all four are derived from recent price trend.
That kind of stacking creates false confidence without adding independent information. Better confluence comes from tools that measure something different:
- Momentum oscillators: RSI divergence can warn that a trend is exhausting before Supertrend flips, which helps with exit timing rather than entries.
- MACD confirmation: A MACD histogram crossing zero in the same direction as a Supertrend flip adds a momentum check, though it overlaps with trend tools more than RSI does.
- Defined price levels: Horizontal support, resistance, and prior-day highs and lows are independent of the ATR math entirely.
- Multi-timeframe trend tables: Checking alignment across many timeframes at once shows whether a signal agrees with the broader picture or fights it.
PipTrend is a practical example of this structured approach. It pairs each trend signal with a specific entry level rather than a bare color change, and adds a 12-timeframe confirmation table so you can see at a glance whether short-term and higher-timeframe trends agree.
That’s the principle in action: a signal, a defined price, and an independent alignment check.
Backtesting Supertrend the Right Way
A backtest that ignores costs is a fantasy novel with charts.
Supertrend strategies on lower timeframes can generate hundreds of trades a year, and small frictions compound fast.
Include these realistic cost assumptions in every test:
- Spread: Use typical spreads for the session you’ll actually trade, not the tightest spread your broker advertises.
- Commission: Add per-lot or per-share fees on both entry and exit.
- Slippage: Assume at least one tick or pip of adverse slippage on market orders, more during news events. Slippage and spread together often erase the edge of fast settings like 7,3.
- Overnight and funding costs: Swap rates on forex and funding rates on crypto perpetuals erode trend trades that last days or weeks.
- Weekend gaps: Model gaps through your stop, since a Monday open can fill far beyond your intended exit.
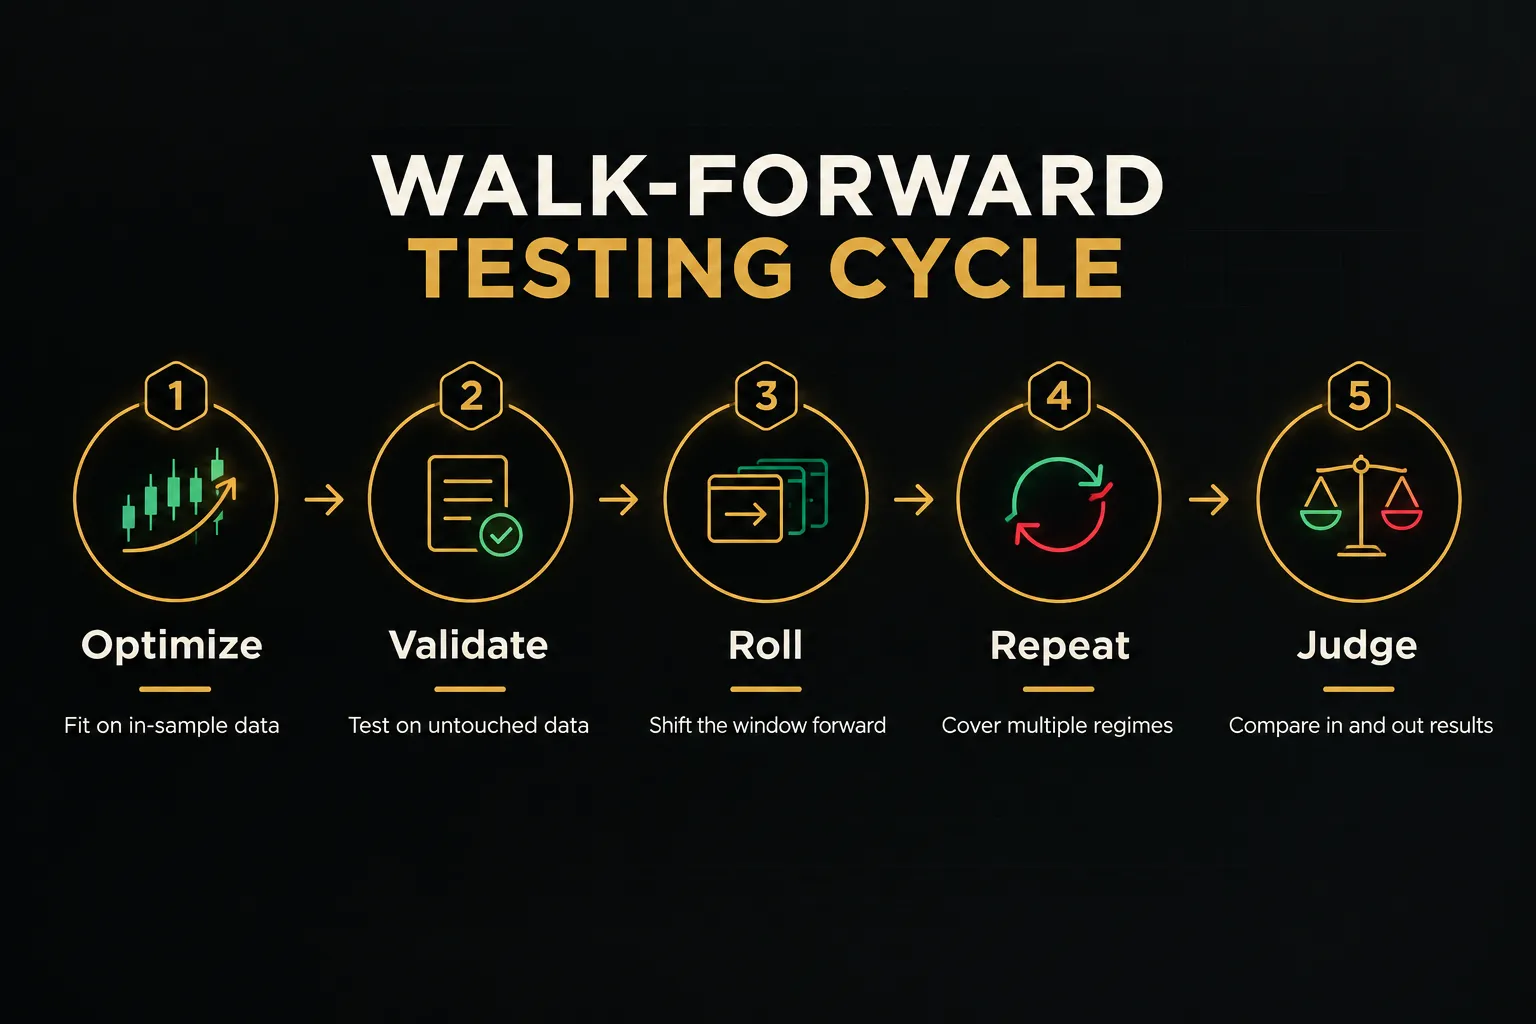
Walk-forward analysis is the standard defense against overfitting.
You optimize settings on one segment of data (say, 2019 to 2021), then run those exact settings on an untouched period (2022) for out-of-sample testing. Roll the window forward and repeat until you’ve covered several market regimes.
When you evaluate results, look past win rate.
A 35% win rate can be highly profitable, and a 70% win rate can lose money.
These metrics tell the real story:
- Expectancy: Average profit or loss per trade, calculated as (win rate × average win) − (loss rate × average loss). Positive expectancy is non-negotiable.
- Profit factor: Gross profit divided by gross loss. Above 1.3 after costs is a reasonable minimum; above 2.0 on out-of-sample data deserves suspicion and a second look.
- Average trade: Net profit per trade in currency or R-multiples. If it’s smaller than two or three times your round-trip cost, the edge is fragile.
- Maximum drawdown: The largest peak-to-trough equity decline. Ask honestly whether you could keep trading through it.
- Longest losing streak: Trend systems often hit 8 to 12 consecutive losses. Knowing your number in advance prevents panic abandonment.
- Recovery time: How long the system takes to reach a new equity high after its worst drawdown.
Finally, keep a pre-trade checklist and a trade journal. Record setup type (reversal, continuation, or pullback), settings used, filter conditions at entry, and the outcome.
After 50 to 100 trades, the journal reveals whether losses come from the strategy itself, from execution errors, or from breaking your own rules… and each problem has a very different fix.
Questions Traders Still Ask
Is the Supertrend indicator profitable?
Supertrend is not profitable on its own.
Profitability comes from the rules built around it: entry conditions, stop placement, position sizing, and regime filtering. A well-tested supertrend strategy with positive expectancy after costs can be profitable, but the indicator alone is just a direction reading.
What is the most accurate Supertrend setting?
No single setting is the most accurate across all markets.
Settings like 10,3 and 7,3 are sensible starting points, but the optimal values depend on your asset, timeframe, spread, and volatility regime. Test a small handful of settings across different market conditions rather than hunting for one perfect number.
Which is better, Supertrend or moving average?
Neither is strictly better; they measure trend differently.
Supertrend adjusts to volatility through ATR and provides a built-in trailing stop reference, while moving averages simply smooth price. Supertrend usually gives clearer stop levels, whereas moving averages are better for gauging slope and long-term bias.
What is the best indicator to use with Supertrend?
The best companion is one that measures something Supertrend doesn’t.
ADX adds trend-strength filtering, RSI adds momentum and divergence warnings, and defined price levels add structure independent of ATR. Avoid pairing it with several other trend-following tools that repeat the same information.
Does Supertrend work in a sideways market?
Supertrend performs poorly in sideways markets.
Price crosses the line repeatedly, producing a string of small losses. Use a regime filter such as ADX above 20 to 25, a flat-EMA check, or higher-timeframe alignment to stay out of ranges.
How do you use Supertrend for entry and exit?
Enter after a candle closes beyond the Supertrend line, ideally with a filter confirming trend strength.
Place a real stop beyond the line, a swing point, or an ATR buffer.
Exit at a fixed risk-reward target, by trailing the stop along the Supertrend line, or with a combination of both.
What does 10,3 mean in Supertrend?
10,3 means an ATR period of 10 and a multiplier of 3. The indicator measures volatility over the last 10 bars and places its bands three ATRs from the bar’s midpoint.
It’s the common default, not a universally optimal choice.
Can Supertrend be used for swing trading?
Supertrend works very well for swing trading on H4 and daily charts.
Higher timeframes produce fewer false flips and cleaner trends, and trading costs are smaller relative to each move. Scalping with Supertrend is possible but requires tighter filters and strict cost control.
Does Supertrend repaint or give false signals?
Supertrend does not repaint confirmed historical bars, but it does give false signals.
Intrabar colors can change before a candle closes, which is why candle-close confirmation matters. False signals still occur after close, especially in ranges, so filtering is essential.
How do you backtest a Supertrend strategy?
Backtest a supertrend strategy by coding explicit rules, adding realistic costs, and running walk-forward analysis.
Optimize on one data segment, validate on an untouched out-of-sample period, and repeat across regimes. Judge results by expectancy, profit factor, and maximum drawdown, not win rate.
The Bottom Line on Supertrend
Supertrend is a direction tool.
A good one, built on decades-old volatility math that still holds up in 2026.
But it only becomes a strategy once you add defined entries, real stops, disciplined position sizing, and honest validation.
If you take one action from this guide, make it this: before risking capital, run a walk-forward backtest on the exact instrument and timeframe you plan to trade live.
Include spread, commission, and slippage. Then check whether the out-of-sample results still show positive expectancy and a drawdown you could genuinely tolerate.
Most traders spend their energy searching for the perfect ATR setting.
It doesn’t exist.
And chasing it usually produces an overfitted system that looks brilliant on paper and breaks within weeks.
Reliability comes from process discipline and regime awareness, not from finding a magic pair of numbers.
Build the rules, test them properly, follow them consistently, and know when the market isn’t offering your kind of trade.
That’s what a complete Supertrend trading strategy actually looks like.
Sources
Risk Disclaimer: Trading involves risk. Past performance doesn't guarantee future results. Only trade with money you can afford to lose. PipTrend is a tool to assist your trading decisions, not financial advice.