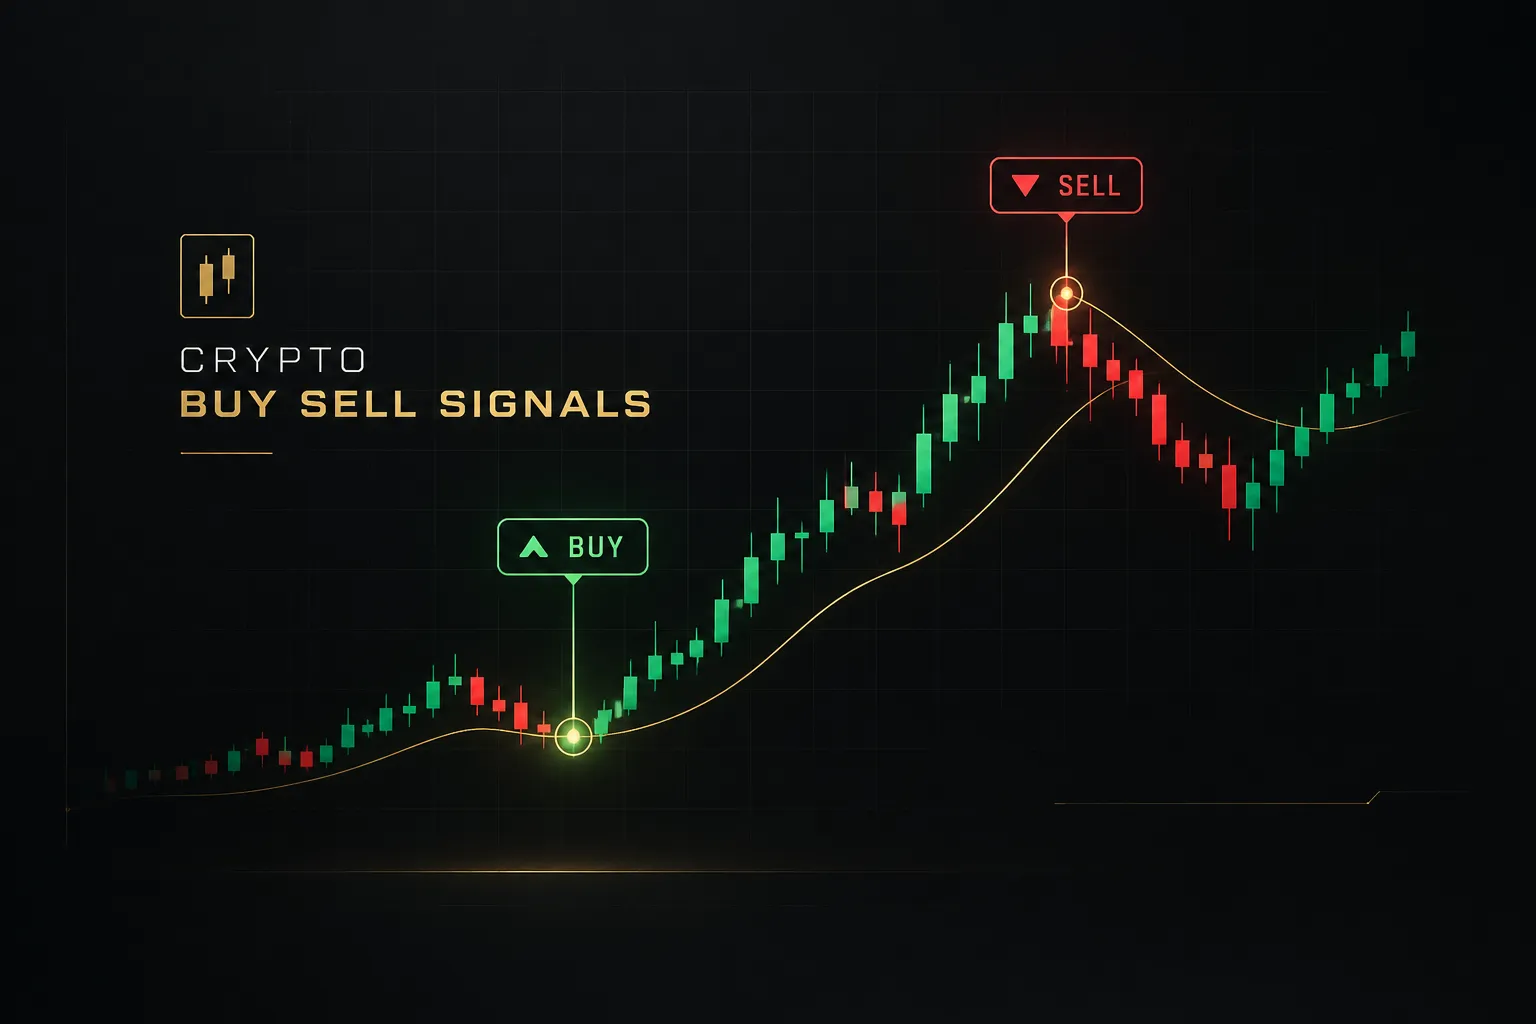
Crypto buy sell signals: how to actually read them
On this page
What a crypto signal is (and isn’t)
Most traders who lose money on crypto buy sell signals don’t lose because the signal was wrong.
They lose because they treated it like a promise.
That distinction shapes everything else in this guide.
A crypto signal is a probability-based trade setup derived from patterns in price, volume, or blockchain data. It tells you the odds of a move in one direction have tilted.
Nothing more.
Think of it like a weather forecast.
A 70% chance of rain doesn’t mean it will rain, and it certainly doesn’t tell you how hard. You still decide whether to carry an umbrella, cancel the picnic, or ignore it entirely.
When a chart tool, analyst, or bot prints “BUY,” it is saying that, given current conditions, an upward move has elevated odds over some timeframe.
It isn’t predicting the future.
It’s describing a historical tendency that has worked often enough to be worth watching.
That framing matters because the crypto signal industry is full of people selling certainty. “95% accuracy.” “Guaranteed 10x.” “Never miss a pump.”
Real technical analysis doesn’t work that way, and anyone claiming otherwise is selling something other than an edge.
A signal is a question the market is asking you. Your job is to decide whether the answer is worth risking money on.
So how do you decide? This guide walks through a five-part framework that experienced traders use, whether they say it out loud or not:
Context (what kind of market are you in), confirmation (does volume and price action agree), multi-timeframe alignment (do the bigger charts support the smaller ones), risk management (where you’re wrong and how much you lose if you are), and measurable testing (does this actually work over hundreds of trades).
If you’re newer to trading, here’s the honest expectation.
You won’t finish this article with a magic indicator. You’ll finish it able to validate any signal you see, from any source, before your money is on the line.
The five sources of crypto signals
Here’s a mistake almost every beginner makes: lumping every “signal” into one bucket. A crossover on your own chart, a paid Discord alert, and a tweet from an anonymous account with 200,000 followers are completely different products with completely different reliability.
Knowing where a signal comes from tells you how much you can verify, and how much you’re being asked to trust. These are the five main sources as of 2026:
- Chart-based indicator signals. These come from tools like the relative strength index (RSI), MACD crossover, moving average crossover, or Bollinger Bands applied to your own chart. They’re fully transparent because you can see the formula, the inputs, and every past signal on the chart yourself.
- Paid analyst alerts. A human analyst or team sends trade ideas through email, an app, or a private channel. Quality ranges from excellent to fraudulent, and transparency depends entirely on whether they publish a complete, timestamped record of every call.
- Automated trading bots. Bots execute rules automatically, often on exchanges through API keys. The logic may be hidden, and advertised results are frequently backtests rather than live performance, which is a very different thing.
- Social media calls (Telegram, Discord, X). Free or subscription groups post entries, often with dramatic profit screenshots. This category has the lowest average transparency and the highest concentration of pump-and-dump schemes.
- Fundamental and on-chain signals. These track exchange inflows and outflows, whale wallet movements, funding rates, token unlock schedules, and network activity. They’re useful for context and timing over days or weeks, but rarely precise enough for an exact entry.
Chart-based indicators vs alerts and bots
The biggest divide is between signals you can audit and signals you have to trust.
With an indicator on your own chart, you can scroll back two years and see exactly how it behaved. With an alert or bot, you only see what the provider chooses to show you.
That doesn’t make indicators automatically better.
A transparent indicator used in the wrong market regime will still lose money. But at least you can find out why, which is the first step toward fixing it.
Signal vs recommendation vs trade plan
These three terms get used interchangeably.
They shouldn’t be.
Each one adds a layer of information the previous one lacks:
- Signal: identifies direction or timing only. “ETH looks bullish here” is a signal.
- Recommendation: adds an entry price and an invalidation level. “Buy ETH near $3,200, idea is invalid below $3,050” is a recommendation.
- Trade plan: adds position sizing, stop-loss placement, take-profit levels, and rules for managing the trade. This is the only version you should ever act on.
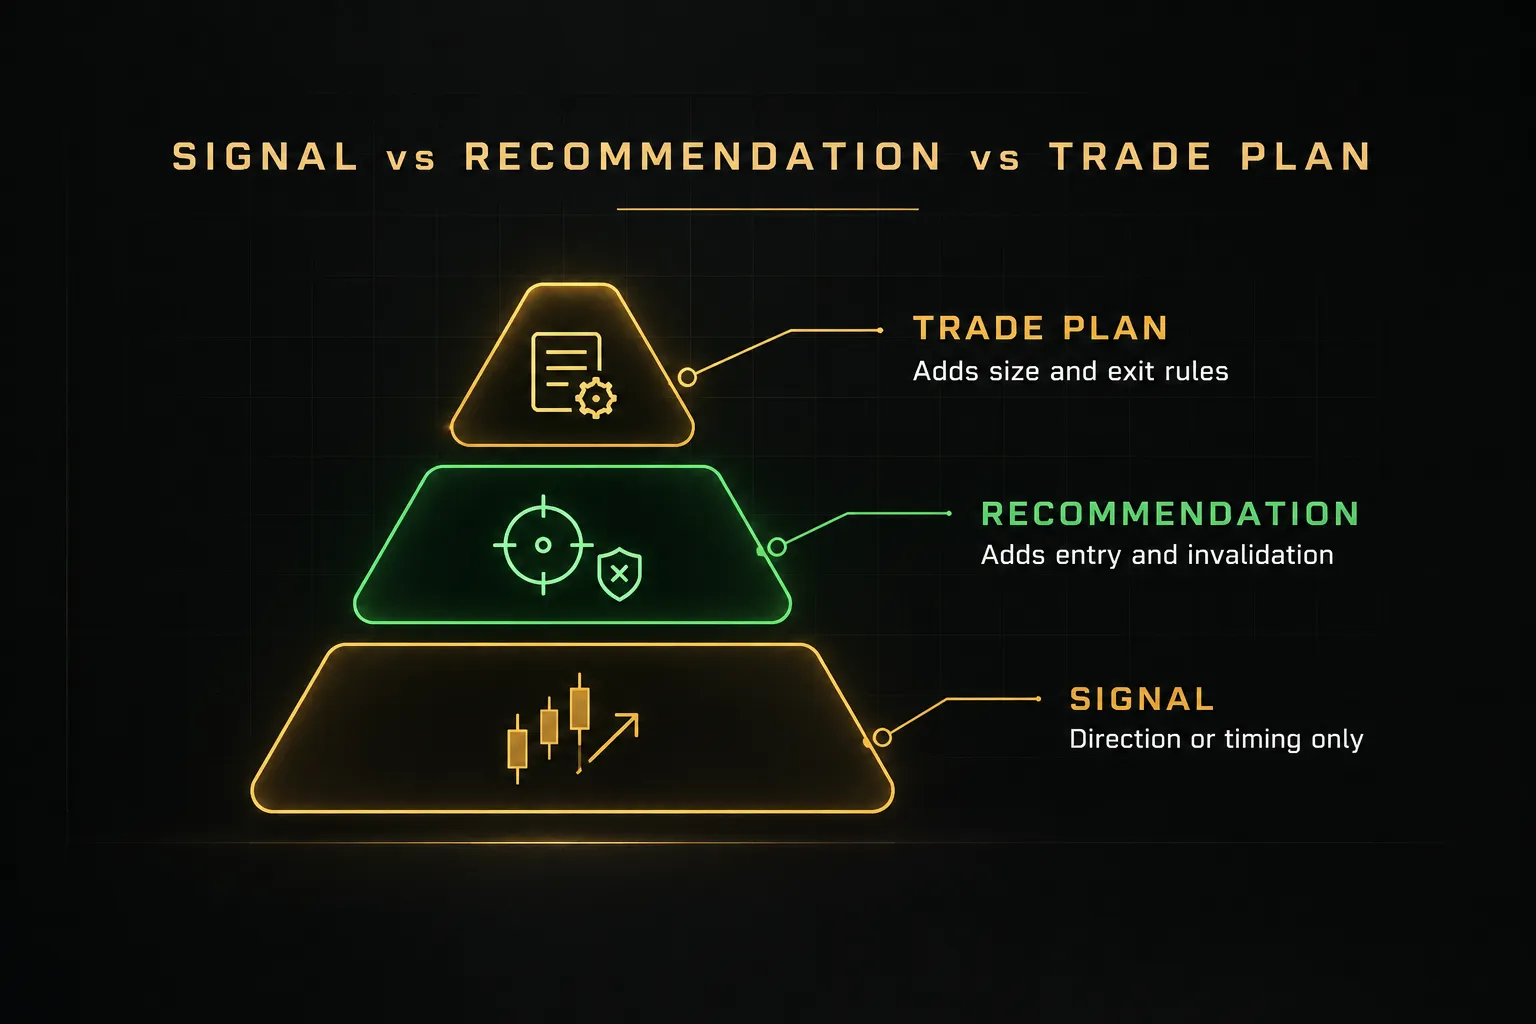
Most signal providers sell the bottom layer and let you assume the rest.
That gap is where accounts get blown.
Reading indicators inside market context
Bitcoin’s daily RSI was already flashing oversold in mid-June 2022. Traders who bought that “signal” watched price fall another 20% or more, to roughly $17,600, within a week.
The indicator wasn’t broken.
It was being read without context.
Every indicator behaves differently depending on the market regime: trending, ranging, or high-volatility. An oversold RSI reading in a range is often a decent buy.
The same reading in a strong downtrend is often just a sign that sellers are firmly in control.
RSI, MACD and moving averages by regime
The table below shows how common indicators tend to behave across the three regimes. Use it as a starting map, not a rulebook.
| Indicator | Trending market | Ranging market | High-volatility market |
|---|---|---|---|
| RSI (14-period, 70/30 levels) | Can stay overbought above 70 or oversold below 30 for weeks. Use pullbacks to 40-50 in uptrends instead of shorting at 70. | Works best here. Readings near 30 at support and near 70 at resistance often mark reversals. | Extreme readings appear and reverse within hours. Divergence is more useful than raw levels. |
| MACD crossover (12, 26, 9) | Reliable as trend confirmation, though entries arrive late after much of the move. | Generates frequent whipsaws as the lines cross back and forth near zero. | Lags badly. By the time the crossover prints, price may have already reversed. |
| Moving average crossover (e.g., 9/21 EMA or 50/200 SMA) | The 50/200 “golden cross” confirms major trends. Faster exponential moving average pairs catch swings. | Repeated false crosses. Many traders stand aside when moving averages flatten and tangle. | Wicks trigger crosses that reverse almost immediately. |
| Bollinger Bands (20, 2) | Price “walks the band,” hugging the upper or lower edge. Touches are not reversal signals. | Band touches often mark range extremes. Mean reversion toward the middle band is common. | Bands widen sharply. A squeeze followed by expansion often precedes a breakout. |
| VWAP | Price holding above VWAP intraday confirms buyer control. | Price oscillates around VWAP, which acts as a magnet. | Useful as a fair-value anchor after a news spike. |
Notice the pattern.
MACD and moving average crossovers are lagging confirmation tools. They tell you a trend has started, not that one is about to.
That’s useful, but only if you accept that you’ll miss the first part of every move.
Why volume and structure change the story
An indicator signal on its own is a whisper.
Add volume confirmation and a clear support and resistance level, and it becomes a conversation worth listening to.
Picture a breakout above resistance. On low volume, it often fails and traps buyers. On volume 1.5 to 2 times the recent average, with a candle closing firmly above the level, that’s genuine breakout confirmation.
Same price move, very different odds.
Market structure works the same way. An oversold RSI reading sitting right on a level that held three times before carries far more weight than the same reading in the middle of nowhere.
One trap catches a lot of traders: stacking correlated indicators. RSI, stochastic, and Williams %R all measure momentum from the same closing prices.
When all three say “oversold,” that isn’t three confirmations.
It’s one confirmation repeated three times.
Real signal confluence comes from independent sources: momentum, volume, structure, and higher-timeframe trend. Not three versions of the same math.
A complete signal validation workflow
What separates a disciplined trader from someone clicking “buy” on every alert?
Usually it’s a checklist.
The workflow below works for any signal source, whether it came from your own chart or a paid channel.
Run through it in order. If a signal fails a step, you stop.
That’s the whole point.
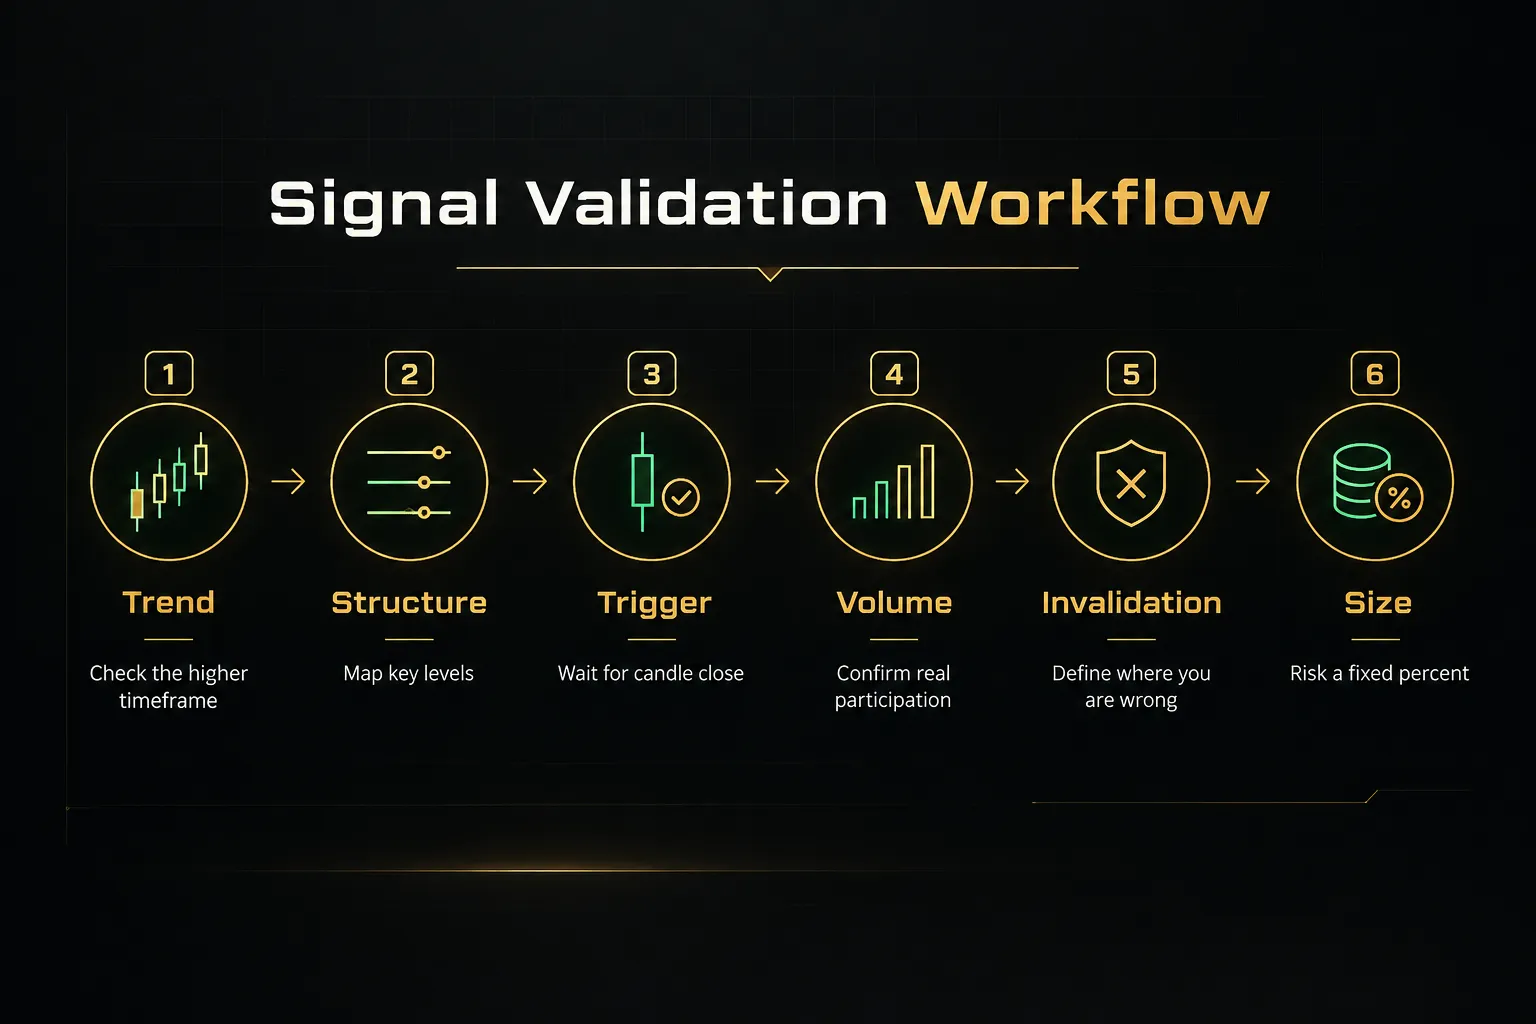
- Check the higher-timeframe trend. Before looking at the signal, look at the daily and 4-hour charts. A buy signal against a clear daily downtrend has lower odds than one aligned with it.
- Map market structure. Mark recent swing highs, swing lows, and the support and resistance levels price has respected. Ask whether the signal fires at a meaningful level or in empty space.
- Wait for the entry trigger and candle close. A signal that appears mid-candle can vanish by the close. Waiting for the candle to close costs you a slightly worse price but filters out a large share of false triggers.
- Confirm with volume. Check whether volume is above its recent average on the trigger candle. Weak volume on a breakout is a warning, not a confirmation.
- Define the invalidation level. This is the price where your trade idea is objectively wrong, such as a close below the support that justified the buy. Decide it before entering, never after.
- Place the stop-loss. Set it just beyond invalidation, with a buffer based on average true range (ATR) so normal noise doesn’t knock you out. Many traders use 1 to 1.5 times ATR beyond the level.
- Set take-profit levels. Target the next resistance or support zone. If that target doesn’t offer at least a 1.5:1 or 2:1 risk-reward ratio, the trade usually isn’t worth taking.
- Calculate position sizing. Risk a fixed percentage of your account, commonly 0.5% to 2%, per trade. Position size equals the dollar amount you’re willing to lose divided by the distance from entry to stop.
- Account for execution costs. Factor in the spread, slippage on market orders, trading fees (often 0.02% to 0.1% per side), funding rates on perpetual futures, and liquidity gaps in smaller altcoins. A 1% scalp target can shrink by a third after costs.
Spot, futures, scalping and swing differences
The same buy signal means something different depending on who’s reading it.
A spot buyer holding BTC can sit through a 15% drawdown and wait. A trader on 10x leverage gets liquidated before price falls 10%, and often closer to 9% once maintenance margin is included.
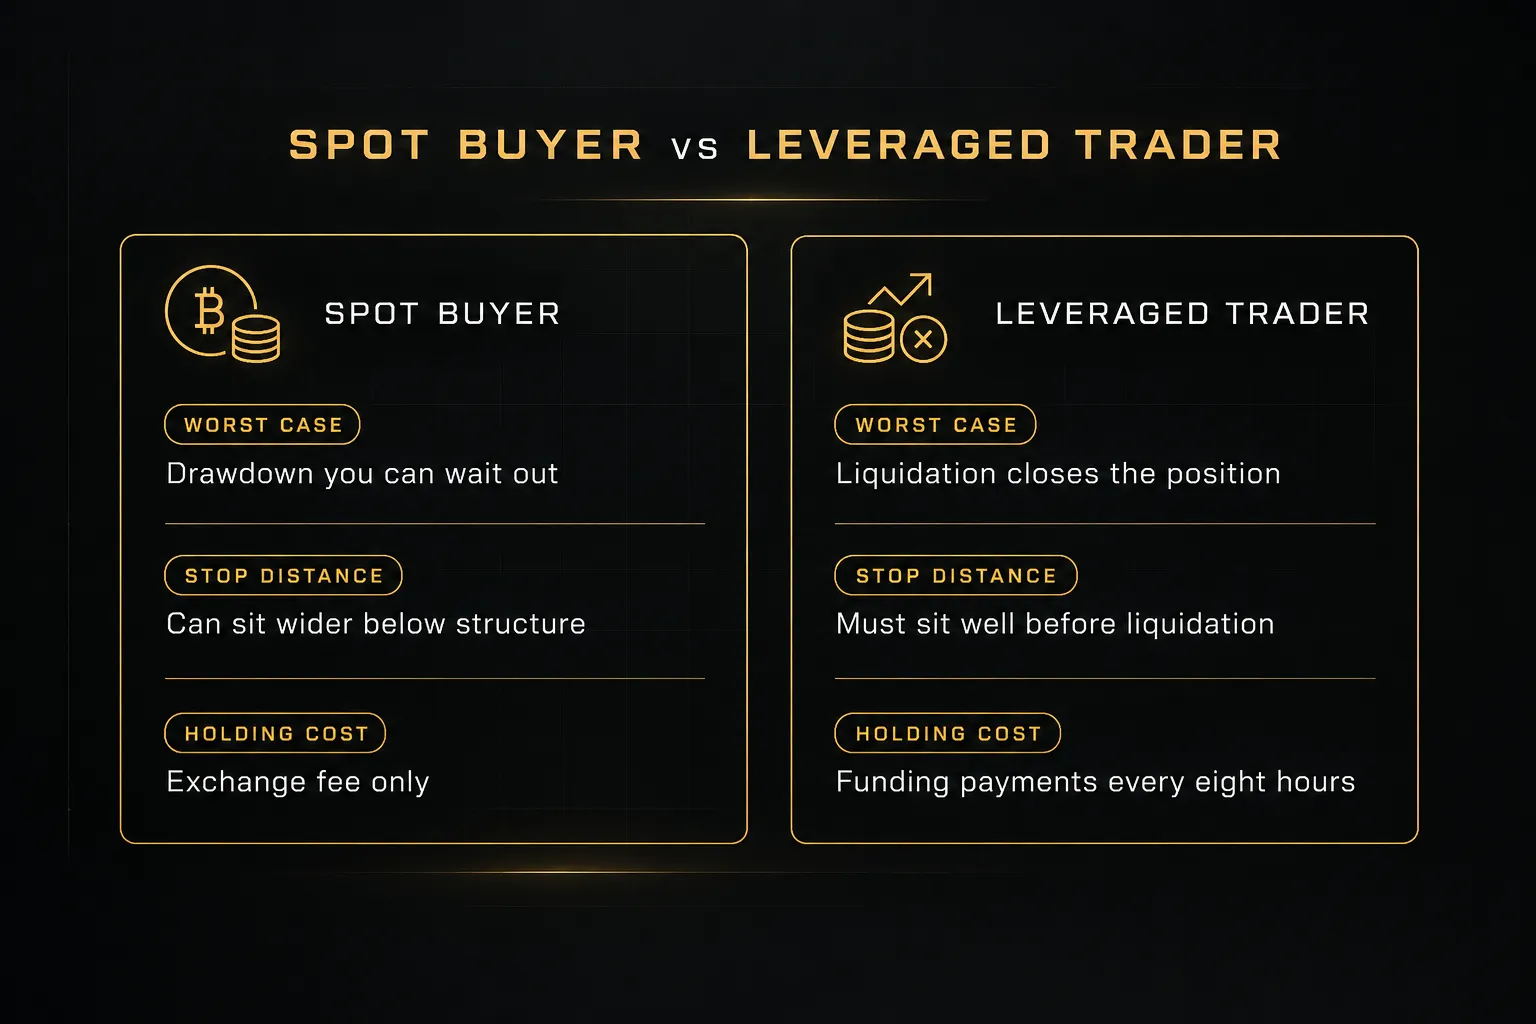
Timeframe changes things too.
A scalper on the 5-minute chart cares about spread, order book depth, and VWAP. A swing trader on the 4-hour and daily cares about weekly structure and can largely ignore intraday noise.
Scalpers pay far more in cumulative fees, so their edge needs to be larger per trade.
Tools that bring the pieces together
The hardest practical problem is conflicting timeframes. The 5-minute says buy, the 1-hour says neutral, the daily says sell.
Which one wins?
A simple multi-timeframe confirmation table settles it.
| Timeframe | Role in the decision | Example reading | What it tells you |
|---|---|---|---|
| Daily | Defines the dominant trend | Price above rising 50 EMA | Favor longs; treat shorts as counter-trend |
| 4-hour | Defines the current swing | Pullback into prior resistance turned support | A buy zone is forming |
| 1-hour | Confirms structure shift | Higher low printed, MACD turning up | Momentum aligning with the swing |
| 5-minute | Times the entry | Break above minor high on volume | Trigger to enter with tight stop |
The rule of thumb: higher timeframes set direction, lower timeframes set timing. If the 5-minute disagrees with the daily, you either skip the trade or treat it as a short-term counter-trend scalp with smaller size.
Some platforms are built around this structure.
PipTrend, for example, shows a 12-timeframe table on one screen so you can see at a glance whether the 5-minute and daily agree. It also separates the signal (color-coded trend candles showing direction) from the entry (marked liquidity levels where price is likely to react), which mirrors the signal-versus-trade-plan distinction covered earlier.
Whatever tool you use, the goal is the same. See alignment quickly, and keep “which way” separate from “where exactly.”
Testing signals without fooling yourself
The easiest person to fool is yourself.
Scroll through any chart with buy and sell arrows, and the tool looks brilliant. Then you trade it live and… the results look nothing like the chart.
Usually that gap comes from three sources: indicators that cheat, metrics that mislead, and markets that change.
Then there’s a fourth problem entirely: people who are lying to you.
Repainting, hindsight bias and look-ahead traps
A repainting indicator changes or moves its past signals after new price data arrives. The arrow you see at the exact bottom wasn’t there in real time.
It appeared later, once the bottom was already confirmed.
- Watch it live before trusting it. Put the indicator on a 1-minute or 5-minute chart and watch for 30 minutes. If arrows appear, disappear, or shift position, it repaints.
- Trust only candle-close confirmation. A signal that’s locked in when the candle closes and never changes afterward is the only kind you can honestly backtest.
- Beware perfect-looking history. If every top and bottom has an arrow on it, you’re almost certainly looking at hindsight, not an edge.
- Check for look-ahead logic. Custom scripts that reference future bars, or higher-timeframe data before that candle closed, produce backtests no live trader could replicate.
Measuring expectancy, drawdown and regime shifts
Win rate is the most marketed number in trading and one of the least useful on its own.
A system winning 70% of trades with an average win of 0.5R and an average loss of 1.5R loses money.
A system winning 40% with a 2.5:1 average win-to-loss makes money.
- Trade expectancy: (win rate × average win) minus (loss rate × average loss). The 40% system above produces +0.4R per trade. The 70% system produces −0.1R. Expectancy is the number that pays you.
- Profit factor: gross profit divided by gross loss. Above 1.0 is profitable; most durable systems land somewhere between 1.3 and 2.0.
- Maximum drawdown: the largest peak-to-trough decline in your equity. If you can’t stomach it emotionally, you’ll abandon the system at the worst possible moment.
- Losing streaks: with a 40% win rate, statistics suggest you should expect a run of around 12 consecutive losses somewhere in 500 trades. At 1% risk per trade, that’s survivable. At 5%, it isn’t.
- Out-of-sample testing: optimize on one period, then test on data the system has never seen. Follow it with forward testing on paper or small size for at least 30 to 50 trades.
- Regime risk: a system tuned in a bull trend can fail in a range, a crash, or a news-driven spike. Token unlocks, sharp Bitcoin dominance shifts, and crowded derivatives positioning (extreme funding rates or open interest) can break otherwise reliable setups overnight.
Spotting a signal-provider scam
Investment fraud is big business.
The FBI’s Internet Crime Complaint Center reported that cryptocurrency investment fraud alone topped $3.9 billion in losses in 2023. Fake signal groups are a common entry point.
- Guaranteed returns. No legitimate trader guarantees profits. Ever.
- Anonymous or missing track records. If you can’t see every call, timestamped, including losers, the record doesn’t exist.
- Deleted losing calls. Channels that quietly remove failed trades show a fake 90% win rate. Screenshot calls yourself and check back later.
- Unverifiable profit screenshots. Anyone can fake a P&L image in seconds. Exchange-verified or third-party-tracked results are the minimum standard.
- Referral pressure. When recruiting new members earns more than the trading does, you’ve found a marketing scheme, not a trading service.
- Requests to send funds to a “managed” wallet. This is the biggest red flag of all. A signal provider never needs custody of your money.
FAQ
What is the most accurate crypto buy and sell indicator?
No single indicator is the most accurate across all conditions. RSI shines in ranging markets, moving averages in trends, and Bollinger Band squeezes ahead of volatility expansions. Accuracy comes from context, confirmation, and risk management, not from the tool itself.
Any provider claiming one indicator beats all others is overselling.
How do I know when to buy or sell crypto?
You know it’s time to act when trend, structure, volume, and invalidation all line up before you enter. Use this quick checklist:
- Is the higher-timeframe trend aligned with the trade?
- Is price at a meaningful support or resistance level?
- Is volume confirming the move?
- Do you know exactly where the idea is invalid, and how much you’ll lose there?
If any answer is no, wait.
Are crypto trading signals worth it?
Crypto trading signals are worth it only when you validate them and pair them with strict risk management.
As standalone profit guarantees, they aren’t worth anything.
A good signal service saves you screen time and surfaces ideas, but you still own the entry, stop, size, and exit. Treat signals as a shortlist of trade candidates, not instructions.
Can AI predict crypto buy and sell signals?
AI can identify statistical patterns in price and volume data, but it cannot reliably predict crypto prices. Machine learning models learn from historical regimes, so they struggle when the market shifts into conditions they haven’t seen. Sudden news events, such as exchange collapses, regulatory rulings, or hacks, are essentially unpredictable from chart data.
Use AI tools as pattern scanners, then validate their output like any other signal.
What is the best combination of indicators for crypto trading?
The best combination pairs indicators that measure different things: trend, momentum, volume, and volatility. A practical setup is a 50 and 200 EMA for trend, RSI for momentum and divergence, volume or VWAP for participation, and ATR for stop placement.
Avoid stacking RSI, stochastic, and similar oscillators together, since they measure the same price behavior and create false signal confluence.
How reliable are Telegram and Discord crypto signals?
Telegram and Discord signal groups vary enormously in reliability, and most cannot prove their results. A small number publish complete, timestamped records; many delete losing calls or run pump-and-dump schemes.
Follower counts mean nothing, because followers can be bought.
Judge a group only by a verifiable track record that includes every loss, and never send funds to anyone running it.
The one habit that separates signal followers from traders
Here’s the uncomfortable truth after everything above.
The signal source matters less than what you do in the 60 seconds after you see it.
Signal followers react.
They see the alert, feel the urgency, and click.
Traders pause, check context, look for confirmation, and decide what being wrong will cost before anything else. Over hundreds of trades, that pause is the difference between a growing account and an empty one.
Durable results don’t come from finding a better alert.
They come from validating every alert with market structure, multi-timeframe analysis, and fixed risk rules, then measuring whether the whole process has positive expectancy.
So try this tonight.
Before you act on any crypto buy sell signal, write down two numbers on paper: the invalidation level and the position size. If you can’t fill in both, you don’t have a trade.
You have a hunch.
It sounds almost too simple.
It isn’t.
That single habit forces you through context, structure, stop-loss placement, and position sizing in one step.
A signal only starts the decision. Risk management finishes it.
Sources
Risk Disclaimer: Trading involves risk. Past performance doesn't guarantee future results. Only trade with money you can afford to lose. PipTrend is a tool to assist your trading decisions, not financial advice.