
Imagine consistently catching the biggest trends while sidestepping the chaos of false signals. If you've ever felt frustrated by missed trades or whipsaw action, you're not alone.
Multi timeframe trading gives you an edge by combining analysis across different chart periods, helping you make smarter choices in fast-moving markets. This guide will show you how to master multi timeframe trading, from foundational concepts to step-by-step execution.
You'll discover how professional traders use this technique to filter out noise, align with major trends, and boost consistency. In fact, traders using multi timeframe trading report higher win rates and fewer false signals.
Ready to transform your trading results? Dive in to learn strategies, tools, and tips for mastering multi timeframe trading in 2025.
What is Multi Timeframe Trading?
Understanding multi timeframe trading is essential for anyone looking to elevate their strategy in today’s markets. Unlike single timeframe analysis, where decisions rely on just one chart period, multi timeframe trading combines several timeframes to deliver a clearer, more reliable picture of market behavior.
By analyzing both the big picture and the fine details, traders can avoid tunnel vision and make more informed decisions. Let’s break down exactly how this works and why it matters.
Definition and Core Concepts
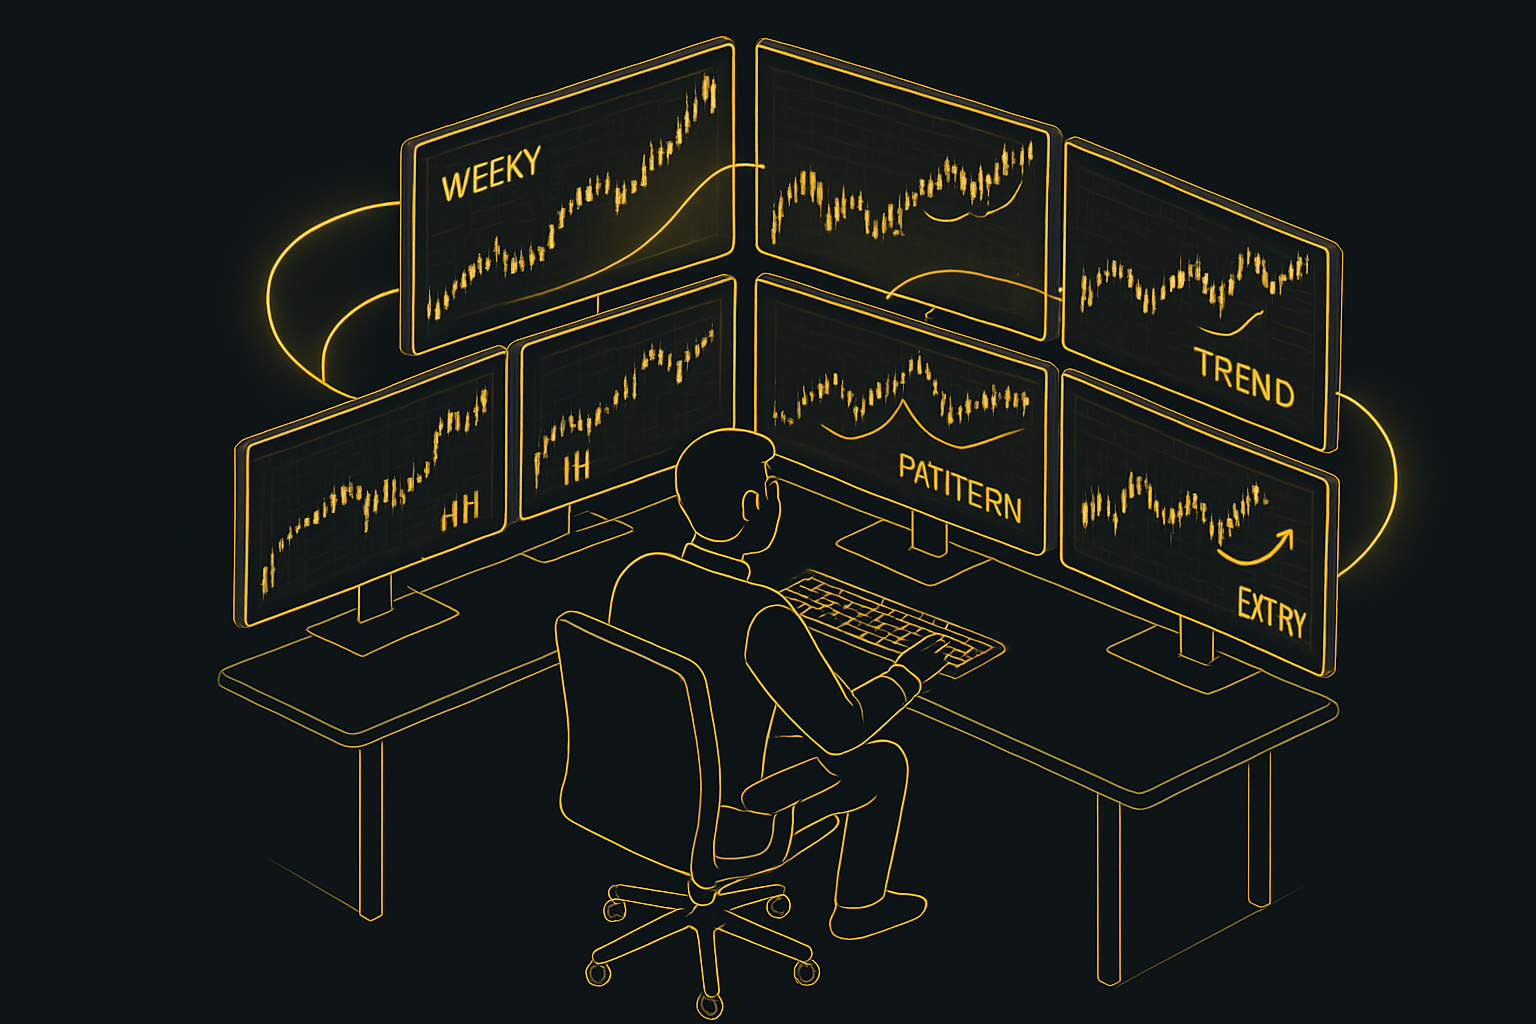
Multi timeframe trading is the practice of analyzing the same asset across several chart periods to gain both a macro and micro perspective on price action. This approach differs from single timeframe analysis, which can leave traders vulnerable to false signals or missing the broader trend.
Think of it like zooming in and out on a map. The higher timeframes, such as weekly or daily charts, reveal the overall trend and major support or resistance zones. Meanwhile, lower timeframes like 15-minute or 5-minute charts offer precise moments for entry and exit.
Common timeframes used in multi timeframe trading include:
| Timeframe | Purpose |
|---|---|
| Weekly | Macro trend, major levels |
| Daily | General trend, S/R zones |
| 4H | Swing setups, momentum |
| 1H | Patterns, fine-tuning |
| 15M/5M | Entry/exit signals |
For example, a bullish signal on the 15M chart carries much more weight if the daily trend is also bullish. This alignment helps filter out trades that go against the prevailing market direction.
Professional traders overwhelmingly use at least two timeframes in their analysis, according to competitor data. However, a common misconception is that adding more timeframes always leads to better accuracy. In reality, too many can cause confusion and indecision.
To dive deeper into the fundamentals and practical applications, check out Multi Timeframe Trading Basics for a comprehensive introduction.
The Hierarchical Framework of MTF Analysis
Multi timeframe trading follows a clear hierarchy that structures your analysis from the top down. Higher timeframes are used first to identify the dominant trend and significant support or resistance areas. This gives you the context needed to avoid trades that fight the overall market movement.
Next, medium timeframes help pinpoint setups and chart patterns that are forming within that larger trend. These might include flags, triangles, or pullbacks that signal an upcoming move.
Finally, lower timeframes allow for precise entries and exits. By timing trades on these smaller charts, you can minimize risk and maximize reward.
A typical workflow for a day trader might look like this:
- 4H chart: Identify the main trend direction.
- 1H chart: Spot potential setups or consolidation patterns.
- 15M chart: Execute entry when the signal aligns with the higher timeframes.
This top-down approach reduces emotional decision-making and helps traders focus only on the highest-probability trades. By following a structured process, multi timeframe trading offers a powerful edge in any market environment.
Why Multi Timeframe Trading Works: 5 Key Benefits
Missing the big picture or getting whipsawed by false signals can be incredibly frustrating for traders. That’s why multi timeframe trading stands out as a reliable strategy for navigating today’s markets. By leveraging multiple chart periods, traders gain a deeper, more accurate view—leading to smarter decisions, better timing, and less emotional stress.
Align with the Dominant Trend
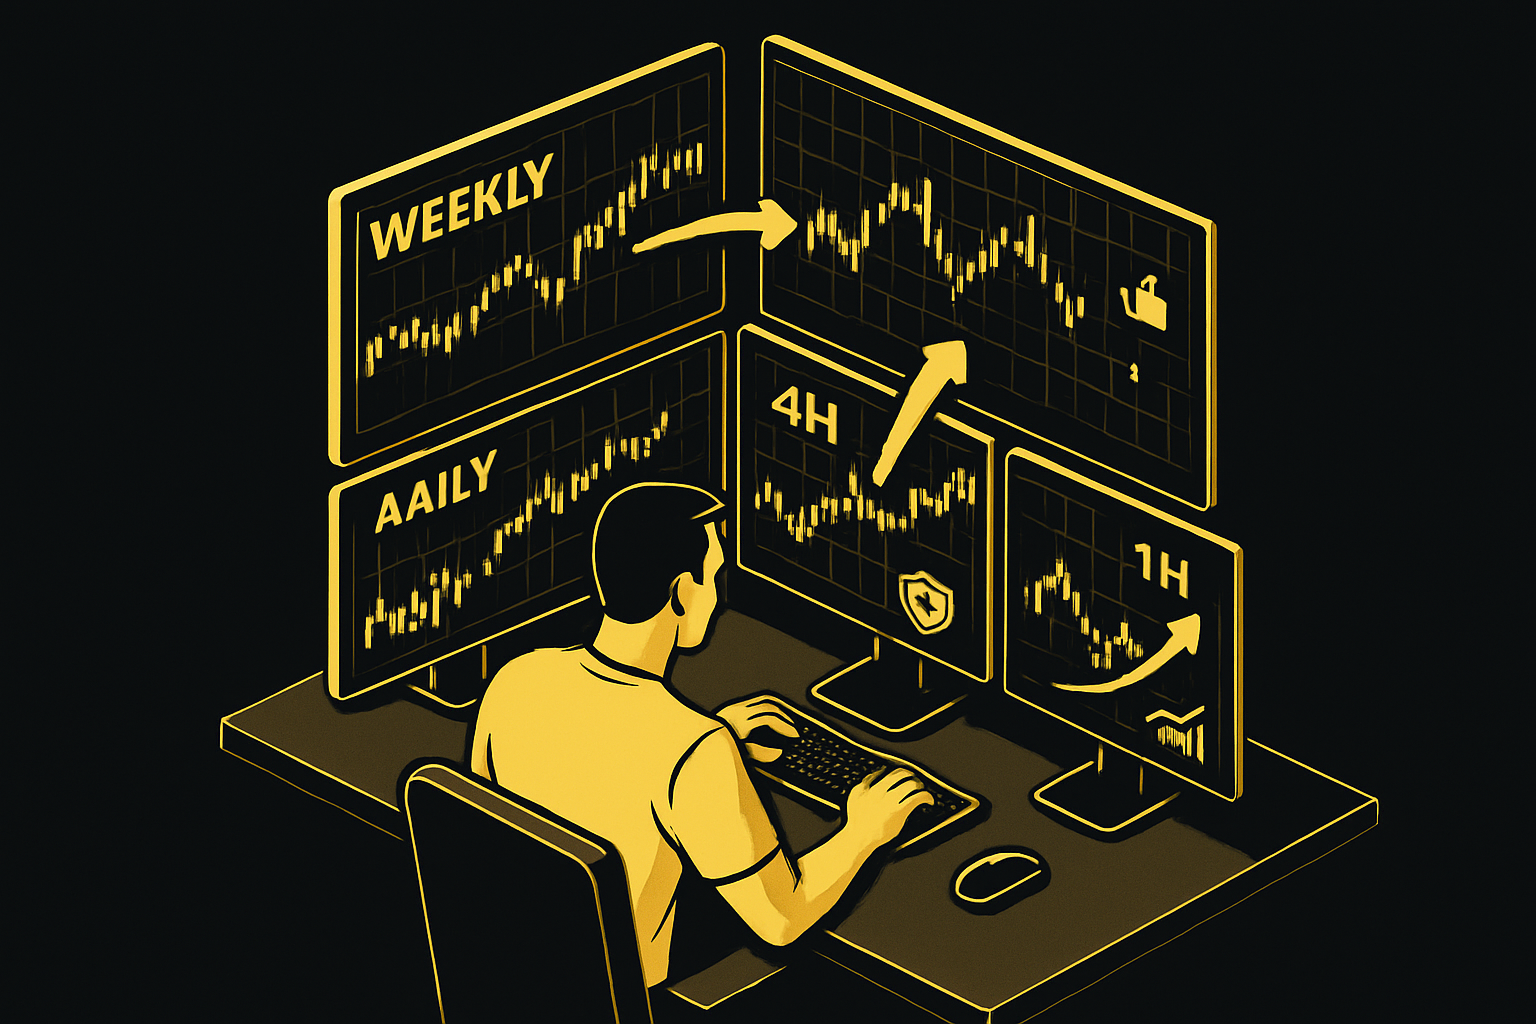
Trading with the main trend is crucial for success. Multi timeframe trading ensures you don’t get caught trading against the prevailing direction. For example, a trader who only looks at a 15-minute chart might see a bullish setup, but if the daily trend is bearish, this trade is likely to fail. Using multiple timeframes keeps you moving with the market, not against it.
Filter Out False Signals
Lower timeframes are notorious for producing noisy, unreliable signals. By referencing higher timeframes, you can quickly spot setups that are likely to fail. Suppose you see a breakout on a 15-minute chart, but the daily chart shows strong resistance nearby. Multi timeframe trading helps you avoid these traps and focus only on high-probability trades.
Improve Entry and Exit Timing
Multi timeframe trading lets you zoom in for precision. After confirming the trend and setup on higher charts, you can use a lower timeframe to pinpoint the exact entry. For instance, if the 4-hour chart is trending up and the 1-hour shows a bullish reversal candle, entering on a 15-minute confirmation can significantly improve your timing and reduce risk.
Build Trading Confidence
When multiple timeframes align, your conviction grows. This confluence reduces hesitation and second-guessing, allowing you to manage trades more effectively. Studies have shown that traders using multi timeframe trading report more consistent results and fewer false signals, as highlighted in Multi-Timeframe Analysis: The Key to Better Trading Decisions.
Enhance Risk Management
Setting stop-losses and take-profits based on higher timeframe levels adds logic to your risk management. For example, you might place a stop just below daily support, then wait for a 15-minute confirmation to enter. This technique reduces random stop-outs and leads to exits that make sense within the broader trend.
Ultimately, multi timeframe trading isn’t about taking more trades—it’s about taking better ones. By aligning with dominant trends, filtering noise, improving timing, boosting confidence, and managing risk more effectively, you set yourself up for long-term consistency in the markets.
Best Timeframe Combinations for Every Trading Style
Choosing the right timeframe combinations is the backbone of successful multi timeframe trading. The right mix helps traders see the big picture, spot precise setups, and time entries with confidence. Let’s break down the optimal combinations for every trading style so you can match your strategy to your schedule and market.
Day Trading Combinations
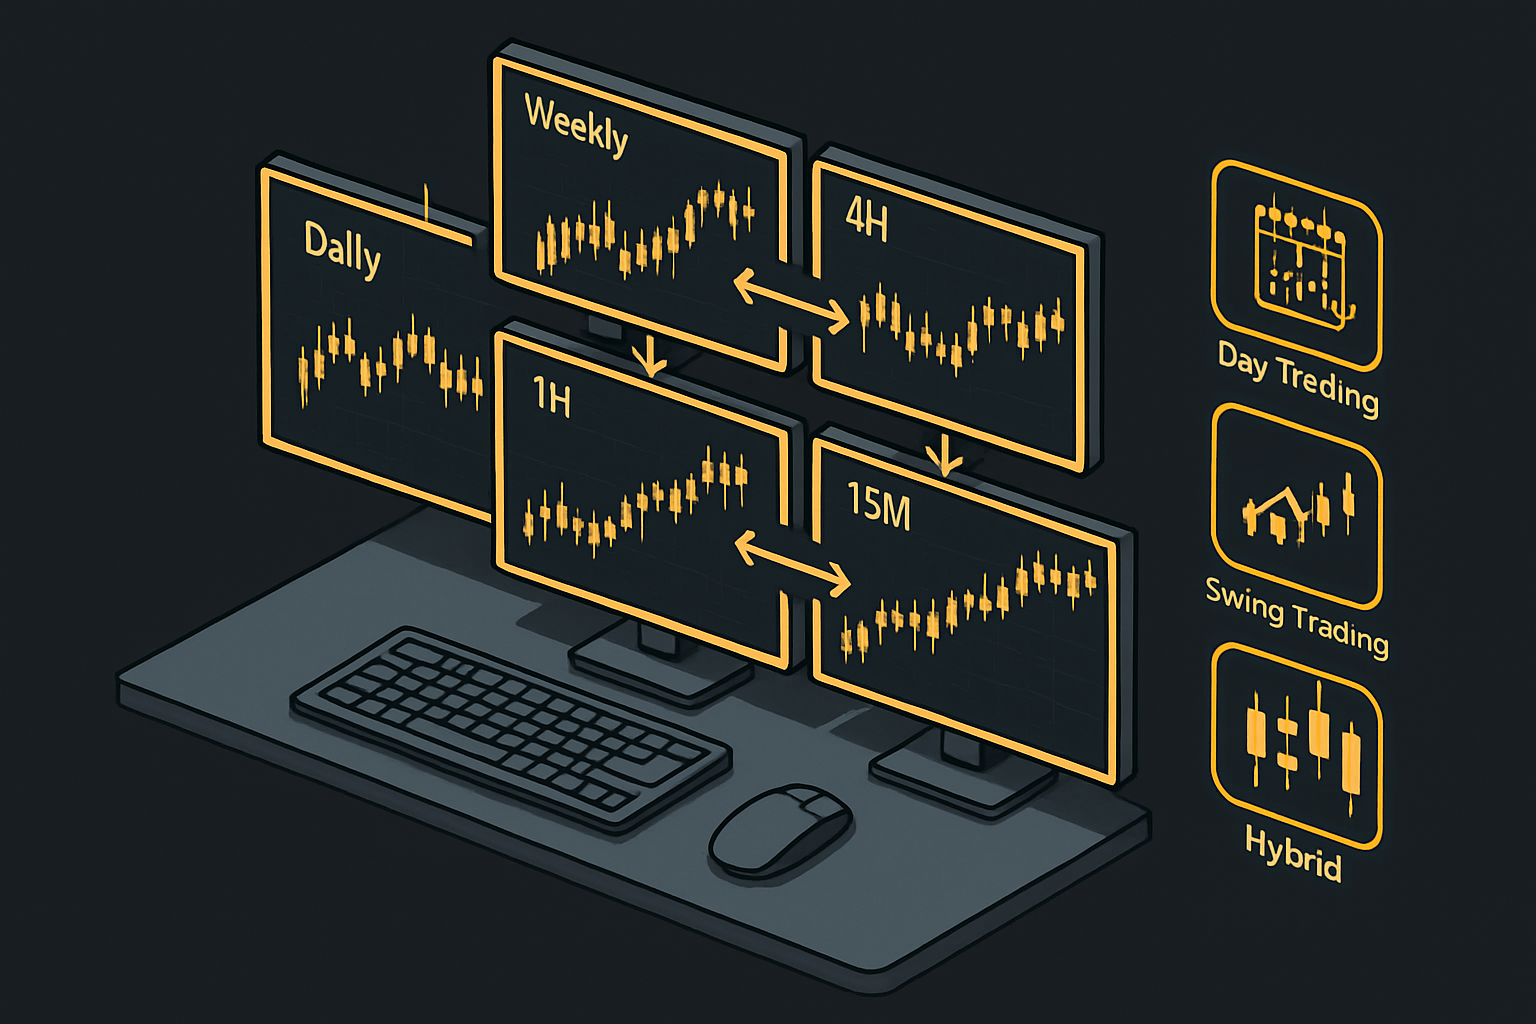
Day traders thrive on catching intraday moves, so picking the right timeframe stack is crucial for multi timeframe trading. The classic triple—15M/1H/4H—offers a clear structure: 4H for the trend, 1H for setups, and 15M for entries. This setup ensures you’re not fighting the dominant direction.
For those who prefer rapid-fire trades, the scalper’s combo (5M/15M/1H) allows ultra-fast execution without losing sight of the broader context. Here’s a quick comparison:
| Trading Style | Trend | Setup | Entry |
|---|---|---|---|
| Classic Day | 4H | 1H | 15M |
| Scalper | 1H | 15M | 5M |
Many beginners in multi timeframe trading start with just two timeframes to avoid overcomplicating their process. A common tip: maintain a 4:1 or 5:1 ratio between timeframes for optimal clarity, as supported by industry statistics.
Swing Trading Combinations
Swing traders aim to capture moves lasting several days, so their multi timeframe trading approach needs broader context. The standard combination uses 1H for entries, 4H for setups, and daily for trend direction. This trio balances responsiveness with a firm grip on the larger move.
For those seeking even more macro perspective, extending the stack to 4H/Daily/Weekly helps align trades with major cycles. For example, a swing trader might spot a daily uptrend, wait for a 4H pullback, and fine-tune the entry on the 1H chart. This approach reduces false signals and helps hold winning trades longer.
Hybrid and Unconventional Approaches
Some traders blend elements from both day and swing trading for a hybrid multi timeframe trading strategy. One powerful combination is Weekly/Daily/1H. This approach is ideal for those seeking to capture major cycles while retaining flexible entries.
The main advantage is the ability to see the forest and the trees: weekly charts reveal the dominant trend, daily charts highlight intermediate setups, and 1H charts give pinpoint entry points. Professionals sometimes use uneven step ratios to tailor the analysis for specific markets or volatility profiles, creating unique edges.
Choosing the Right Combination
How do you pick the best combination for your multi timeframe trading? Consider your trading style, available screen time, and the volatility of your target market. For instance, forex traders might prefer faster timeframes, while stock traders often use broader intervals.
Consistency is key—stick with your chosen stack to build pattern recognition and confidence. If you want more guidance, check out this in-depth guide on using multiple timeframes in trading for practical tips and examples.
The right combination streamlines your decision-making, filters out noise, and helps you stay in sync with the market’s true rhythm.
Step-by-Step Multi Timeframe Trading Strategy for 2025
Ready to level up your trading in 2025? This actionable, step-by-step approach to multi timeframe trading will help you find high-probability trades, avoid common traps, and boost your consistency. Let’s break down each phase so you can apply this strategy across any market.
Step 1: Identify the Trend on the Higher Timeframe
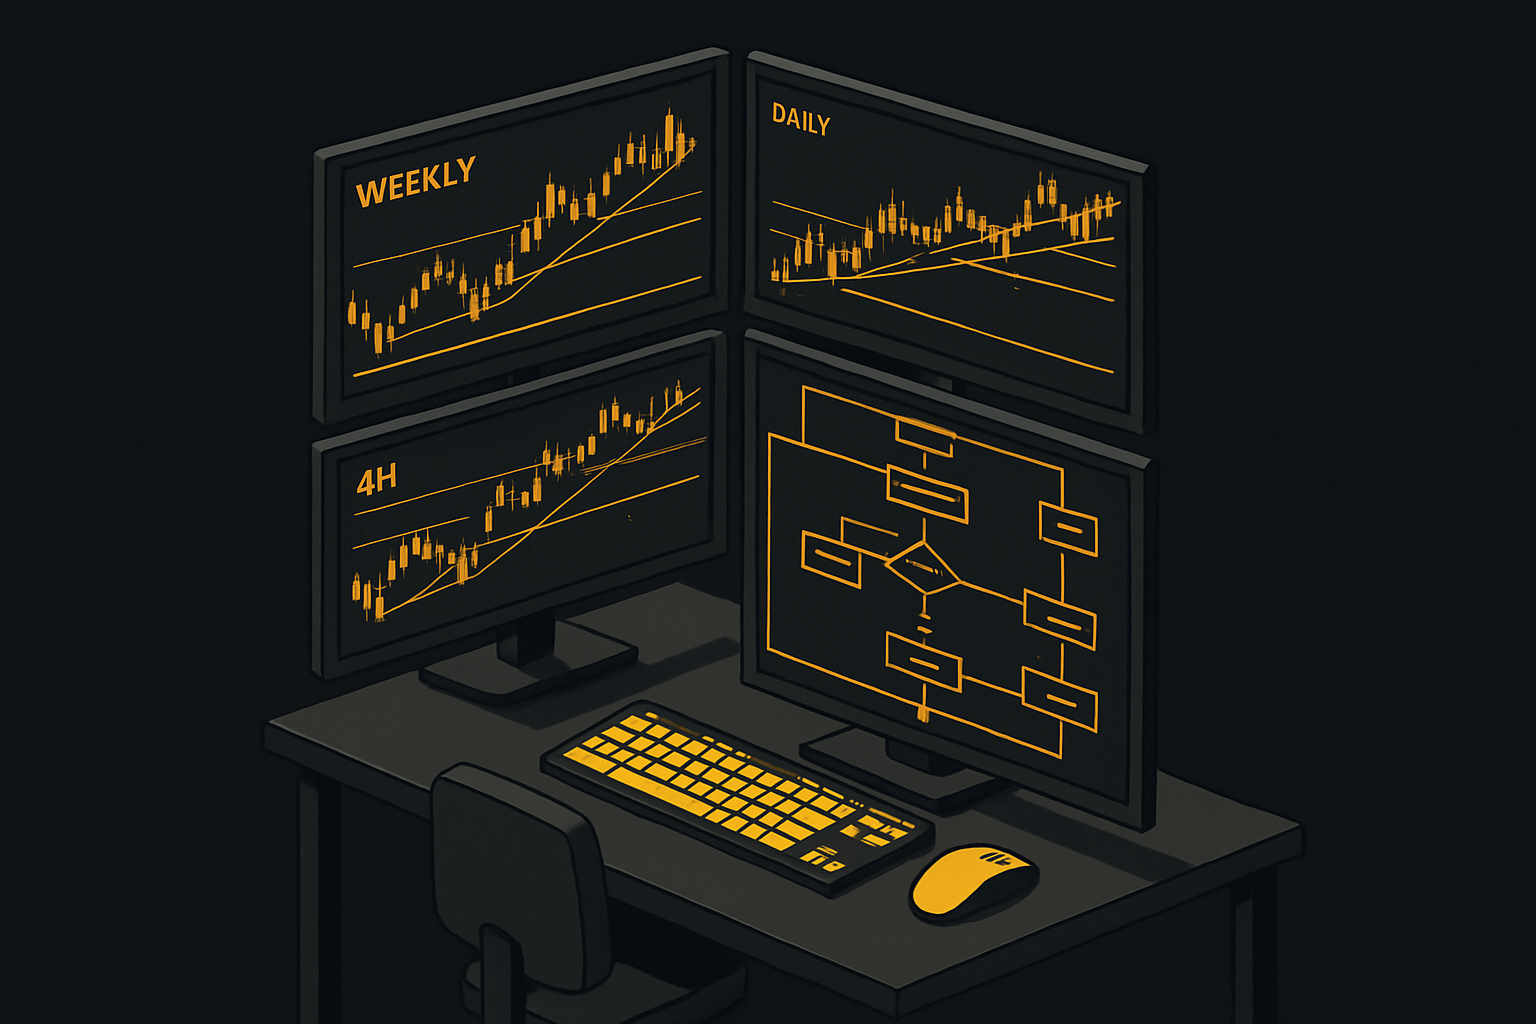
Start your multi timeframe trading journey by analyzing the higher timeframe. This could be the weekly, daily, or 4H chart, depending on your trading style. Look for clear trends: higher highs and higher lows signal an uptrend, while lower highs and lower lows indicate a downtrend.
Many traders use simple tools like the 50-period moving average to confirm the trend. For example, if the daily chart shows a series of higher closes above the 50 MA, you should focus on long setups only. This step is crucial—never ignore the macro context, as trading against the dominant trend often results in losses.
To sharpen your trend analysis, explore Top-Down Analysis Techniques, which help you break down the market structure from the top down for more reliable signals. Using a top-down approach keeps you anchored to the bigger picture throughout your multi timeframe trading process.
Step 2: Spot the Setup on the Medium Timeframe
Once the higher timeframe trend is clear, shift to the medium timeframe, such as the 1H or 4H chart. Here, you’re searching for actionable setups that align with the main trend. Look for classic patterns: bull flags, triangles, head and shoulders, or pullbacks into support within an uptrend.
Support and resistance levels become especially important at this stage. For example, if the 1H chart forms a bullish flag during a daily uptrend, you have a strong setup. Confirm the validity with volume and momentum indicators—rising volume on a breakout is a powerful clue.
If you want a deeper dive into chart patterns, check out Trading Chart Pattern Strategies, a resource designed to help you recognize and trade setups with confidence during multi timeframe trading. Remember, only consider setups that agree with the higher timeframe direction for optimal results.
Step 3: Confirm Entry on the Lower Timeframe
With the setup in place, zoom into the lower timeframe—think 15M or 5M—for precise entries. This is where timing matters most in multi timeframe trading. Look for price action signals like bullish engulfing candles, pin bars, or breakout moves at key levels identified on higher charts.
Volume spikes and momentum surges can further confirm your entry. For example, a 15M bullish engulfing candle forming at 1H support, with volume increasing, stacks the odds in your favor. Set your entry, stop-loss, and take-profit based on the higher timeframe’s context, not just the lower chart’s noise.
A quick checklist for lower timeframe entries:
- Wait for a clear price action signal.
- Confirm with volume or momentum.
- Align stop-loss with higher timeframe support/resistance.
- Enter only when all conditions match your multi timeframe trading plan.
Step 4: Execute and Manage the Trade
Now, it’s time to execute. Enter the trade only after all chosen timeframes confirm your idea. Use the lower timeframe for active trade management—watch for potential reversal signals or opportunities to trail your stop.
Adjust your targets as new data emerges on the higher timeframes. For instance, if the 4H chart begins to lose momentum, tighten your stop or consider partial profit-taking. Multi timeframe trading is dynamic, so staying flexible is key.
A sample workflow:
- Entry: Confirmed across all timeframes.
- Stop-loss: Placed below higher timeframe support.
- Take-profit: Set at logical resistance or according to your risk-reward plan.
- Exit: Monitor for reversal on the lower timeframe, but always respect the higher timeframe context.
Step 5: Review and Refine
After the trade is closed, take time to review your process. Did all timeframes align as planned? Was your setup valid and well-timed? Keeping a detailed trading journal is essential for improving your multi timeframe trading skills.
Continuous review will help you spot patterns in your performance—both strengths and weaknesses. Backtest your approach regularly, and don’t hesitate to refine your strategy as you learn. Many successful traders also seek mentorship or join trading communities to accelerate their learning curve.
Remember, the goal of multi timeframe trading is to systematize your decisions, reduce emotions, and boost your consistency. The more structured your approach, the more likely you’ll achieve reliable results in 2025 and beyond.
Multi Timeframe Trading Flowchart Checklist
| Step | Action | Example |
|---|---|---|
| Higher Timeframe Trend | Analyze trend, support/resistance | Daily uptrend, focus on longs |
| Medium Timeframe Setup | Identify patterns, confirm with indicators | 1H bull flag, volume rising |
| Lower Timeframe Entry | Wait for price action & volume confirmation | 15M engulfing candle at support |
| Execution & Management | Enter, set stops/targets, monitor for reversals | Trail stop as 4H momentum slows |
| Review & Refine | Journal results, backtest, seek feedback | Note if timeframes aligned, adjust plan |
By sticking to this checklist, you’ll build discipline and clarity in your multi timeframe trading journey.
Advanced Tips, Tools, and Common Pitfalls in Multi Timeframe Trading
Unlocking the full potential of multi timeframe trading requires more than just knowing how to read different charts. Success comes from applying advanced techniques, leveraging the right tools, and sidestepping common traps that trip up even experienced traders. Let’s dive into the key strategies, essential resources, and psychological factors that separate consistently profitable traders from the rest.
Advanced Tips for MTF Success
Approaching multi timeframe trading with the right mindset can make a remarkable difference. Prioritize quality over quantity. Instead of chasing every signal, focus on high-probability setups that align across your chosen timeframes.
Volume confirmation is another powerful filter. Check if volume supports price action on both higher and lower timeframes. For example, a breakout on the 1H chart means little if the 4H volume is weak. Look for volume divergence to confirm real momentum shifts.
Keep your process simple. Limit your analysis to two or three timeframes. More isn’t always better—too many charts can cloud your judgment. For example, many traders find success by using just the daily, 1H, and 15M charts.
If you want to dive deeper into advanced strategies, Mastering Multiple Timeframe Trading Strategies offers insights into risk management and the nuances of multi timeframe trading.
Essential Tools for Efficient MTF Analysis
The right tools bring clarity and speed to multi timeframe trading. Start with a charting platform like TradingView, which allows you to view multiple charts side by side. This setup makes it easy to track the same asset across daily, 4H, and 15M timeframes in real time.
Key indicators include moving averages for trend direction, RSI and MACD for momentum, and volume tools to confirm setups. Set automated alerts for key support, resistance, or pattern completion, so you never miss a critical move.
For deeper market insight, the Currency Strength Meter Tool is invaluable. It helps you assess the relative strength of currencies across different timeframes, adding an extra layer of confirmation to your trades.
Here’s a quick tool comparison:
| Tool | Use Case | Benefit |
|---|---|---|
| TradingView Multi-Chart | Chart multiple timeframes | Instant visual context |
| Moving Averages | Trend direction | Quick trend filter |
| Volume Indicators | Confirmation across timeframes | Validate setups |
| Currency Strength Meter | Market strength across timeframes | Confirms trade bias |
Common Mistakes and How to Avoid Them
Even skilled traders can fall into traps when practicing multi timeframe trading. Analysis paralysis is a big one—constantly switching between charts can overwhelm you and stall decision-making. Stick to your chosen timeframes and avoid overcomplicating your process.
Chasing signals is another pitfall. Entering trades on a lower timeframe without higher timeframe confirmation often leads to whipsaws. Always check if your entry aligns with the dominant trend.
Ignoring context is risky. For example, shorting a 15M pullback during a strong daily uptrend is a classic recipe for losses. Most failed multi timeframe trading attempts stem from misalignment or skipping crucial steps.
To sharpen your awareness of these pitfalls, review guides like Mastering Multiple Timeframe Trading Strategies for practical examples and solutions.
The Psychology of Multi Timeframe Trading
Mastering the mental side of multi timeframe trading is just as vital as technical skills. When you see confluence across timeframes, your confidence naturally increases. But beware—confidence can tip into overconfidence, leading to oversized positions or ignoring warning signals.
Emotional discipline is your anchor. Stick to your process, not just the signals. For instance, if you’re tempted to “revenge trade” after a loss, review your multi timeframe trading checklist before acting. This habit helps you avoid impulsive decisions and keeps your trading on track.
Building a routine of checking all timeframe signals before entering or exiting a trade fosters consistency. Over time, you’ll find that following your process reduces stress and improves results.
Continuous Improvement
The journey to mastering multi timeframe trading never truly ends. Backtesting your strategies across different market conditions reveals what works and where you can improve. Log every trade, noting which timeframes aligned and how decisions played out.
Joining trading communities or finding a mentor accelerates your growth. Learn from others’ experiences, share ideas, and stay up to date with new techniques. Treat multi timeframe trading as a skill—each session is a chance to refine your edge.
Remember, structured practice and regular review are your best allies. The more intentional you are with your process, the more consistent your trading performance will become.
Now that you’ve seen how multi timeframe trading can boost your win rate and confidence, why not put these strategies into action? With PipTrend, you don’t have to worry about missing key signals or second-guessing your analysis—the AI does the heavy lifting, giving you crystal-clear buy and sell signals across all your favorite markets. Whether you’re new to trading or looking to sharpen your edge, PipTrend makes multi timeframe analysis simple and effective. If you’re ready to start catching the right moves and making smarter trades, Start Catching Winning Trades, Right Now!