On this page
Why Chart Patterns Aren’t Magic Signals
Ask ten traders what a head and shoulders means and you’ll get ten answers. Ask them what they’d do if the neckline breaks and closes back above it within two candles, and most go quiet.
That gap is the whole problem.
A trading chart pattern is a recurring price structure that reflects shifting supply and demand across time. It is a snapshot of who is in control, who is trapped, and where orders are stacking up.
It is not a forecast.
Patterns deal in probabilities. A textbook double bottom in a strong uptrend with a clean retest behaves very differently from the same shape printed into a major weekly resistance level during a high-volatility news week.
Same picture, different odds.
The shape tells you what happened. Context tells you what it’s worth.
This guide walks through the full decision process rather than a gallery of drawings. You’ll get eight steps: reading context, identifying the structure, waiting for confirmation, choosing an entry, defining the invalidation point, setting a target, sizing the risk, and reviewing the outcome afterwards.
The most common beginner mistake is skipping straight to memorization. You learn twelve shapes, spot one on a 5-minute chart, and enter because it looks like the diagram.
No trend context.
No breakout confirmation.
No stop-loss placement.
No idea what invalidates the idea.
That’s not technical analysis.
That’s pattern-matching with real money attached.
Patterns earn their keep when they sit inside a process that defines risk before reward, respects higher-timeframe market structure, and produces data you can actually review.
Everything below builds that process.
What Makes a Chart Pattern
Here’s a test: can you draw the pattern’s boundaries with two lines and point to the exact price where you’d admit you were wrong?
If not, you don’t have a pattern.
You have a hopeful squiggle.
What Makes a Valid Pattern
Valid chart patterns form over multiple candles, usually a minimum of 15 to 20 bars for reversal structures and 5 to 15 for continuation structures.
A three-candle wiggle on a 1-minute chart is noise wearing a costume.
Three conditions have to hold before a formation counts.
First, a recognizable prior move.
Continuation patterns need a trend to continue. Reversal patterns need a trend to reverse.
A head and shoulders that forms sideways in a range isn’t reversing anything, because there’s nothing to reverse.
Second, definable boundaries.
You should be able to connect at least two swing highs and two swing lows with trendlines, or mark a horizontal neckline across clear reaction points.
If your lines need to be redrawn every time price moves, the structure isn’t there yet.
Third, measurable structure.
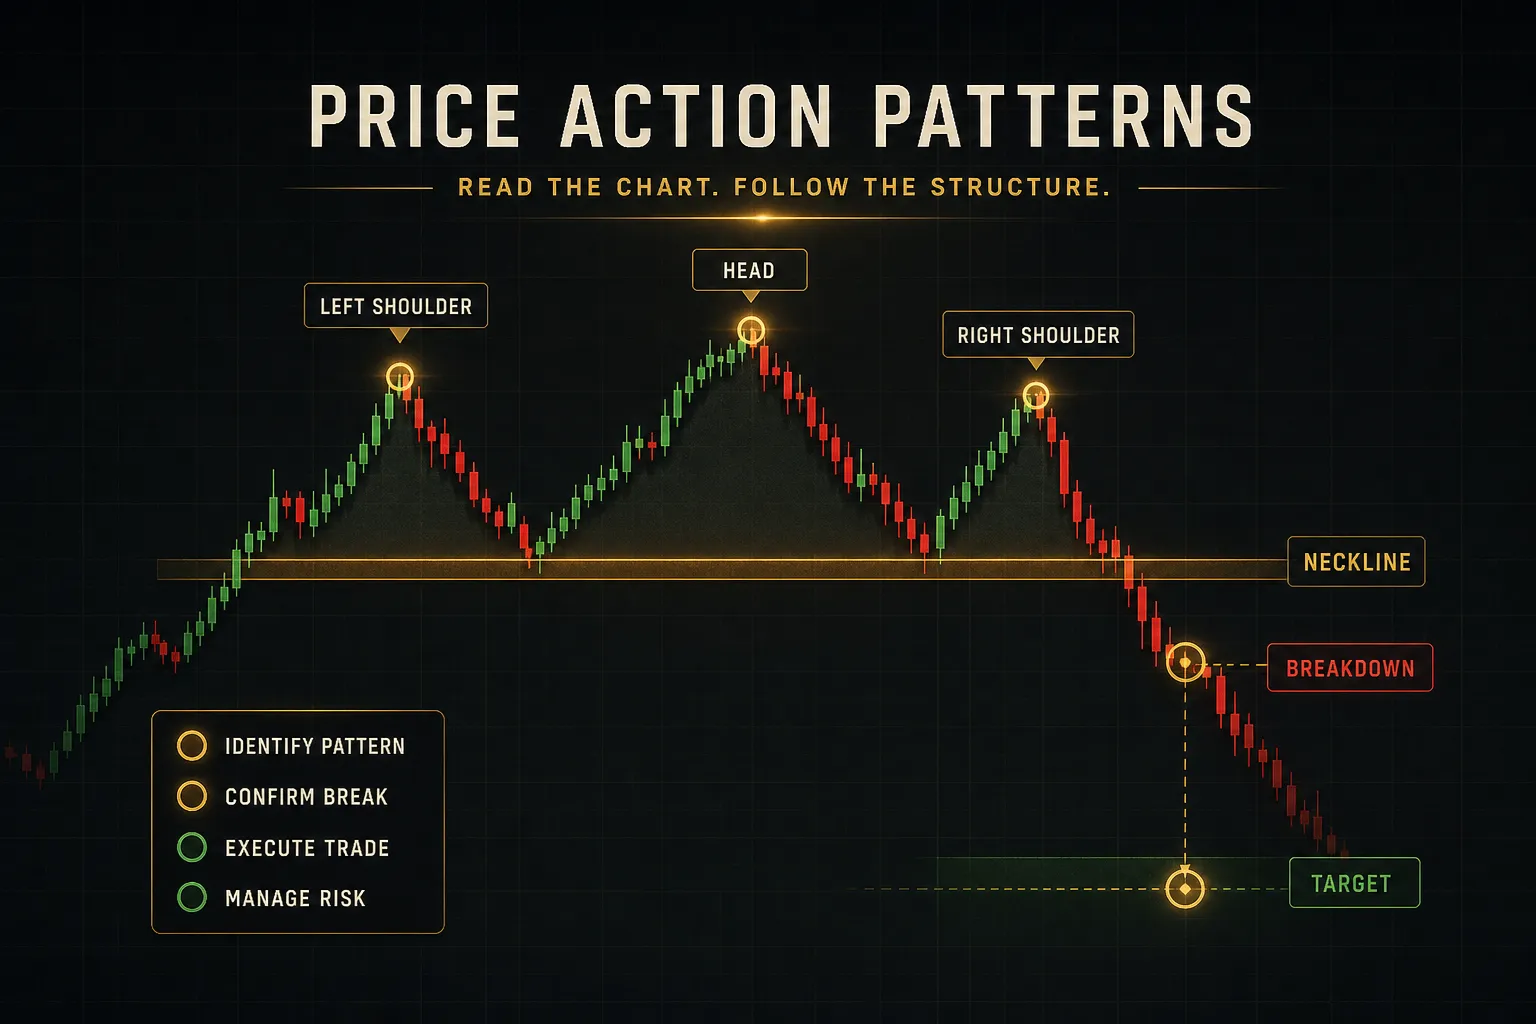
The pattern needs a height you can measure, because that measurement drives your target. A double top with a 40-point distance between the peaks and the neckline gives you a 40-point measured move projection.
No measurable height means no objective target.
Symmetry matters less than most guides suggest. Real head and shoulders patterns rarely have level shoulders.
What matters is whether the neckline is defensible as support and resistance.
Continuation vs Reversal
Continuation patterns represent a pause.
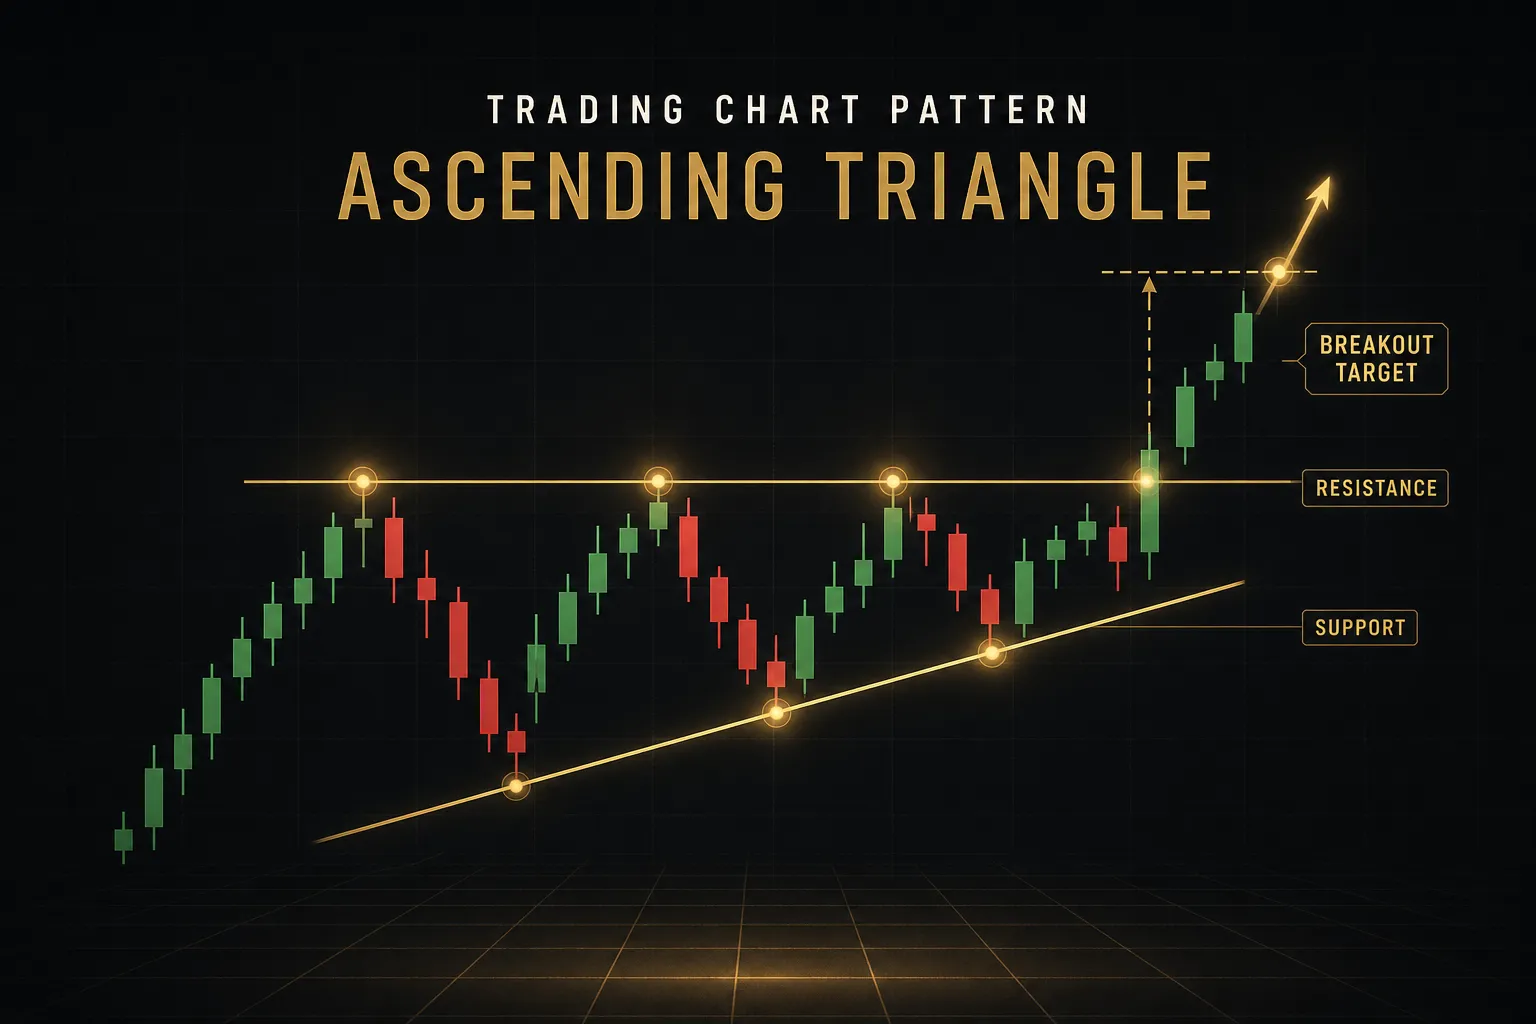
Price has moved hard, participants take profit, the market consolidates sideways or drifts against the trend, and then the dominant side pushes again. Flags, pennants, and ascending or descending triangles all fall here.
The logic is straightforward: a strong trend absorbs supply. When the pullback is shallow and brief, sellers are weak.
The break usually goes in the direction of the prior impulse.
Reversal patterns represent exhaustion.
Each attempt to push higher fails a little earlier, momentum fades, and eventually the structure of higher highs and higher lows breaks. Head and shoulders, double tops, double bottoms, and triple tops sit in this group.
The distinction is not cosmetic.
It changes where your stop goes, which direction you’re biased, and what the target measurement means.
A trader who mislabels a bear flag as a double bottom is trading against the trend without knowing it.
Patterns vs Candlesticks
This is where most beginner material creates confusion.
Candlestick patterns and chart patterns are two separate analytical layers, and they operate on completely different scales.
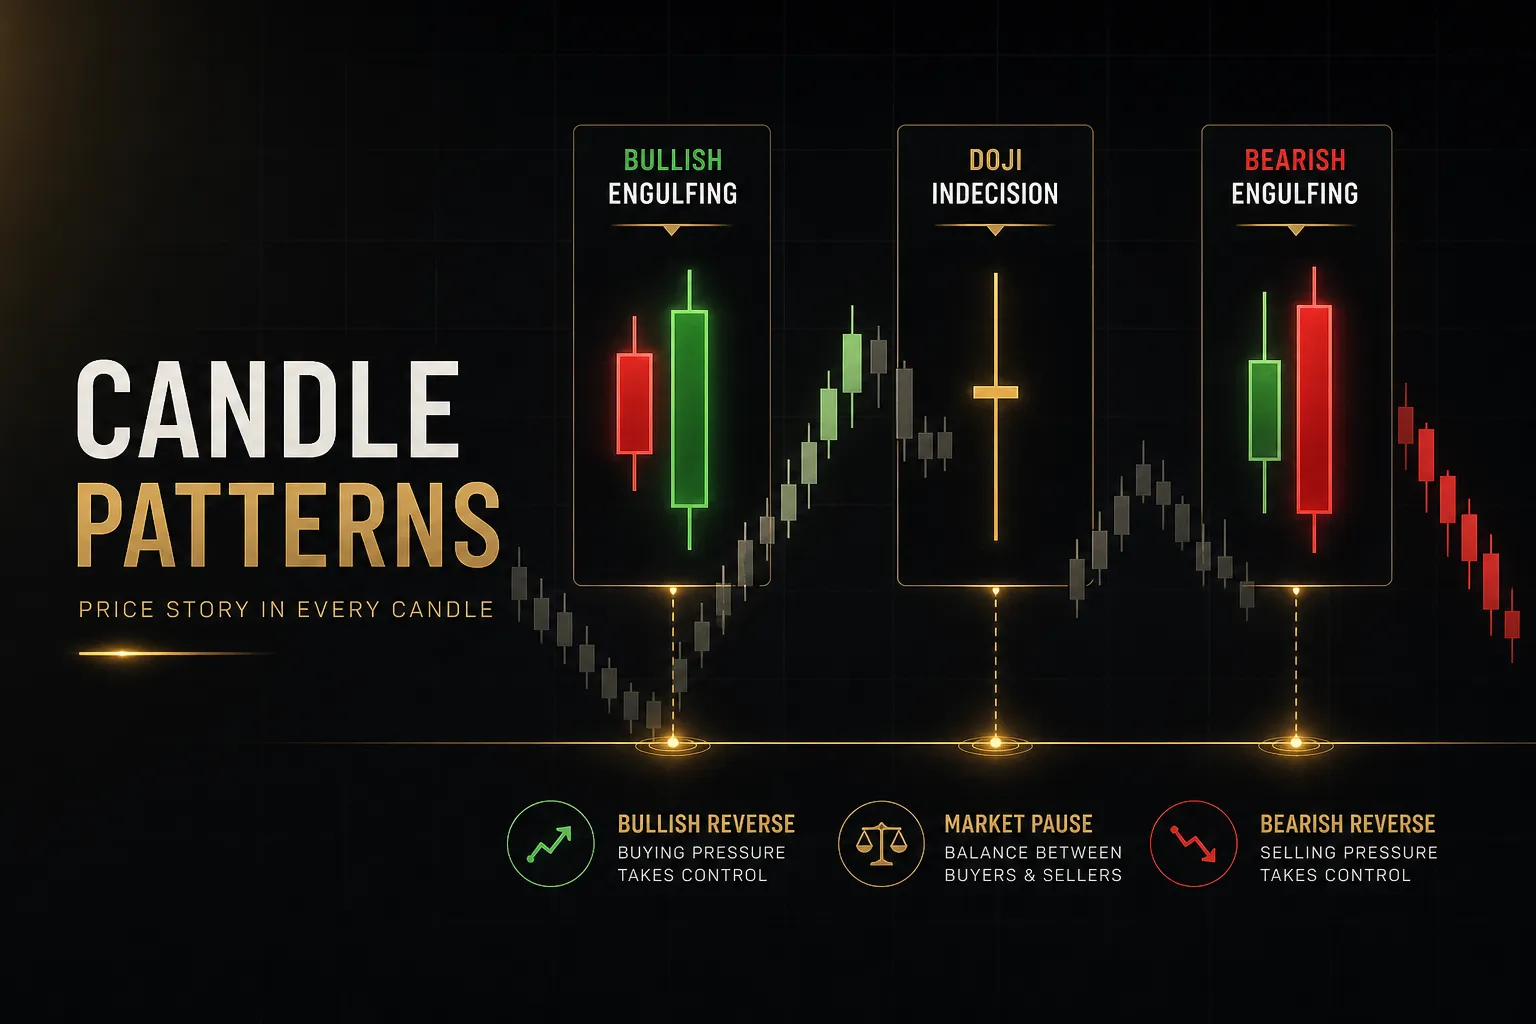
Candlestick patterns form on one to three candles.
Doji, engulfing, hammer, shooting star, morning star.
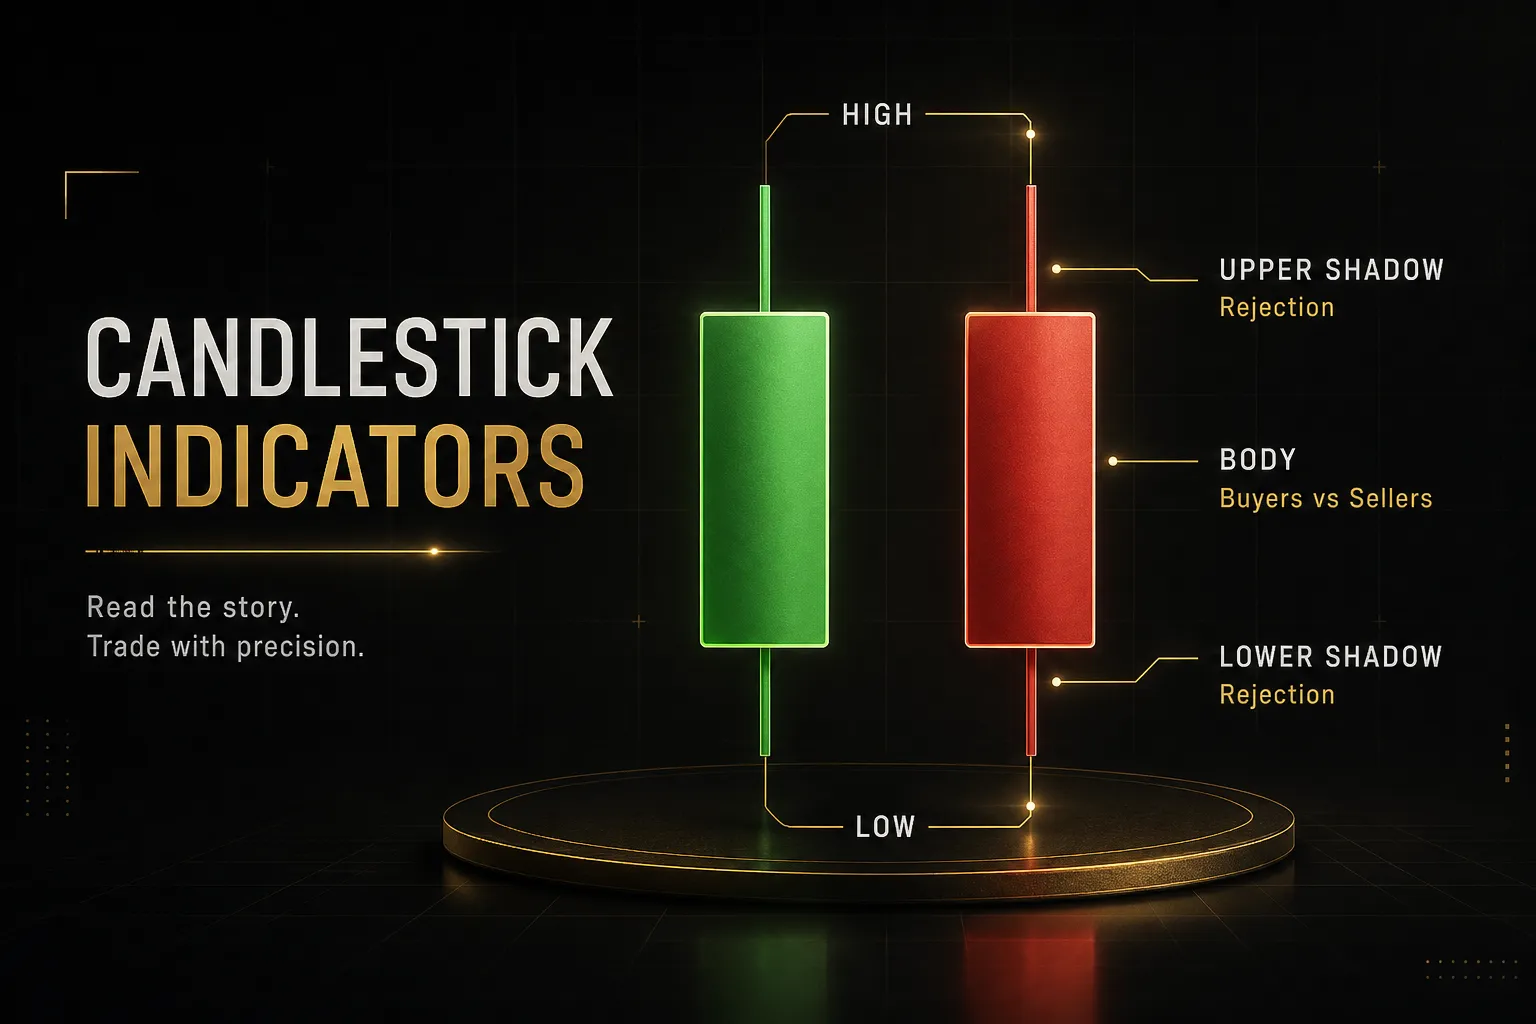
They describe what happened inside a single session or bar: where price opened, how far it stretched, where it closed.
They signal short-term shifts in pressure, often lasting a handful of bars.
Chart patterns form over dozens of candles.
They describe broader market structure, accumulation, and distribution over days, weeks, or months depending on your timeframe.
The two work together beautifully when you keep them in their lanes. A bullish engulfing candle at the neckline retest of an inverse head and shoulders is powerful confluence.
But the engulfing candle alone, floating in the middle of a range, tells you almost nothing about direction.
Guides that dump both into one alphabetical list of “20 patterns every trader must know” teach the reader to treat a hammer and a cup and handle as equivalent signals.
They aren’t.
One is a bar.
The other is a three-month structure.
The Patterns Worth Knowing
Forget the encyclopedias with 60 named formations.
Ten cover almost everything you’ll actually trade, and three of those will probably account for most of your setups.
| Pattern | Type | Structure | Completion Trigger | Typical Bars to Form |
|---|---|---|---|---|
| Head and Shoulders | Reversal (bearish) | Three peaks, middle highest, connected by a neckline | Close below neckline | 20-60 |
| Inverse Head and Shoulders | Reversal (bullish) | Three troughs, middle lowest, connected by a neckline | Close above neckline | 20-60 |
| Double Top / Bottom | Reversal | Two failed attempts at the same level, one intervening swing | Close beyond the intervening swing point | 15-40 |
| Triple Top / Bottom | Reversal | Three rejections at one horizontal level | Close beyond the pattern’s opposing boundary | 25-60 |
| Ascending Triangle | Continuation (usually bullish) | Flat resistance above, rising trendline of higher lows below | Close above the flat resistance | 15-40 |
| Descending Triangle | Continuation (usually bearish) | Flat support below, falling trendline of lower highs above | Close below the flat support | 15-40 |
| Symmetrical Triangle | Neutral / continuation | Converging trendlines, lower highs and higher lows | Close beyond either boundary | 15-40 |
| Flag | Continuation | Sharp impulse, then a shallow parallel channel against it | Close beyond the channel in the impulse direction | 5-20 |
| Pennant | Continuation | Sharp impulse, then a tiny converging triangle | Close beyond the converging boundary | 5-15 |
| Wedge (rising / falling) | Reversal or continuation | Both trendlines slope the same way but converge | Close against the wedge’s slope | 15-50 |
| Cup and Handle | Continuation (bullish) | Rounded U-shaped base followed by a small pullback | Close above the handle’s high | 40-150 |
Patterns Best for Beginners
Three stand out: head and shoulders, double tops and bottoms, and flags.
Not because they’re more profitable, but because they’re more objective.
Each has a horizontal or near-horizontal completion line that two traders would draw in roughly the same place. That removes the biggest source of beginner error, which is drawing the boundary wherever it makes the trade look good.
Symmetrical triangles and wedges are harder.
Their boundaries are diagonal, which means the trigger price changes with every bar that passes, and slight differences in trendline anchoring produce meaningfully different entries.
One warning that applies to every row in that table: the same shape means different things in different environments. An ascending triangle in a trending market regime with expanding volatility is a strong continuation signal.
The same triangle in a choppy, mean-reverting range breaks out and fails repeatedly.
And reliability figures vary enormously by sample size, instrument, and timeframe. A study of 500 daily-chart flags in large-cap equities tells you nothing reliable about 15-minute flags in a low-liquidity crypto pair.
No pattern is universally “the best.”
Anyone quoting a single win rate without naming the market and timeframe is selling something.
Spotting and Confirming a Breakout
Most losses on chart patterns don’t come from picking the wrong pattern.
They come from entering before the pattern was finished.
Spotting the Pattern Early
Start with the prior move, not the shape.
Scan for a clear impulse or an established trend first, then look at what price is doing to digest it. This ordering matters because it stops you from finding reversal patterns in markets that never trended.
Mark your swing highs and swing lows before you draw anything.
These are the anchor points.
If you can’t identify at least two clean swings on either side of the structure, the pattern isn’t mature.
Then draw your boundaries and leave them alone.
A useful discipline: once you’ve drawn the neckline or trendline, screenshot it.
If you find yourself nudging the line later to accommodate a candle that broke it, you’re rationalizing.
Watch for contraction.
Genuine patterns tend to show narrowing range as they mature, with each swing covering less ground than the last. You can measure this with average true range, which typically compresses 20 to 40 percent during a healthy consolidation before an expansion move.
Confirming the Breakout
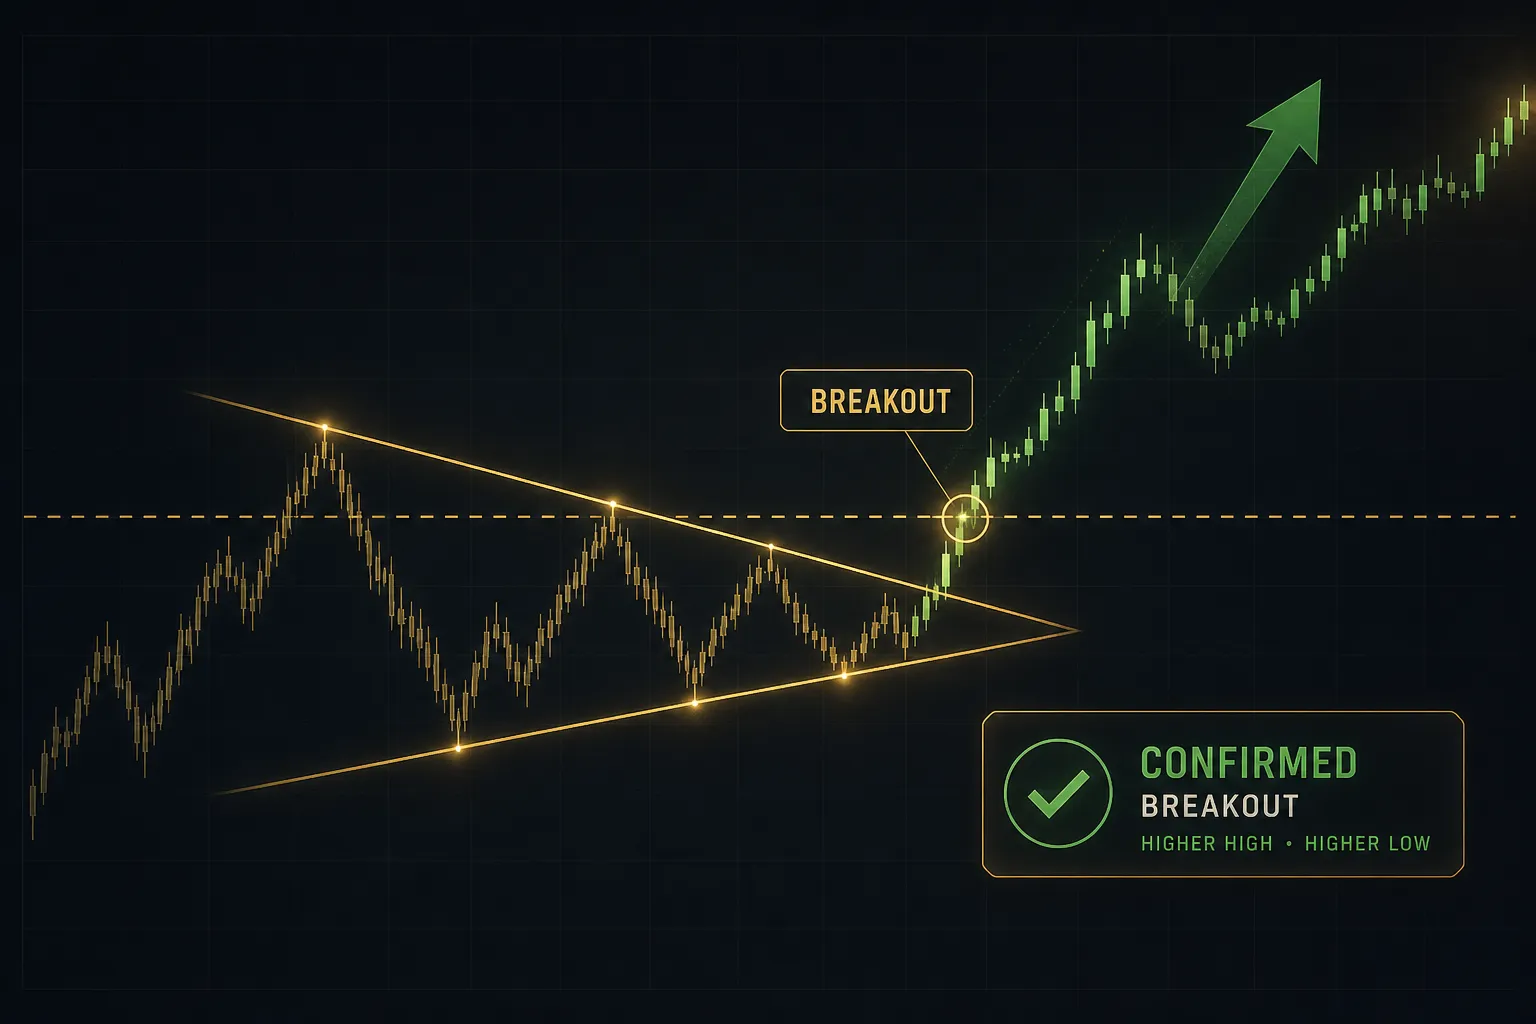
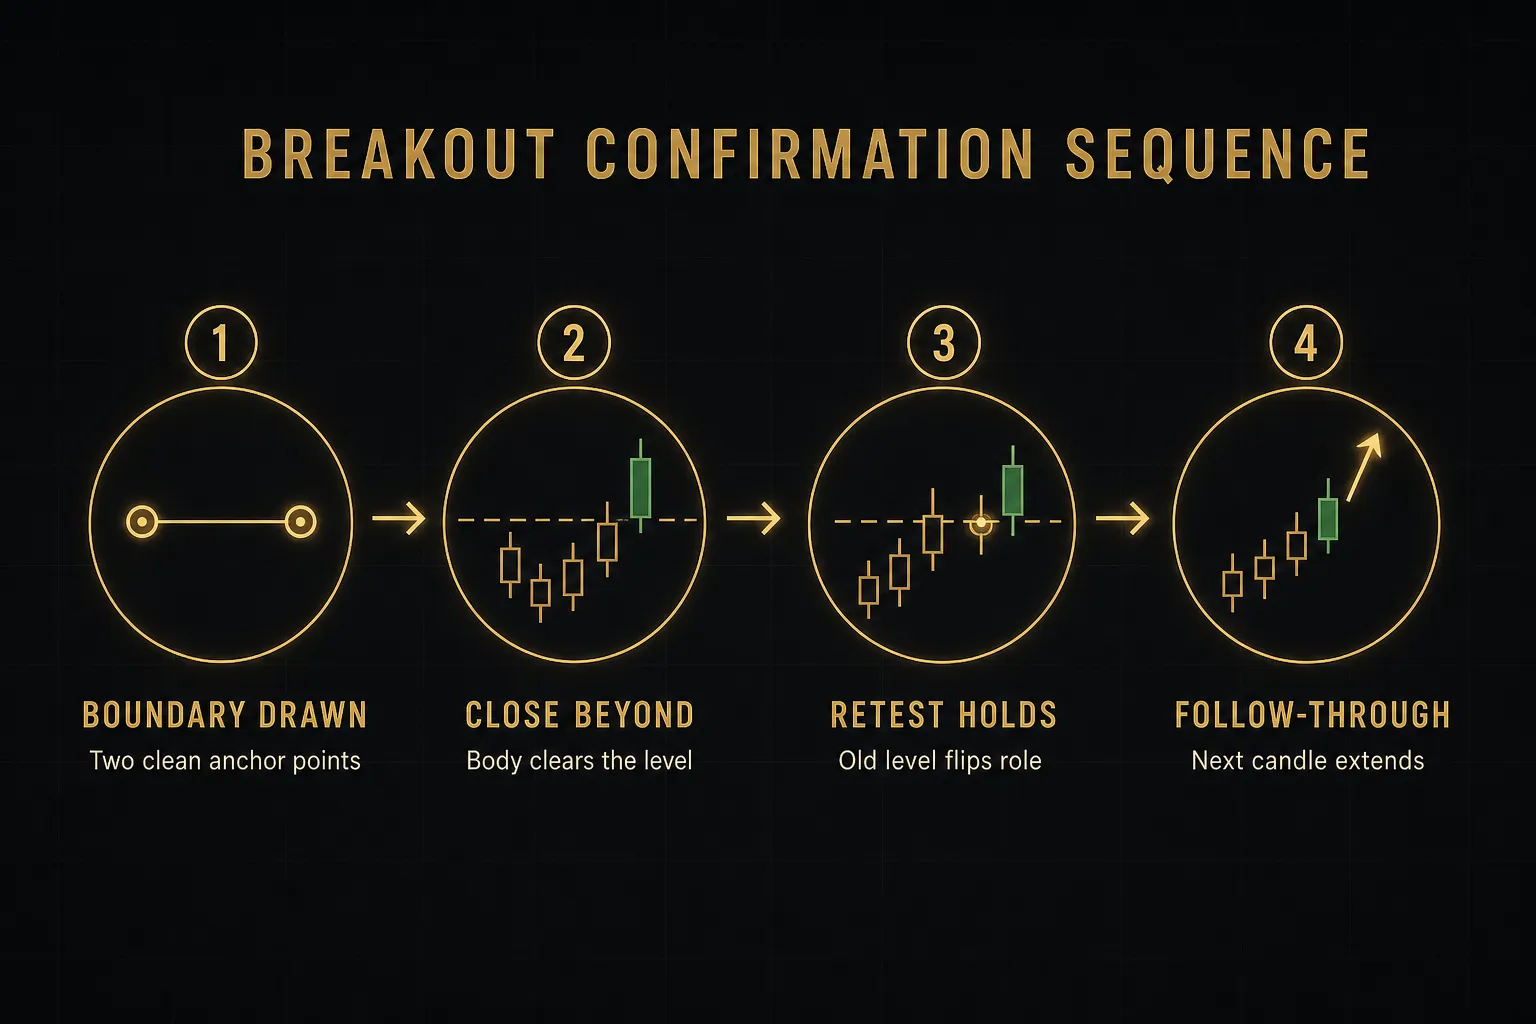
A breakout is confirmed by a candle closing beyond the boundary, not by price touching or wicking through it.
This single rule filters out a large share of bad entries.
The stricter version adds a second condition: a retest that holds. Price breaks the neckline, pulls back to it, and the old resistance now acts as support.
That flip is the market voting on the level.
It also gives you a much tighter stop and a better risk-to-reward ratio.
The cost of waiting for a retest is that roughly a third of clean breakouts never come back.
You’ll miss those.
In exchange, the ones you do take have a defined invalidation point sitting just a few ticks away.
Volume by Market Type
Volume confirmation is real in centralized markets and unreliable everywhere else.
In stocks and futures, all trades clear through a central exchange, so the trading volume printed on your chart is the actual volume. A breakout on 2x average volume genuinely means more participants showed up.
Spot forex has no central exchange.
What your platform shows is tick volume, the count of price updates from your broker’s specific liquidity feed. It correlates loosely with real activity but it’s a proxy, and it varies between brokers.
Crypto sits in between.
Volume is real on any given venue, but it’s fragmented across dozens of exchanges, and reported figures on smaller venues have a long history of inflation. Use volume from the deepest venue for that pair, and treat it as one input rather than a verdict.
Practical rule: in equities and futures, weak volume on a breakout is a genuine red flag.
In forex, absent volume is not evidence of anything, so lean harder on candle closes, retests, and higher-timeframe structure.
False Breakout vs Liquidity Sweep
Both look identical in the moment.
The difference is intent, and you only see it in the aftermath.
A false breakout is a failed attempt: price clears the level, can’t attract follow-through, and drifts back inside the pattern. A liquidity sweep is a deliberate push through an obvious level to trigger clustered stop orders, followed by a fast, aggressive reversal.
Use this checklist before treating any move as valid:
- Did the candle close beyond the level, or only wick through it? A long rejection wick with the body back inside the pattern is the single clearest warning sign of a sweep.
- Did the next candle extend the move? Genuine breakouts usually see follow-through within one to three bars. Stalling immediately at the boundary is a problem.
- Where did the move originate? A break that begins from deep inside the pattern with a single enormous candle is more often a sweep than a break driven by sustained pressure.
- Was there an obvious cluster of stops just beyond the level? Round numbers, prior swing highs, and textbook necklines are exactly where retail stops sit, and that makes them targets.
- Did price return inside the boundary within two candles? If yes, the breakout is failed. Treat any re-entry into the pattern as pattern invalidation, not a discount entry.
Timeframe and Market Context
A perfect bull flag on the 5-minute chart means very little if it’s forming directly beneath a daily resistance level that’s held three times this year.
Multi-timeframe analysis solves this cheaply.
Before taking any pattern, zoom out two levels: 5-minute traders check the hourly and the daily; daily traders check the weekly and monthly. Mark the major support and resistance zones and the prevailing trend direction.
Then apply one filter.
If the pattern points into open space on the higher timeframe, it’s tradeable.
If it points directly into a significant opposing level within one measured move’s distance, skip it or cut the target.
Market regime matters just as much.
In trending conditions, continuation patterns pay and reversal patterns get run over. In range-bound conditions, the reverse is true, and breakout strategies bleed out through repeated small losses.
A 200-period moving average slope or an ADX reading gives you a rough regime read in seconds.
Turning a Pattern Into a Trade
Identification is maybe 20 percent of the work.
The rest is arithmetic you do before you click.
Entry, Stop, Target, and Size
You have two clean entry options and they involve a real trade-off.
Breakout entry: enter on the close of the candle that clears the boundary. You catch every move, including the ones that never look back, but your stop sits further away and you’ll eat more false breakouts.
Retest entry: wait for the pullback to the broken level and enter on evidence it’s holding, ideally with a rejection candlestick. Tighter stop, better risk-to-reward ratio, fewer trades taken.
Stop-loss placement goes beyond the pattern’s invalidation point, not at a convenient round number.
For a head and shoulders short, that’s above the right shoulder. For a double bottom long, below the lower of the two lows.
Add a buffer of roughly 0.5 to 1x the current average true range so normal noise doesn’t take you out.
Two target methods cover most situations.
The measured move projects the pattern’s height from the breakout point: a triangle 60 points tall breaking upward at 1,500 projects to 1,560. The structure method uses the next significant prior swing high or low, or a Fibonacci extension of the prior impulse, typically the 1.272 or 1.618 level.
When the two disagree, take the closer one.
Being conservative on targets costs less than being greedy.
Position sizing comes last and it’s pure math.
Risk a fixed percentage of the account per trade, commonly 0.5 to 1 percent. Divide that dollar amount by the distance from entry to stop in points, and that’s your size.
The pattern never determines how much you trade.
Your stop distance does.
Indicators as Confluence
Indicators should filter setups out, not talk you into them.
That’s the entire distinction between confluence and confirmation bias.
Every chart contains something that vaguely resembles a pattern if you look hard enough. a momentum indicator like the relative strength index, or a moving average defining trend direction, gives you an objective reason to reject the weak ones.
Bearish divergence on RSI at the right shoulder of a head and shoulders strengthens the case. Price above a rising 200-period moving average argues against taking short reversals at all.
Tools that present multi-timeframe data in one view make this filtering fast. PipTrend, for example, uses a multi-timeframe table so you can see whether the hourly and daily agree with your 15-minute setup before you commit, and it separates the directional signal from the suggested entry level.
That separation matters: knowing the bias is bullish is a different decision from knowing where a bullish entry is actually worth taking.
What no indicator does is replace price action.
The structure, the boundaries, and the close beyond the level are the trade.
Indicators just tell you when to sit on your hands.
Testing Without Hindsight Bias
Scrolling back through old charts is the most misleading education in trading.
Completed patterns are obvious.
The forty formations that dissolved into nothing have already vanished from your attention.
Three biases do the damage.
Hindsight bias makes past breaks look inevitable.
Look-ahead bias creeps in when you draw a neckline using information that only existed after the fact.
Data-snooping happens when you test twenty rule variations on the same data and keep the one that worked, which is just curve-fitting with extra steps.
Fix it with bar-by-bar replay.
Most platforms have a replay mode that hides future price. Make your decision, record it, then advance.
It’s slower and considerably more humbling.
Then keep a trading journal that logs, at minimum: the pattern name, the instrument, the timeframe, the confirmation method used, entry and stop and target prices, the risk percentage, and the outcome in R multiples.
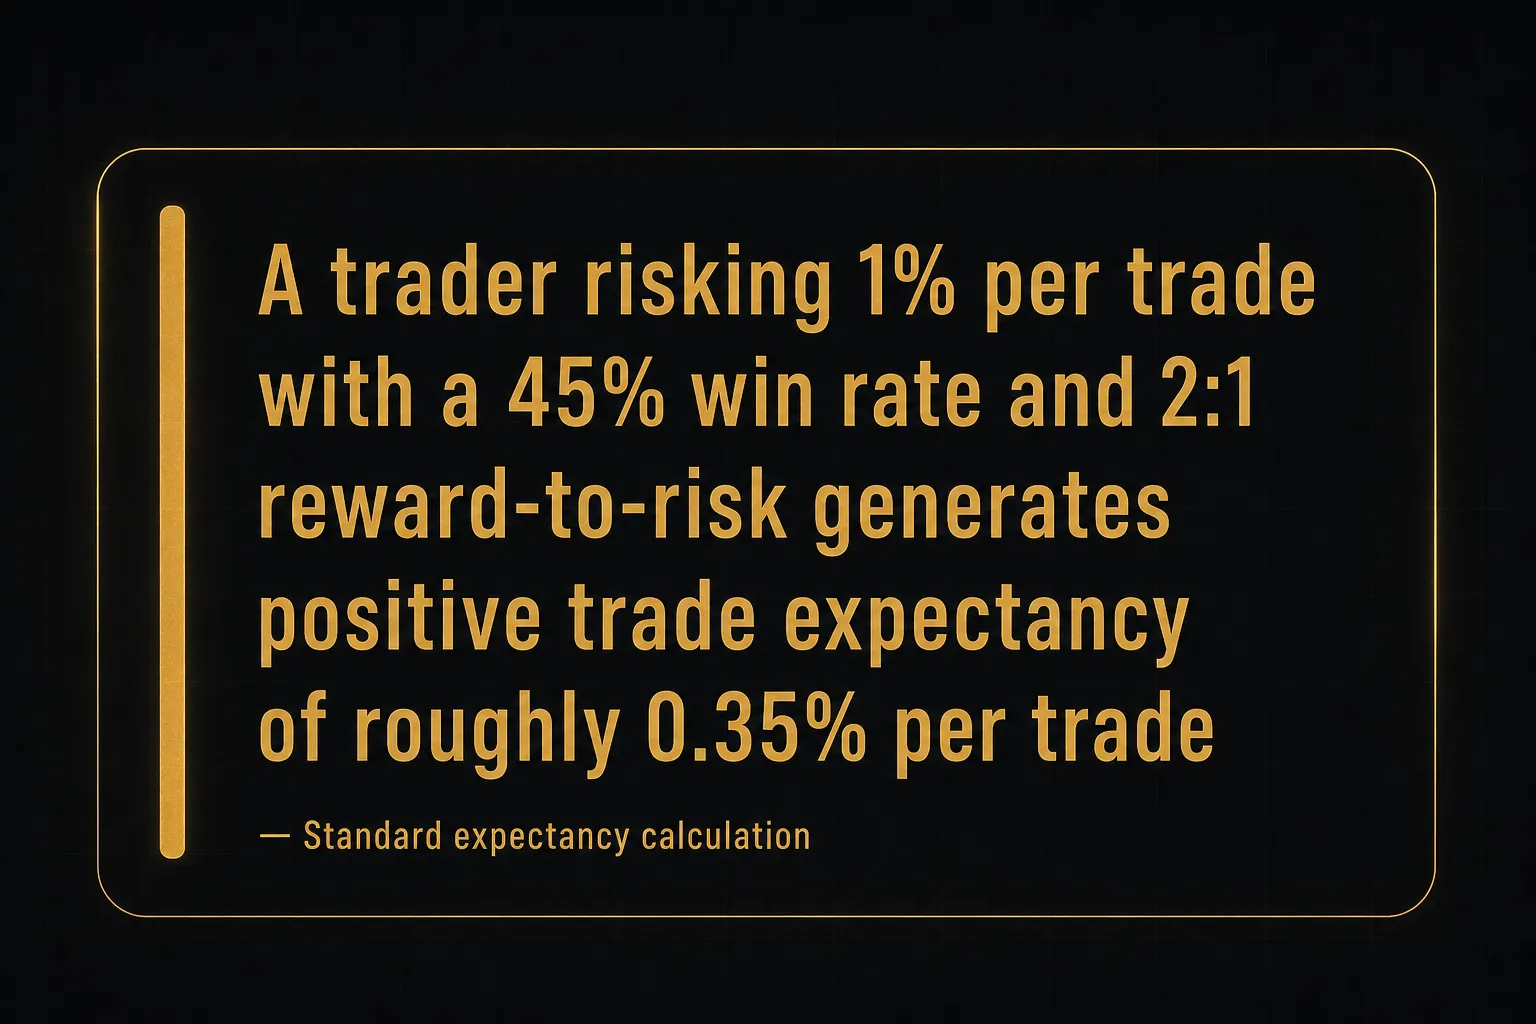
Fifty logged trades give you a rough read. Two hundred give you real trade expectancy data.
And execution costs belong in that log.
Spreads widen around news, slippage on breakout entries in fast markets can be several times normal, and weekend gaps can open past your stop entirely.
A backtest showing 2:1 reward-to-risk often lands closer to 1.6:1 once real costs are subtracted.
Chart Pattern FAQs
What is the most reliable trading chart pattern?
No single pattern is universally the most reliable, and any source claiming otherwise is ignoring how reliability is measured. A pattern’s usefulness depends on win rate, reward-to-risk ratio, and expectancy together, across a large enough sample in a specific market and timeframe.
A pattern winning 70 percent of the time with 0.5:1 reward-to-risk loses money. One winning 35 percent with 4:1 makes money comfortably.
Head and shoulders and double bottoms tend to be studied most and have the clearest completion rules, which makes them easier to test honestly, not automatically more profitable.
What are the 10 basic chart patterns?
The ten core patterns split into two groups by function.
- Reversal: head and shoulders, inverse head and shoulders, double top, double bottom, triple top and triple bottom, rising and falling wedges.
- Continuation: ascending triangle, descending triangle, symmetrical triangle, flag, pennant, cup and handle.
Wedges appear in both categories depending on where they form, which is why context always outranks the label.
How do you read chart patterns in trading?
Read the context before the shape.
The sequence is: identify the prior trend or range, mark the pattern’s boundaries using swing highs and swing lows, wait for a candle to close beyond the boundary, check for volume support and a retest that holds, then plan entry, stop, target, and size before entering.
If any step in that sequence fails, the pattern isn’t tradeable yet.
Reading a pattern is a filtering process, not a recognition exercise.
Do chart patterns actually work?
Chart patterns work as probability tools inside a complete trading process, not as standalone signals.
They describe genuine imbalances in supply and demand and they mark levels where large numbers of orders cluster, which is why the levels themselves matter even when the pattern fails.
What doesn’t work is entering on shape recognition alone. Without breakout confirmation, defined pattern invalidation, and consistent position sizing, even a statistically favourable pattern produces random results.
What is the easiest chart pattern to trade?
Head and shoulders and double tops and bottoms are the easiest to trade because their structure is objective. Both have a horizontal neckline, a clear completion trigger, an unambiguous invalidation point, and a measurable height for the target.
Flags come close for the same reason: the impulse defines the direction and the channel defines the trigger. Diagonal patterns like symmetrical triangles and wedges are harder because the entry price shifts as the trendlines extend.
What is the difference between chart patterns and candlestick patterns?
Candlestick patterns form on one to three candles and signal short-term shifts in buying or selling pressure. Doji, engulfing, hammer, and shooting star all fall here.
Chart patterns form over dozens of candles and describe broader market structure, showing how a trend is pausing or exhausting over days to months. They operate on different scales and answer different questions, which is why the strongest setups combine them: a chart pattern for the level and direction, a candlestick for the entry trigger.
Your Next Chart, Your Next Decision
Strip everything above down and you get a three-condition filter.
Did the pattern complete with a candle closing beyond its boundary? Did a retest hold, or did the follow-through arrive within a few bars? Does the setup align with higher-timeframe structure rather than pointing straight into a major opposing level?
All three yes, plan the trade with defined risk.
Any one missing, stay flat.
That last part deserves more respect than it gets.
Not trading is a decision, and it’s often the correct one.
Most charts, most of the time, contain no valid pattern with confirmation, and forcing a setup into existence is how accounts bleed out slowly rather than dramatically.
The traders who last aren’t the ones who spot the most patterns.
They’re the ones who reject the most.
So here’s the single thing to change before your next trade: write down the invalidation price and the target price before you enter.
Not the direction, not the reasoning.
Two numbers, on paper or in your journal, timestamped ahead of the fill.
If you can’t produce those two numbers, you don’t have a trade.
You have an opinion.
Risk Disclaimer: Trading involves risk. Past performance doesn't guarantee future results. Only trade with money you can afford to lose. PipTrend is a tool to assist your trading decisions, not financial advice.