
The financial markets in 2025 are moving faster than ever before. Volatility has become the new normal, and traders are under constant pressure to make quick, accurate decisions.
Yet, many struggle with identifying the right moments to act. Without reliable signals, it’s all too easy to miss opportunities or make costly mistakes. That’s where reversal candlestick patterns come into play.
Despite advances in trading technology, these classic chart patterns remain some of the most effective tools for spotting market reversals. By learning to recognize and use them, traders can anticipate trend changes with greater confidence.
In this article, you’ll discover the 7 essential reversal candlestick patterns to know in 2025. You’ll learn how each pattern works and how to seamlessly integrate them into your trading strategy for better results.
Understanding Reversal Candlestick Patterns
Candlestick charts have been a staple in trading for decades, but their power lies in recognizing specific patterns that signal a potential shift in market direction. Among these, reversal candlestick patterns are essential for spotting moments when a prevailing trend is likely to change. These patterns differ from continuation formations, as they highlight a possible end to the current trend and the start of a new one. The psychology behind reversal candlestick patterns is rooted in the battle between buyers and sellers, reflecting shifts in momentum and market sentiment. Historically, traders have relied on these signals, and they remain highly relevant even as markets become more technology-driven. For a deeper dive into the basics, check out this Understanding Reversal Candlestick Patterns guide.
What Are Reversal Candlestick Patterns?
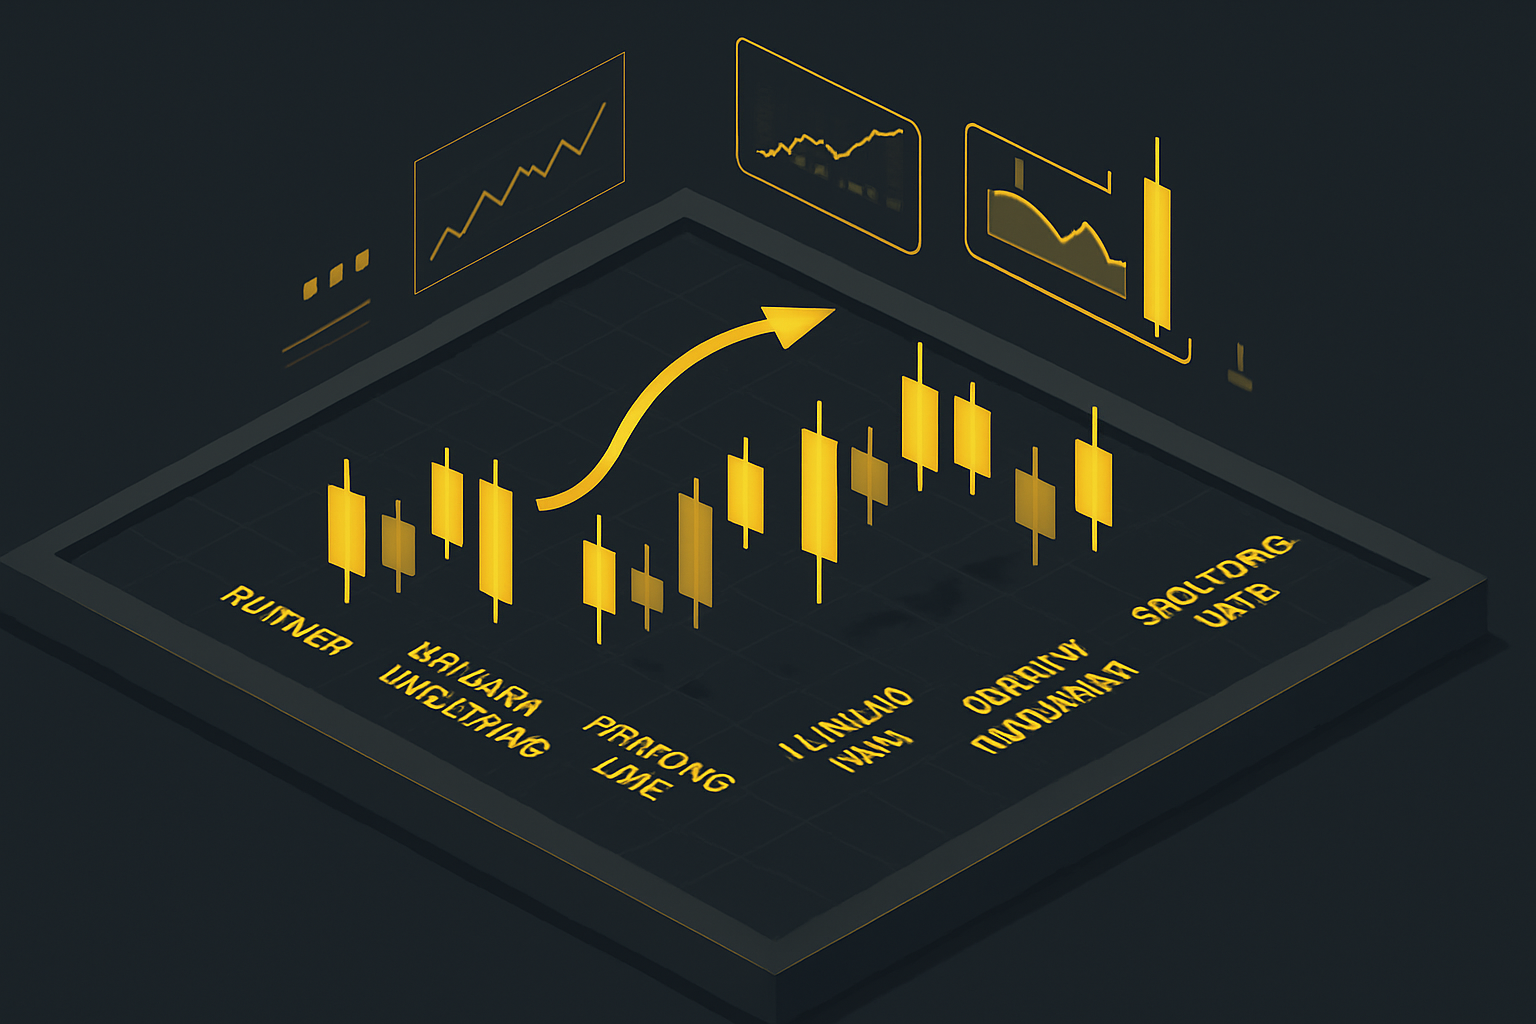
Reversal candlestick patterns are visual signals on a chart that suggest a shift in the market's direction. Unlike continuation patterns, which indicate a trend is likely to persist, reversal candlestick patterns alert traders to a potential turning point. These patterns provide insight into the underlying psychology of buyers and sellers, capturing moments when momentum may be fading or reversing. For example, a bullish engulfing pattern may signal a move from bearish to bullish sentiment. Traders often reference real market charts to spot these signals and confirm their reliability.
Why Reversal Patterns Matter in 2025
Timely identification of reversal candlestick patterns is more critical than ever in 2025. With high-frequency trading and AI-driven algorithms influencing price action, markets can move swiftly and unpredictably. Thankfully, reversal candlestick patterns adapt well to both manual and automated strategies. They help traders navigate increased volatility by offering clear, visual cues of trend exhaustion. According to TradingView, these patterns remain among the most popular indicators worldwide, proving their continued value in modern trading.
Key Elements of Reliable Reversal Patterns
Not all reversal candlestick patterns are created equal—context matters. Reliable patterns are often confirmed by volume spikes, signaling stronger conviction behind the move. The timeframe you choose can impact accuracy; daily and four-hour charts tend to filter out more noise than lower timeframes. Pattern size and candle proportions also play a role, as larger formations often carry more weight. Common pitfalls include misreading false signals or ignoring market context. For example, a dramatic increase in volume often confirms a genuine reversal.
Integrating Reversal Patterns Into Your Trading Strategy
To make the most of reversal candlestick patterns, combine them with other technical indicators such as RSI or moving averages for added confirmation. Practicing solid risk management—like setting stop losses based on the pattern's structure—can help protect your capital. Backtesting these setups on historical data builds confidence before trading live. Whether you're trading forex, crypto, stocks, or indices, adapting your approach to each asset class is key. Many traders have improved their win rates by systematically incorporating reversal candlestick patterns into their strategies.
7 Essential Reversal Candlestick Patterns to Know in 2025
Navigating modern markets demands more than intuition—traders must rely on proven tools to spot trend changes before the crowd. Among these tools, reversal candlestick patterns stand out for their clarity and adaptability, even in today’s algorithm-driven landscape. Below, we break down the 7 most crucial reversal candlestick patterns every trader should master in 2025.
1. Bullish Engulfing
A Bullish Engulfing pattern is a powerful signal among reversal candlestick patterns. It forms when a large bullish candle fully engulfs the prior bearish candle, often appearing after a sustained downtrend.
Structure & Psychology:
- The first candle is bearish, showing that sellers are in control.
- The second, larger bullish candle represents a sudden shift to aggressive buyers, overwhelming sellers.
Key Criteria for Validity:
- Appears at a support level or after a notable decline.
- Volume spikes on the bullish candle confirm genuine buying interest.
- Works best in liquid markets like major stock indices.
Example:
In 2024, the S&P 500 saw a textbook Bullish Engulfing pattern at a major support, sparking a multi-week rally.
How to Trade:
- Enter above the high of the engulfing candle.
- Place a stop loss below the recent swing low.
- Consider a target at the next resistance or use a risk-to-reward ratio of 2:1.
Data Table:
| Pattern | Success Rate (%) |
|---|---|
| Bullish Engulfing | 75 |
Bullish Engulfing is consistently ranked among the most successful reversal candlestick patterns. For a deeper dive, check out this Reversal Candlestick Patterns Guide.
2. Bearish Engulfing
Bearish Engulfing is the mirror image of the bullish version and is a cornerstone of reversal candlestick patterns for spotting tops.
Structure & Sentiment:
- A small bullish candle is followed by a larger bearish candle that engulfs it.
- Signals a decisive shift from buyers to sellers, often after an uptrend or at resistance.
High-Probability Setups:
- Appears at resistance or in overbought conditions.
- Confirmed by higher volume on the bearish candle.
Example:
In the crypto markets, Bitcoin formed a Bearish Engulfing pattern at its 2024 high, leading to a swift 15% correction.
Entry and Exit Strategies:
- Enter below the low of the engulfing candle.
- Place a stop above the recent high.
- Target prior support or use trailing stops for larger moves.
Statistics:
Bearish Engulfing patterns have signaled reversals 72% of the time in backtests, making them a staple among reversal candlestick patterns.
3. Hammer
The Hammer is a single-candle pattern that often marks the end of selling pressure within reversal candlestick patterns.
Appearance:
- Small body near the candle top.
- Long lower wick (at least twice the body size).
- Little or no upper wick.
Indication:
- Buyers are stepping in aggressively after sellers push prices down.
- Most reliable after sharp declines or at strong support zones.
Ideal Context:
- Look for hammers in established downtrends.
- Volume confirmation adds credibility.
Example:
A major forex pair, EUR/USD, reversed sharply at key support in 2023 following a Hammer pattern.
Confirmation Signals:
- Follow-up bullish candle.
- Rising volume or bullish divergence on RSI.
Common Mistakes:
- Confusing hammers with dojis or candles with insufficient lower wicks.
Hammers are a staple in reversal candlestick patterns, but context and confirmation are crucial for reliability.
4. Shooting Star
The Shooting Star is a top reversal pattern that signals potential exhaustion of buyers in reversal candlestick patterns.
Appearance:
- Small real body near the candle’s low.
- Long upper wick, minimal lower wick.
Signals:
- Rejection of higher prices; sellers regain control after buyers test new highs.
Best Used:
- After extended uptrends or near resistance.
Example:
A leading tech stock in early 2025 printed a Shooting Star at all-time highs, leading to a 10% pullback.
Entry and Risk Management:
- Enter below the low of the Shooting Star.
- Place a stop loss above the high.
- Consider partial profits at the next support.
Data:
According to ChartSchool, Shooting Stars have a 68% accuracy for daily chart reversals. This makes them an essential part of any trader’s reversal candlestick patterns toolkit.
5. Morning Star
The Morning Star is a three-candle formation, widely respected among reversal candlestick patterns for its clarity and reliability.
Structure:
- First candle: strong bearish.
- Second: small-bodied (can be bullish or bearish), indicating indecision.
- Third: strong bullish candle closing above the midpoint of the first.
Significance:
- Shows a shift from selling momentum to decisive buying.
Confirmation:
- Volume should increase on the third candle.
- Closing above resistance strengthens the signal.
Example:
In late 2024, the S&P 500 rebounded off crisis lows with a classic Morning Star, confirming a trend reversal.
Trading the Pattern:
- Enter above the third candle’s high.
- Stop loss below the pattern’s low.
- Target recent highs or next resistance.
Backtest Results:
Morning Star patterns have delivered positive returns in 64% of tested scenarios, cementing their place among effective reversal candlestick patterns.
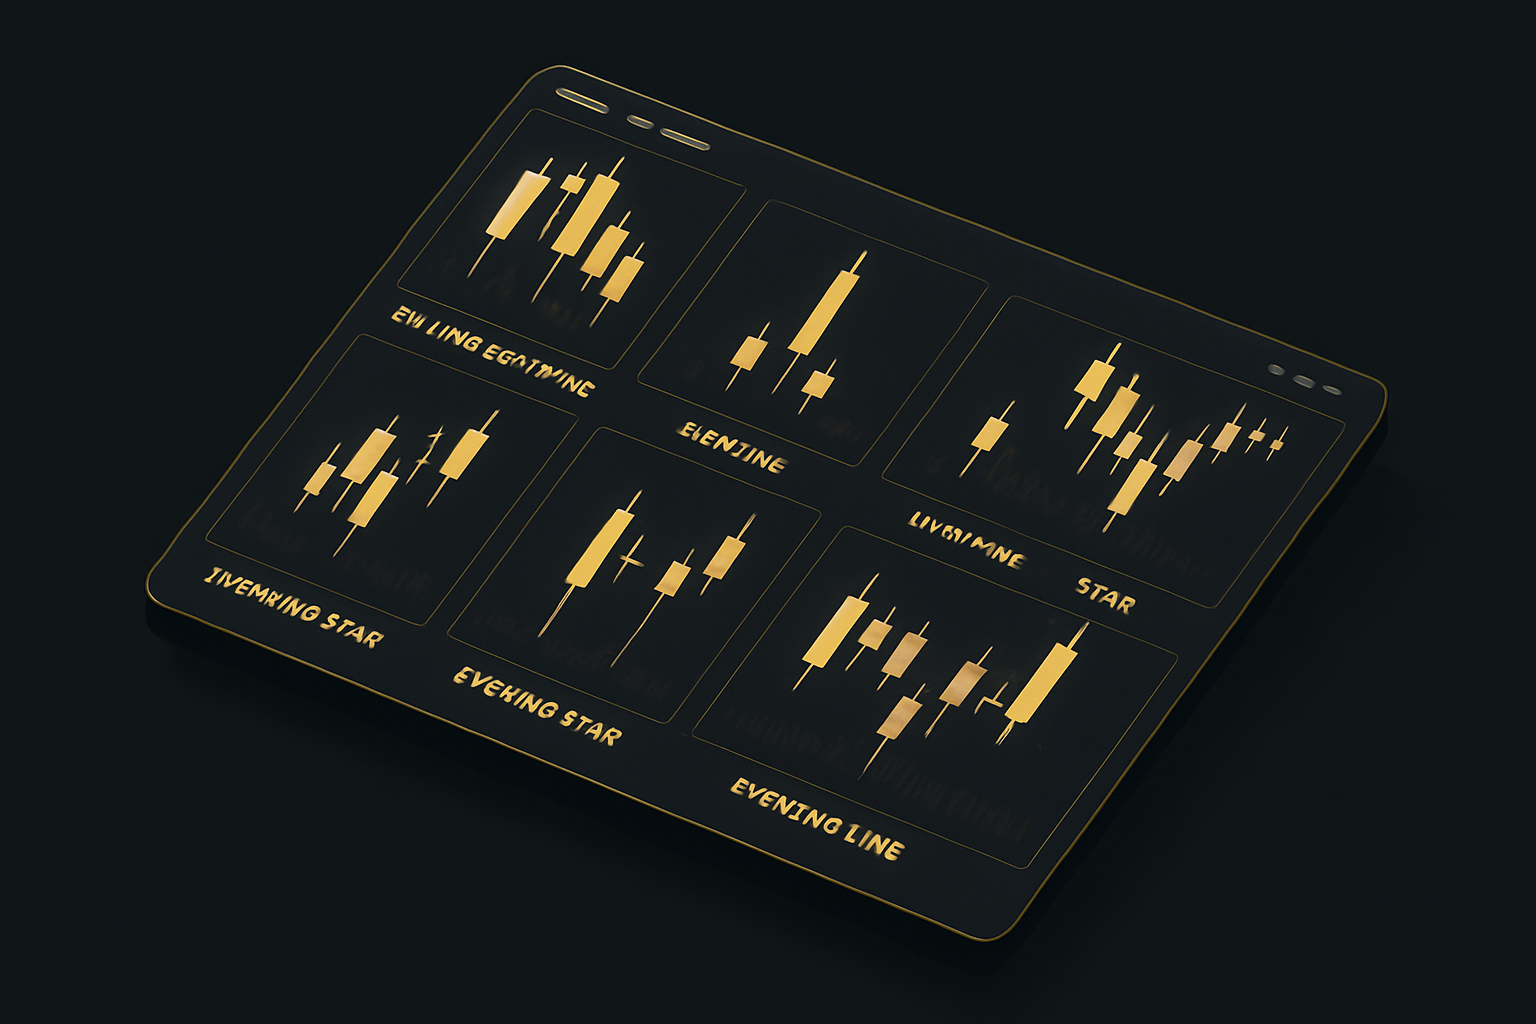
6. Evening Star
The Evening Star is the bearish counterpart to the Morning Star and is a key pattern in reversal candlestick patterns for identifying market tops.
Structure:
- First candle: strong bullish.
- Second: small-bodied, signaling indecision.
- Third: strong bearish candle closing below the midpoint of the first.
Indicates:
- Bullish exhaustion and the arrival of sellers.
Key Confirmation Factors:
- Volume should rise on the third candle.
- Overbought conditions increase reliability.
Example:
A major forex pair in 2025 reversed after an Evening Star at resistance, confirming the trend change.
Identifying False Signals:
- Avoid patterns in low-volume environments.
- Confirm with RSI or MACD for added confidence.
Success Rate:
Evening Star patterns are 66% reliable in trending markets, making them a trustworthy tool within reversal candlestick patterns.
7. Piercing Line
Piercing Line is a two-candle bullish reversal, often overlooked among reversal candlestick patterns but valuable for catching sharp turns.
Structure:
- First candle: strong bearish.
- Second: bullish, opening below the prior close and closing above the midpoint of the first.
Context:
- Appears after a downtrend, especially at support.
Volume & Sentiment:
- Rising volume on the bullish candle signals genuine buying.
Example:
A leading crypto asset formed a Piercing Line at a major support, reversing a steep decline.
Trading Strategy:
- Enter above the second candle’s high.
- Stop loss below the pattern’s low.
- Target prior resistance.
Data:
Recent studies show Piercing Line patterns have a 61% reversal accuracy, adding to the credibility of reversal candlestick patterns.
Advanced Tips for Trading Reversal Candlestick Patterns
Navigating the world of reversal candlestick patterns takes more than just memorizing shapes. To truly master these patterns, traders must blend them with other analytical tools, adapt to multiple timeframes, manage risk wisely, and avoid common traps.

Combining Patterns with Other Indicators
Pairing reversal candlestick patterns with technical indicators can significantly boost your trading accuracy. For instance, integrating moving averages or RSI helps confirm whether a pattern signals a genuine trend shift or just noise.
Imagine spotting a bullish engulfing pattern while the RSI shows oversold conditions. This combo increases the odds of a successful trade. Many advanced traders also use MACD crossovers or volume spikes for further confirmation.
For a deeper dive into these combinations and real-world examples, check out Mastering Candlestick Reversal Patterns. By layering indicators with reversal candlestick patterns, you filter out false signals and build more robust strategies.
Multi-Timeframe Analysis for Greater Accuracy
Relying on a single chart may limit your perspective. Multi-timeframe analysis allows you to validate reversal candlestick patterns across different intervals, making signals more reliable.
For example, if you notice a hammer on a daily chart and another on a 4-hour chart at the same support level, confidence in a potential reversal grows. This approach helps filter out short-term market noise and provides a bigger-picture view.
A good practice is to start with higher timeframes for trend direction, then zoom into lower ones for precise entries based on reversal candlestick patterns. This layered approach can lead to more consistent results.
Risk Management and Trade Execution
Even with strong reversal candlestick patterns, risk management is non-negotiable. Always set stop losses just beyond the pattern’s invalidation point to protect your capital.
Position sizing matters, too. Use a risk-to-reward ratio of at least 1:2 to maximize gains and limit losses. Avoid overtrading—wait for clear setups supported by reversal candlestick patterns and confirmation signals.
Consider using a trade journal to track your entries, exits, and outcomes. This habit helps you refine your approach and stick to your strategy, especially in volatile markets.
Common Mistakes and How to Avoid Them
Traders often misinterpret candle formations or ignore market context, leading to costly errors. One common mistake is relying solely on reversal candlestick patterns without confirmation from volume or indicators.
Low-volume environments can produce false signals, so always check for supporting evidence. Another pitfall is overconfidence—don’t force trades if the setup isn’t perfect.
To avoid these errors, practice patience, review historical examples, and backtest your strategies. By combining discipline with a solid understanding of reversal candlestick patterns, you’ll sidestep many common traps.
The Role of Technology in Candlestick Pattern Recognition
Technology is reshaping the way traders analyze reversal candlestick patterns. As markets become more complex, tools powered by artificial intelligence and automation are making pattern recognition faster, more accurate, and accessible to all traders.

How AI and Automation Are Changing Pattern Detection
AI-driven trading platforms now scan thousands of charts in real time, flagging reversal candlestick patterns as they emerge. These tools eliminate the human error and subjectivity that often lead to missed opportunities or misinterpretations.
For example, automated alerts can instantly notify traders when a bullish engulfing or hammer pattern appears on key assets. This rapid response is crucial in volatile markets where seconds matter. Many traders enhance their skills by studying resources like Candlestick Trading Secrets, which dives deep into how technology and strategy intersect for optimal pattern recognition.
AI not only speeds up detection but also brings consistency, helping traders focus on high-probability setups and minimize distractions.
Backtesting and Pattern Performance Analysis
Backtesting is essential for evaluating how reversal candlestick patterns perform across different markets and timeframes. Modern trading platforms let users simulate thousands of trades using historical data, revealing which patterns consistently yield profitable results.
With just a few clicks, traders can analyze win rates, average returns, and even the impact of combining patterns with technical indicators. This data-driven approach builds confidence and helps refine strategies before risking real capital.
Reliable backtesting empowers traders to adapt their use of reversal candlestick patterns to align with changing market dynamics and personal risk tolerance.
Limitations of Automated Pattern Recognition
Despite their advantages, automated tools for spotting reversal candlestick patterns have notable limitations. Algorithms may struggle with context, such as distinguishing between genuine reversals and false signals in sideways or low-volume environments.
Common challenges include:
- Overfitting to historical data, missing future market shifts
- Generating false positives during choppy price action
- Failing to account for fundamentals or news events
Human judgment remains vital. Traders should always confirm AI-generated signals with additional analysis and not rely solely on automation to make trading decisions.
Staying Ahead in 2025’s Trading Landscape
To stay competitive, traders must blend technology with traditional analysis when working with reversal candlestick patterns. Embracing new tools is essential, but so is continuous learning and adapting to evolving market conditions.
Successful traders:
- Regularly update their skills with courses and market research
- Combine pattern recognition software with manual chart review
- Practice disciplined risk management and emotional control
By balancing innovation and expertise, traders can confidently navigate the ever-changing world of reversal candlestick patterns in 2025.
Frequently Asked Questions About Reversal Candlestick Patterns
Navigating the world of reversal candlestick patterns can spark plenty of questions, especially with the rapid changes in the 2025 trading landscape. Below, you'll find clear answers to the most common queries traders have about using these patterns effectively.
What Timeframes Work Best for Reversal Patterns?
Choosing the right timeframe is crucial when using reversal candlestick patterns. Daily and 4-hour charts are often favored for their balance between signal reliability and trading frequency. Intraday charts, such as 15-minute or 1-hour, can also reveal patterns but may produce more noise.
Here's a quick comparison:
| Timeframe | Pros | Cons |
|---|---|---|
| Daily | High reliability | Fewer signals |
| 4-hour | Good balance | Moderate noise |
| Intraday | More opportunities | Higher false signals |
Different asset classes may respond better to certain timeframes. For example, forex traders often use 4-hour charts, while stock traders might prefer daily intervals when spotting reversal candlestick patterns.
How Reliable Are These Patterns in 2025?
The reliability of reversal candlestick patterns in 2025 depends on several factors, including market conditions and volume. Recent studies indicate that these patterns still perform well, especially when combined with confirmation tools like volume spikes or momentum indicators.
Backtests show that reliability rates can range from 61% to 72% depending on the pattern and context. However, high volatility or low-volume environments may reduce effectiveness. Always remember, no pattern is foolproof—proper validation is essential.
To maximize success, consider integrating reversal candlestick patterns with other forms of technical analysis. This approach can help filter out false signals and improve your overall win rate.
Can Beginners Effectively Use Reversal Patterns?
Absolutely—beginners can learn to use reversal candlestick patterns with the right approach and resources. Start by focusing on the most common patterns, such as the hammer or bullish engulfing, and practice identifying them on historical charts.
Helpful tips for new traders:
- Use demo accounts to practice spotting patterns.
- Combine patterns with basic indicators like RSI for confirmation.
- Review educational materials from trusted sources, such as Investopedia's candlestick guide.
Patience is key. With consistent learning and backtesting, beginners can build confidence in recognizing reversal candlestick patterns and avoid common pitfalls.
What Are the Best Markets for Reversal Candlestick Patterns?
Reversal candlestick patterns work across a variety of markets, including forex, stocks, crypto, and indices. Each market has its unique characteristics, but these patterns remain powerful tools for identifying potential turning points.
For instance:
- Forex: Patterns often appear at key support and resistance levels.
- Stocks: Daily reversals can signal major trend changes.
- Crypto: Volatile swings make pattern recognition valuable.
- Indices: Patterns help spot broad market shifts.
Effectiveness may vary, but with proper market context, reversal candlestick patterns can be adapted to suit any trading style or asset class.
Now that you know the 7 essential reversal candlestick patterns for 2025, you’re ready to spot real opportunities in any market. Remember, recognizing these patterns is just the start—timely, confident execution is what truly sets successful traders apart. If you’re looking for that extra edge, why not use a tool that combines reliable signals with AI-powered analysis? With PipTrend, you can take the guesswork out of your trading and start acting on clear, real-time alerts. You’ve got the knowledge—let’s turn it into results.
Start Catching Winning Trades, Right Now!