
In today’s fast-paced markets, technical indicators are the backbone of successful trading. As we look toward 2025, staying ahead means using smarter tools and strategies tailored to dynamic conditions.
Mastering technical indicators will give you the clarity and confidence needed to navigate everything from stocks to crypto and forex. This article uncovers the top six essential technical indicators every trader should know to gain a real edge.
From trend-following to momentum and volume analysis, you will discover which indicators matter most and how to use them for better results. Get ready to unlock new levels of trading performance and take action on the latest strategies.
What Are Technical Indicators and Why Do They Matter in 2025?
Technical indicators have long been the backbone of trading strategies, helping traders transform complex price data into actionable insights. As we approach 2025, the landscape for technical indicators is shifting rapidly, driven by technological innovation and the demands of increasingly dynamic markets.
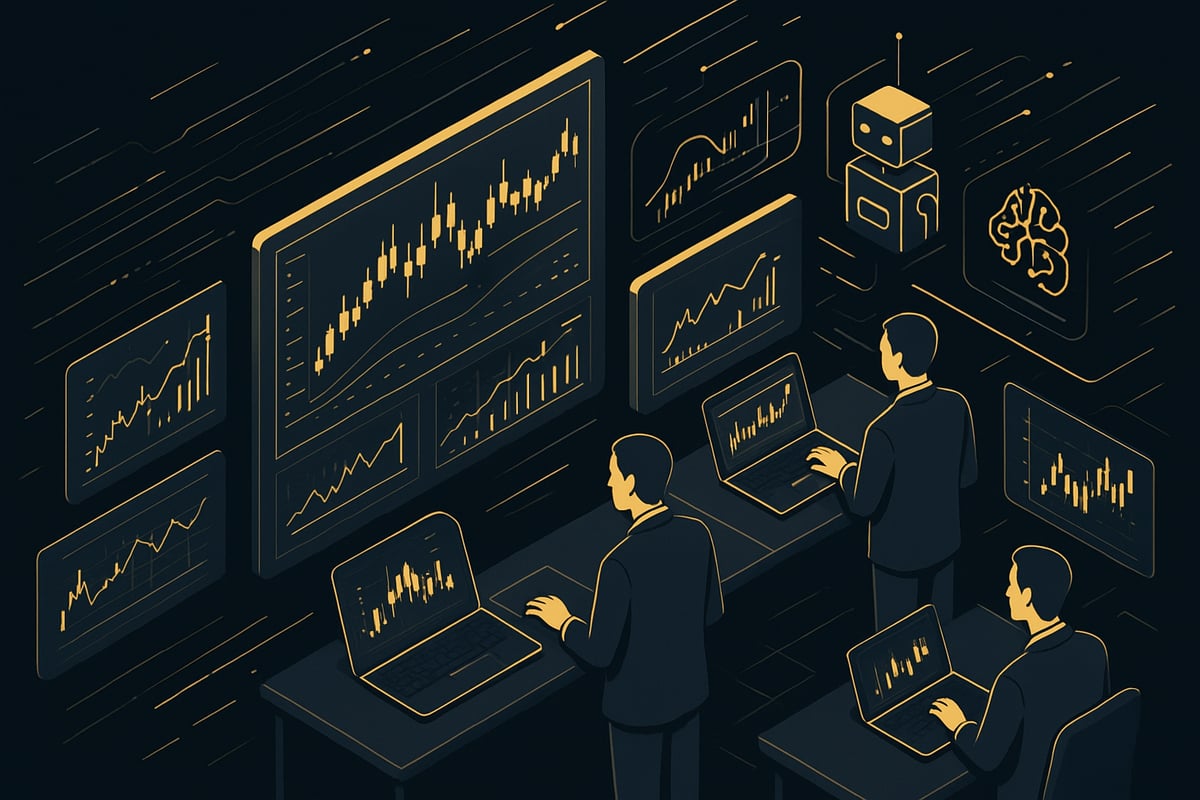
The Evolution of Technical Analysis
Technical analysis began as a manual process, where traders relied on hand-drawn charts and simple patterns to guide decisions. Over the years, technical indicators evolved, becoming more sophisticated as computing power increased. The last decade has seen a surge in AI, automation, and advanced data analytics, transforming how traders use technical indicators in real time.
Today, the expansion of markets like cryptocurrency, forex, and global equities requires traders to master versatile technical indicators that work across asset classes. The shift from discretionary to systematic trading means algorithms and automated systems now depend on reliable technical indicators for signal generation. For instance, the rise of algorithmic trading is largely built on networks of technical indicators, as detailed in recent research on Technical Indicator Networks (TINs) in Algorithmic Trading. This advancement allows traders to adapt quickly, identify opportunities, and manage risk more effectively.
Key Functions and Categories of Indicators
Technical indicators fall into several core categories, each serving a unique purpose in a trader’s toolkit. These include trend-following, momentum, volume, volatility, and oscillators. By analyzing price and volume data, technical indicators translate raw numbers into visual signals that traders can act upon.
Here’s a quick comparison of major indicator categories:
| Category | Primary Use | Example Indicator |
|---|---|---|
| Trend-Following | Identify price direction | Moving Average |
| Momentum | Gauge speed of movement | RSI |
| Volume | Confirm price activity | OBV |
| Volatility | Measure price fluctuations | Bollinger Bands |
| Oscillators | Spot overbought/oversold | Stochastic Oscillator |
Some indicators are leading, aiming to predict future movements, while others are lagging, confirming trends after they begin. Combining different types of technical indicators can help reduce false signals and improve trading accuracy. In fact, over 70% of active traders use at least two to three technical indicators in their strategies, according to Investopedia.
Why Mastering Indicators Is Essential for 2025 Traders
As we move into 2025, mastering technical indicators is more important than ever. Market volatility is rising, and price movements are happening faster, making it critical to have sharp, responsive tools. The complexity of global markets and the growth of cross-asset trading further highlight the need for robust technical indicators.
For example, crypto and forex markets operate around the clock, requiring automated and reliable technical indicators to keep up. Traders who adapt to new indicator trends and integrate them into automated strategies consistently outperform those using outdated methods. Mastering technical indicators provides a crucial competitive edge, allowing traders to anticipate shifts and react with confidence.
In the following sections, we will explore the top six technical indicators every trader should know for 2025. Each offers unique value, from identifying trends to confirming momentum and measuring volume, ensuring you are well-equipped for the demands of modern trading.
Top 6 Technical Indicators Every Trader Should Know in 2025
Mastering technical indicators is essential for traders aiming to thrive in 2025’s fast-paced markets. Below, we break down the six most important technical indicators you should know, including their functions, strengths, and practical tips for maximizing your trading edge.
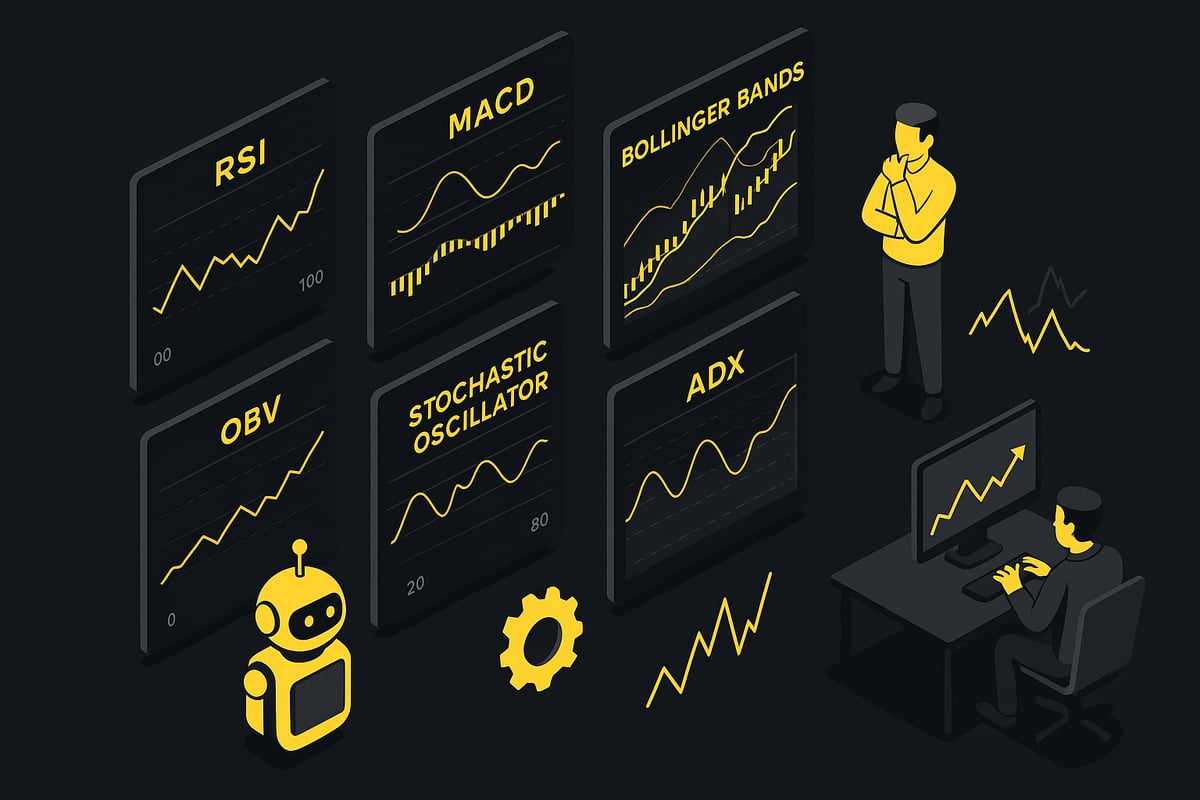
1. Relative Strength Index (RSI)
The Relative Strength Index, or RSI, is a cornerstone among technical indicators. Designed as a momentum oscillator, RSI quantifies the speed and change of price movements over a set period, typically 14 days. The RSI scale ranges from 0 to 100, with readings above 70 signaling overbought conditions and below 30 indicating oversold areas.
Traders use RSI to spot trend reversals, confirm ongoing trend strength, and identify divergence between price and momentum. For example, if a cryptocurrency’s price makes a new high but the RSI fails to do so, this negative divergence can hint at an impending reversal. In fast-moving markets like crypto and stocks, timing entries using RSI can offer a significant advantage.
RSI stands out for its simplicity and visual clarity. Its adaptability across asset classes makes it one of the most widely used technical indicators. In fact, RSI consistently ranks among the top three most-used technical indicators by retail traders, according to Altrady. Its power is amplified in mean-reverting or volatile environments, where quick shifts in momentum are common.
However, it is important to note that RSI can generate false signals in strongly trending markets. To mitigate this, savvy traders combine RSI with trend-following technical indicators, such as moving averages. The Effectiveness of Technical Indicators in Stock Trading research highlights how combining RSI with other tools improves accuracy and reduces noise.
In summary, RSI’s strength lies in its ability to quickly highlight extreme market conditions, making it a must-have in your technical indicators toolkit for 2025.
2. Moving Average Convergence Divergence (MACD)
The Moving Average Convergence Divergence, or MACD, is a trend-following momentum indicator that reveals the relationship between two moving averages of an asset’s price. MACD consists of three components: the MACD line (difference between 12-period and 26-period exponential moving averages), the signal line (9-period EMA of the MACD line), and the histogram (visualizing the difference between the two).
MACD generates signals through crossovers (MACD line crossing the signal line), divergence (disagreement between MACD and price), and histogram analysis. For instance, a bullish crossover in a forex pair can signal the start of upward momentum, while a bearish divergence in equities might warn of a potential reversal.
One of MACD’s greatest strengths is its ability to filter out market noise and confirm trend shifts. By combining trend and momentum analysis, MACD remains effective in both trending and ranging environments. Algorithmic traders often favor MACD for its dual purpose, incorporating it into systematic strategies for robust trend detection.
Despite its versatility, MACD is classified as a lagging indicator. This means it often reacts after a trend has started, making it best paired with leading technical indicators for sharper entries and exits. Adjusting MACD parameters for different assets or timeframes can further optimize its performance.
In 2025, with rapid market changes, MACD remains a vital component of any trader’s technical indicators arsenal, especially when used as part of a balanced indicator toolkit.
3. Bollinger Bands
Bollinger Bands are a popular volatility indicator that consists of a simple moving average flanked by upper and lower bands, each set a certain number of standard deviations away. This structure allows traders to visualize price volatility and quickly identify overbought or oversold conditions.
The core function of Bollinger Bands is to measure how far prices deviate from their average, expanding during periods of high volatility and contracting during quieter times. Traders often use Bollinger Band “squeezes” to anticipate breakout opportunities, as tightening bands signal a potential surge in volatility. For example, a sudden expansion following a squeeze in the crypto market might precede a major price move.
Bollinger Bands are invaluable for adapting to dynamic market conditions. They offer real-time insight into volatility, helping traders fine-tune stop-loss placements and manage risk. The indicator is widely used in both short-term trading and swing strategies, making it one of the most versatile technical indicators available.
It is crucial, however, not to rely on Bollinger Bands alone. For more reliable signals, combine them with momentum or volume-based technical indicators. This approach helps confirm the validity of breakouts and reduces the likelihood of false signals.
In summary, Bollinger Bands empower traders to visualize volatility and seize opportunities in fast-changing markets, solidifying their place among the top technical indicators for 2025.
4. On-Balance Volume (OBV)
On-Balance Volume, or OBV, is a volume-based indicator that accumulates positive and negative volume flow to provide insight into the strength of price trends. By adding volume on up days and subtracting on down days, OBV creates a cumulative line that reflects buying and selling pressure.
OBV’s main function is to confirm price trends and detect divergences between price and volume. For instance, if a stock’s price rises while OBV moves sideways or falls, it may signal that institutional investors are not supporting the move, warning of a potential reversal. This makes OBV especially effective at identifying accumulation or distribution before significant price shifts.
A key advantage of OBV is its ability to provide early warning signals that price-based technical indicators might miss. Volume often leads price, so OBV can alert traders to impending breakouts or breakdowns. It is particularly favored on daily and weekly timeframes for trend confirmation, as highlighted by Investopedia.
Despite its strengths, OBV is less effective in low-volume or illiquid markets, where volume data can be unreliable. To maximize its effectiveness, pair OBV with price-based technical indicators like moving averages or RSI.
In sum, OBV adds a crucial volume dimension to your technical indicators toolkit, helping you validate trends and anticipate market moves with greater confidence.
5. Stochastic Oscillator
The Stochastic Oscillator is a momentum indicator that compares a security’s closing price to its price range over a specified period, usually 14 periods. It consists of two lines: %K (the main line) and %D (a moving average of %K). Readings above 80 are considered overbought, while readings below 20 indicate oversold conditions.
Traders use the Stochastic Oscillator to time entries and exits, particularly in sideways or ranging markets. For example, when the %K line crosses above the %D line below the 20 level, it can signal a high-probability reversal to the upside. This fast reaction to price changes makes the Stochastic Oscillator a favorite among day traders.
One of the key arguments for using the Stochastic Oscillator is its responsiveness. It can quickly generate signals as market conditions shift, making it ideal for short-term and intraday trades. However, this sensitivity can also lead to overtrading, as the indicator often produces many signals, some of which may be false.
To improve reliability, combine the Stochastic Oscillator with trend-following technical indicators. This helps filter out noise and avoid whipsaws during strong market moves. Customizing the settings for different assets and timeframes further enhances its effectiveness.
Ultimately, the Stochastic Oscillator is a powerful addition to your technical indicators suite, especially for traders focused on capturing short-term price swings in 2025.
6. Average Directional Index (ADX)
The Average Directional Index, or ADX, is a unique technical indicator that measures the strength of a price trend, regardless of its direction. The ADX line ranges from 0 to 100, with higher values indicating stronger trends. It is typically used alongside the +DI and -DI lines, which show directional movement.
ADX’s primary use is to determine whether a market is trending or ranging. Traders often set a threshold, such as 25, to filter trades; only entering positions when the ADX signals a strong trend. For example, if the ADX rises above 25 during a stock rally, it suggests the trend is gaining momentum and may be worth following.
A major benefit of ADX is its ability to reduce losses from false breakouts by confirming the presence of a genuine trend. This is especially valuable in 2025, as increased market volatility makes it harder to distinguish real moves from noise. ADX is often paired with moving averages or other trend-following technical indicators for comprehensive analysis.
It is important to note that while ADX measures trend strength, it does not indicate direction. Therefore, always use it with directional technical indicators to determine whether to buy or sell.
In conclusion, ADX helps traders set strategy—trend-following or mean-reversion—by clarifying market conditions, making it an indispensable part of any modern technical indicators toolkit.
How to Combine Technical Indicators for Maximum Trading Edge
Building a robust trading strategy in 2025 requires more than just picking a single favorite indicator. Relying on one tool can leave traders blind to critical market signals or vulnerable to false positives. Instead, the most successful traders build a complementary toolkit of technical indicators that work together, each confirming or filtering the signals of the others.
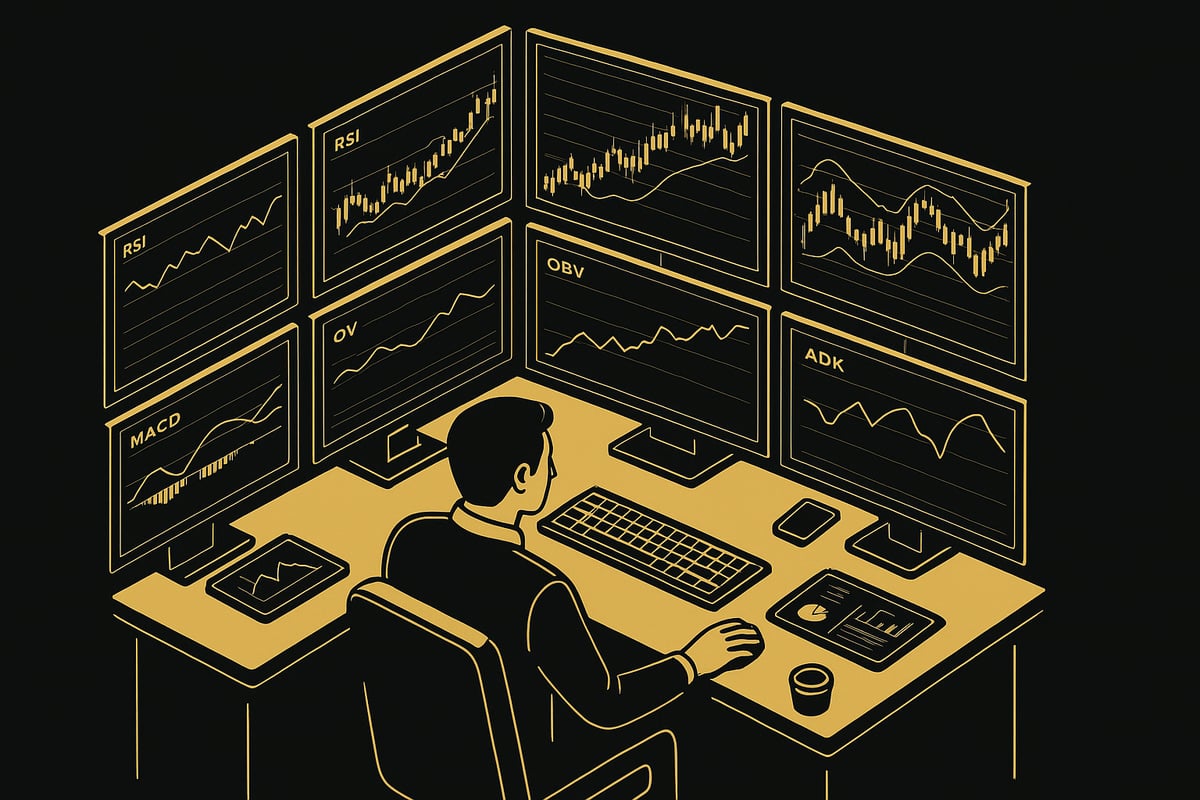
Building a Complementary Indicator Toolkit
To gain a true trading edge, it is vital to combine different types of technical indicators. Each category—trend-following, momentum, volume, and volatility—offers unique insights. By pairing them, you reduce the likelihood of acting on misleading signals.
For example, consider these classic combinations:
| Combination | Purpose | Strengths |
|---|---|---|
| RSI + MACD | Momentum + Trend Confirmation | Filters out weak reversals |
| Bollinger Bands + OBV | Volatility + Volume Confirmation | Spots breakouts with volume support |
| Stochastic + ADX | Momentum + Trend Strength | Times entries in strong trends |
| MACD + Bollinger Bands | Trend + Volatility | Identifies trend continuation or squeeze |
Using two to four technical indicators together helps filter out market noise. According to Investopedia, strategies that combine different indicators report higher win rates and lower drawdowns than those relying on a single metric. This layered approach is especially important in fast-moving or volatile markets, where a single indicator can be easily fooled.
However, more is not always better. Overlapping technical indicators that measure the same market aspect, like using both RSI and Stochastic Oscillator alone for momentum, can lead to redundant signals and analysis paralysis. The key is to select indicators from different categories, ensuring each adds distinct value to your analysis.
Backtesting plays a critical role in optimizing your toolkit. By running historical data through your chosen set of technical indicators, you can identify which combinations deliver the highest performance for your preferred assets and timeframes. For traders interested in leveraging artificial intelligence or machine learning, research on the impact of technical indicators on machine learning models suggests that well-chosen indicator sets can significantly enhance prediction and execution in high-frequency trading.
Customizing indicator settings is another advanced technique. Different assets and market conditions may require adjustments to parameters—such as the period length of a moving average or the sensitivity of an oscillator. This fine-tuning can further sharpen your trading edge, ensuring your technical indicators remain relevant and responsive as market dynamics evolve.
In summary, combining technical indicators is not just about stacking tools, but about weaving together a strategy that balances confirmation and clarity. Thoughtful selection, regular backtesting, and careful customization will help you maximize your edge in 2025’s competitive trading landscape.
Common Mistakes and Pro Tips When Using Technical Indicators
Navigating the world of technical indicators can be both rewarding and challenging for traders in 2025. While these tools offer powerful insights, missteps can undermine even the most promising strategies.
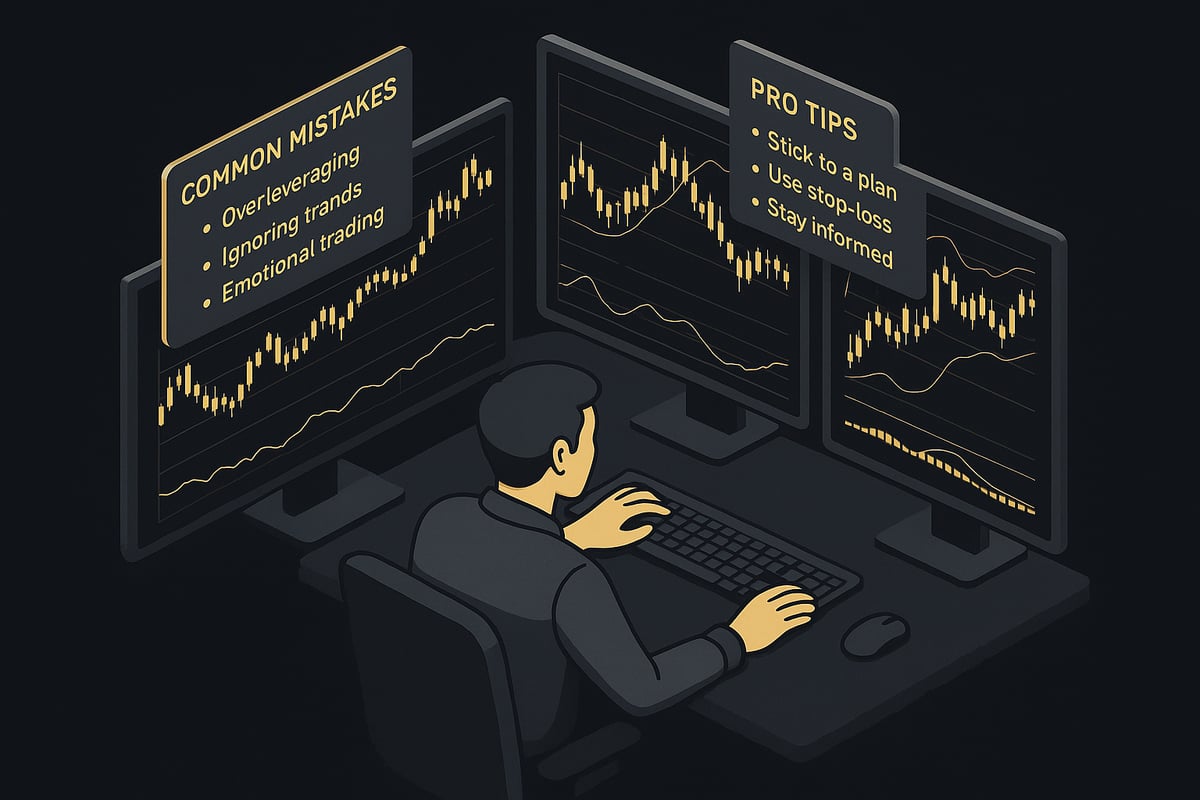
One of the most common pitfalls is overfitting. Traders may tweak technical indicators until they perfectly fit historical data, only to find their strategies fail in real markets. This happens because markets evolve, and indicators optimized for the past rarely predict the future with accuracy.
Another frequent mistake is signal overload. Using too many technical indicators at once can clutter charts and produce conflicting signals. This leads to indecision or “analysis paralysis,” where traders hesitate instead of acting confidently.
Ignoring the broader market context is equally risky. Technical indicators are not foolproof. For example, an RSI signal might suggest an asset is overbought, but in a strong bull trend, prices can remain elevated for extended periods. Without considering news, macroeconomic shifts, or sector momentum, traders risk acting on misleading signals.
Pro Tips for Mastering Technical Indicators:
- Focus on depth, not breadth: Master a few technical indicators deeply rather than spreading yourself thin across many.
- Regularly review and journal your trades to refine indicator-based strategies.
- Stay informed about new developments. AI-driven tools and innovative approaches are reshaping how technical indicators are used. For a deeper understanding, explore Artificial Intelligence Techniques in Financial Trading for insights on the latest advancements.
- Adapt your indicator toolkit as markets evolve. What works today may not be effective tomorrow.
In summary, success with technical indicators in 2025 comes from a balanced, disciplined approach. Avoid common mistakes, commit to continuous learning, and always interpret indicator signals within the broader trading landscape.
Now that you know the six essential technical indicators for 2025, you’re one step ahead in mastering the markets. But as we’ve seen, success isn’t just about knowing what tools are out there—it’s about acting on clear, reliable signals in real time. That’s exactly where PipTrend comes in, combining AI precision with practical simplicity to help you make smarter, more confident trades across forex, crypto, stocks, and indices. Ready to elevate your strategy and catch more winning trades? Start Catching Winning Trades, Right Now!