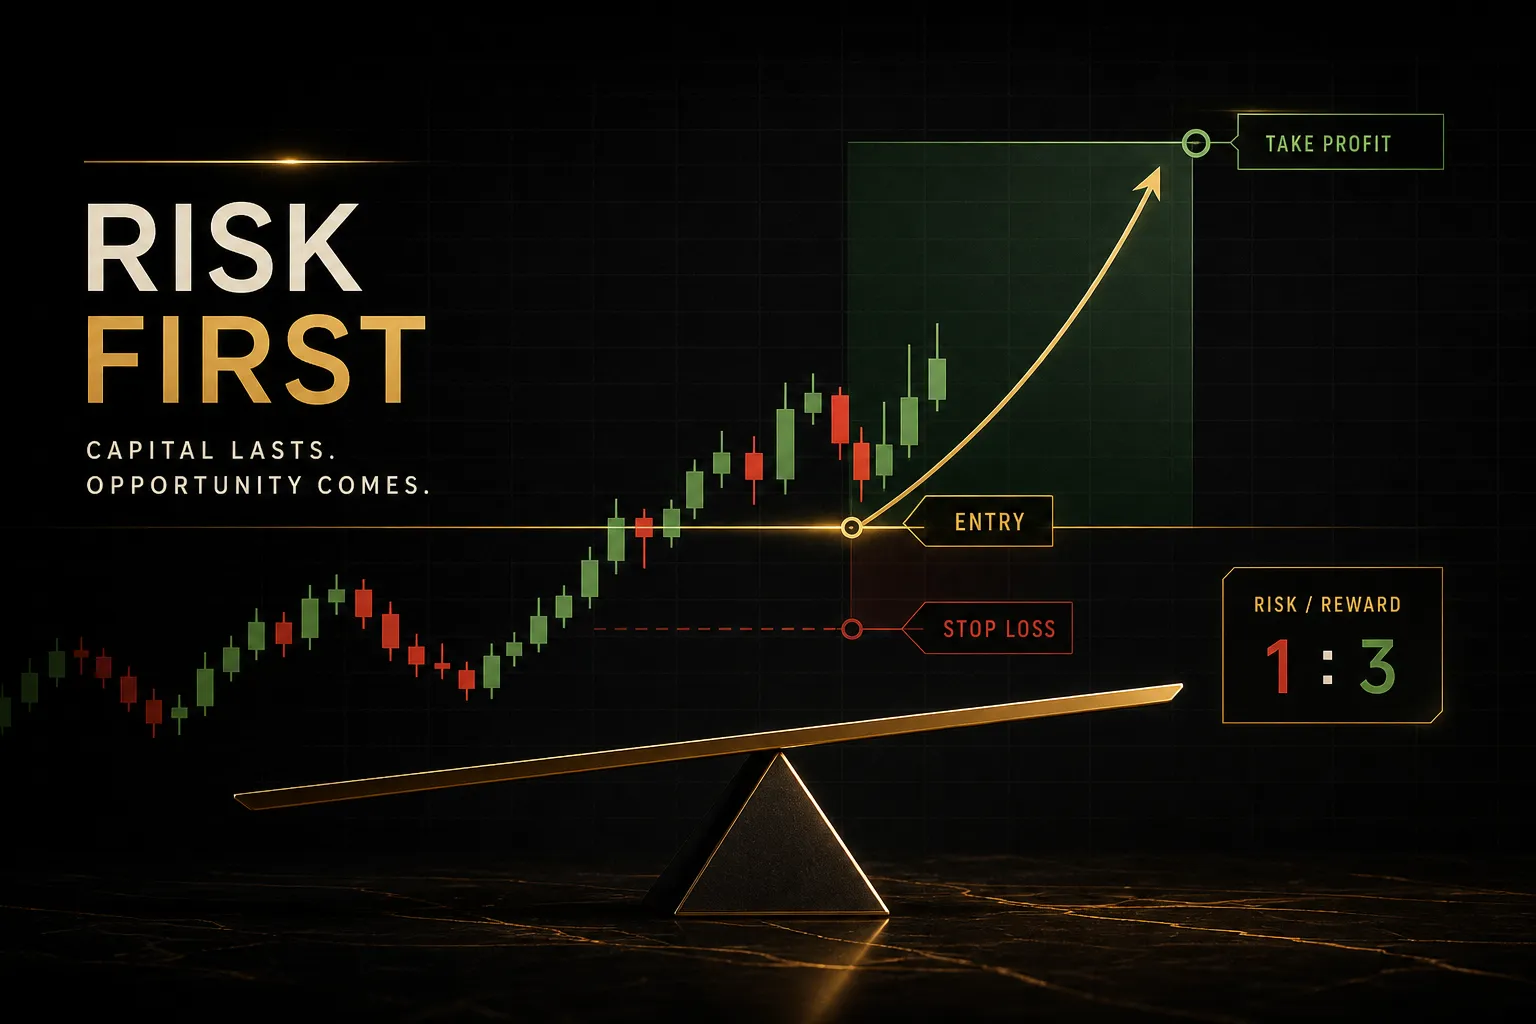
High Probability Trading: A Trader's Real Framework
On this page
What High Probability Trading Really Means
Most traders hunting for “high probability” setups are actually hunting for certainty. Those are two very different things.
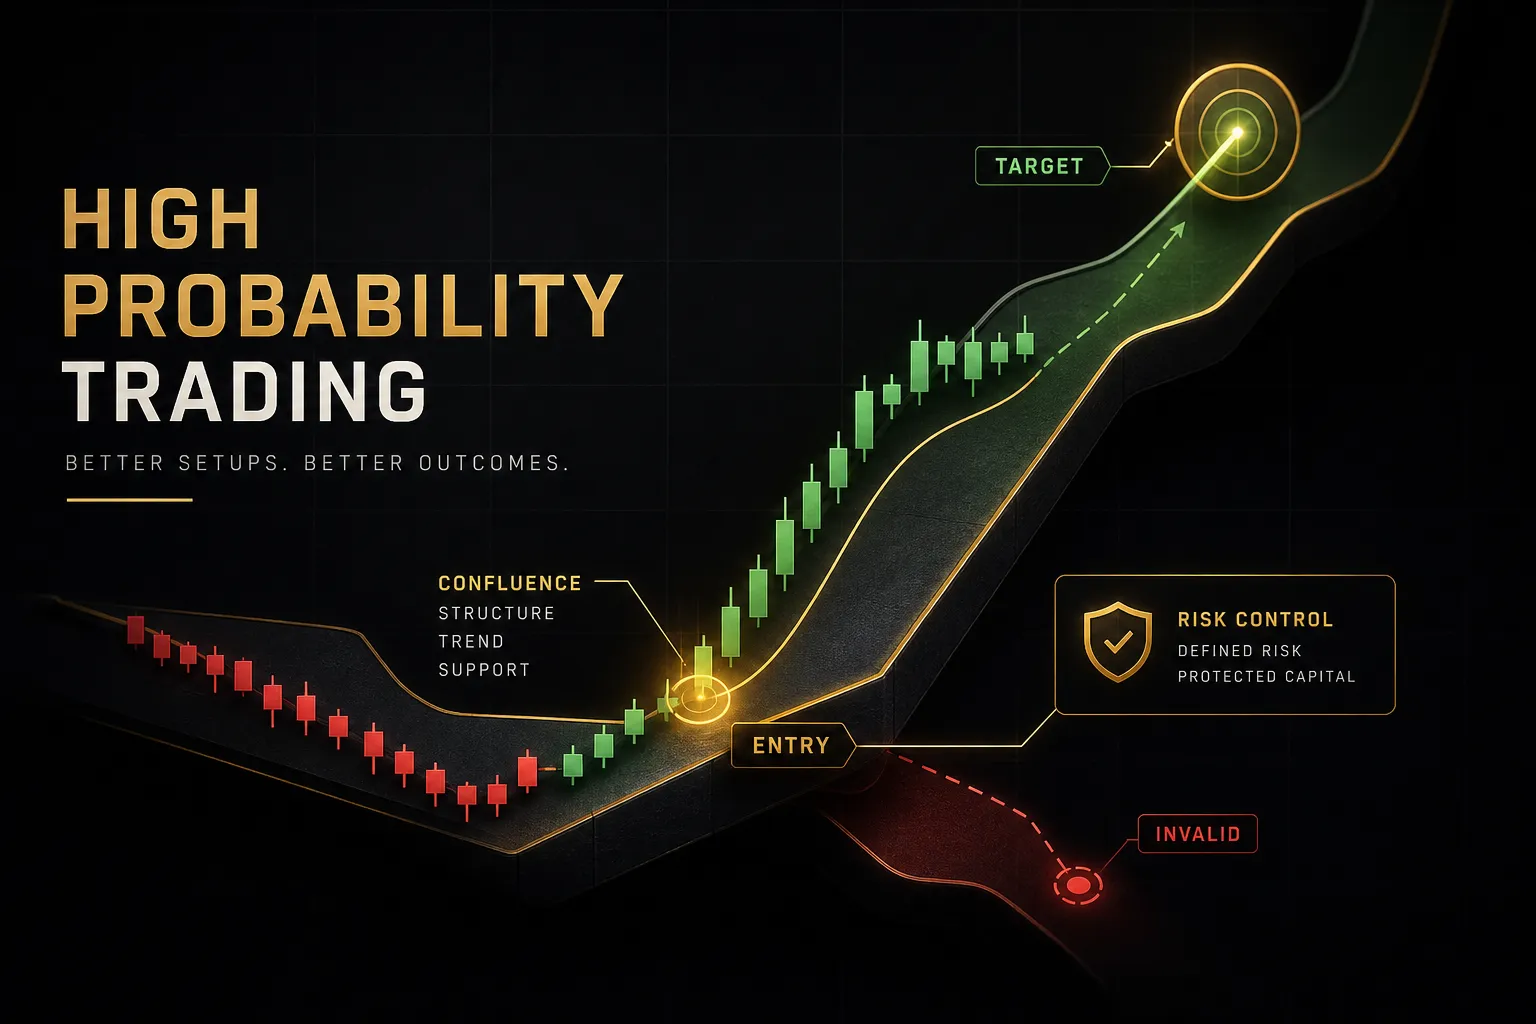
High probability trading is a rules-based process for stacking a measurable statistical edge across many trades.
It is not a promise that the next trade wins. It is a promise that, over a large enough sample, your decisions produce a positive result more often than random entries would.
That distinction sounds academic until it costs you money.
A trader who believes a setup “should” work will oversize, move stops, and revenge trade when it fails. A trader who thinks in probabilities expects failures as part of the distribution.
Every trade is a sample of one. Your edge only exists in aggregate.
So the framework has two halves.
The first is a mindset: accepting uncertainty, treating each setup as a bet with known odds and a known cost, and staying indifferent to any single outcome.
The second is mechanical: written entry criteria, invalidation levels, targets, and position sizing rules you can repeat without improvisation.
Here is the core idea this article builds on.
Win rate, taken alone, tells you almost nothing. A 75% win rate can bankrupt an account. A 38% win rate can compound steadily for years.
What decides the difference is trade expectancy: the interaction of win rate, average win size, average loss size, and the costs you pay to participate.
You also need to be honest about what an indicator can and cannot do.
No oscillator, no signal engine, no chart pattern predicts the future.
The best of them shift conditional odds slightly in your favour when tested properly on out-of-sample data, with realistic spread and slippage included.
That shift is small.
It’s also enough.
Casinos run on edges of one or two percent, and they never need to be right about any single spin.
Win Rate, Expectancy, and the Math That Matters
Ask a trader how their system performs and most will quote a win rate. Ask them their average win divided by average loss and the conversation usually stops.
The Expectancy Formula Explained
Expectancy is the average amount you expect to make per trade, expressed in currency or in R (multiples of risk). The formula:
Expectancy = (Win% x Average Win) - (Loss% x Average Loss)
Run two strategies through it.
Strategy A wins 70% of the time, banking $100 per winner, but losers run to $300 because the trader “gives them room”. Strategy B wins 40% of the time with a strict 1:2.5 risk-to-reward ratio, taking $250 winners against $100 losers.
| Metric | Strategy A (high win rate) | Strategy B (strict R:R) |
|---|---|---|
| Win rate | 70% | 40% |
| Average win | $100 | $250 |
| Average loss | $300 | $100 |
| Expectancy per trade | (0.70 x 100) - (0.30 x 300) = -$20 | (0.40 x 250) - (0.60 x 100) = +$40 |
| Result over 200 trades (before costs) | -$4000 | +$8000 |
| Result after $8 round-trip cost per trade | -$5600 | +$6400 |
The 40% system out-earns the 70% system by twelve thousand dollars over a single year of moderate activity.
Not because it predicts better.
Because its losses are capped and its winners are allowed to pay.
Why a 40% Win Rate Can Beat 70%
Every risk-to-reward ratio carries an implied breakeven win rate, the accuracy you need just to tread water.
Know yours before you judge your results.
| Risk-to-reward ratio | Breakeven win rate (no costs) | Win rate needed with 0.2R cost per trade | Expectancy at 50% win rate |
|---|---|---|---|
| 1:0.5 | 66.7% | ~71% | -0.25R |
| 1:1 | 50.0% | ~54% | 0.00R |
| 1:1.5 | 40.0% | ~43% | +0.25R |
| 1:2 | 33.3% | ~36% | +0.50R |
| 1:3 | 25.0% | ~27% | +1.00R |
| 1:5 | 16.7% | ~18% | +2.00R |
Read the third column carefully.
Costs raise the bar on every row, and they punish tight-target strategies hardest. A scalping system targeting 0.5R has to be right roughly seven times out of ten before a single dollar of profit appears.
This is why marketing claims of “60-75% accuracy” are close to meaningless on their own.
Accuracy on what market? Which timeframe? Over how many trades, across which testing period, with what spread assumption, and at what average R:R?
A 68% win rate on 40 trades of EURUSD during a three-month trending period, backtested with zero commission, tells you nothing about next month. The same figure across 600 trades spanning trending, ranging and high-volatility regimes, net of realistic execution costs, tells you a great deal.
Demand five numbers before you trust any performance claim: sample size, testing window, average R:R, cost assumptions, and maximum drawdown. Missing any one of them, and the win rate is decoration.
What Makes a Setup High Probability
A signal is not a setup.
An arrow on a chart is roughly 20% of a trade decision.
A complete setup specifies six things: the market regime you are willing to trade, the directional bias, the entry trigger, the invalidation level that says your idea was wrong, the target or exit logic, and the position size.
Remove any one and you no longer have a repeatable process.
You have a hunch with a chart attached.
Write those six components down for your primary setup. If you cannot fill in every field without hedging, that is where your inconsistency is coming from.
Confluence That Isn’t Just More Indicators
Traders love confluence.
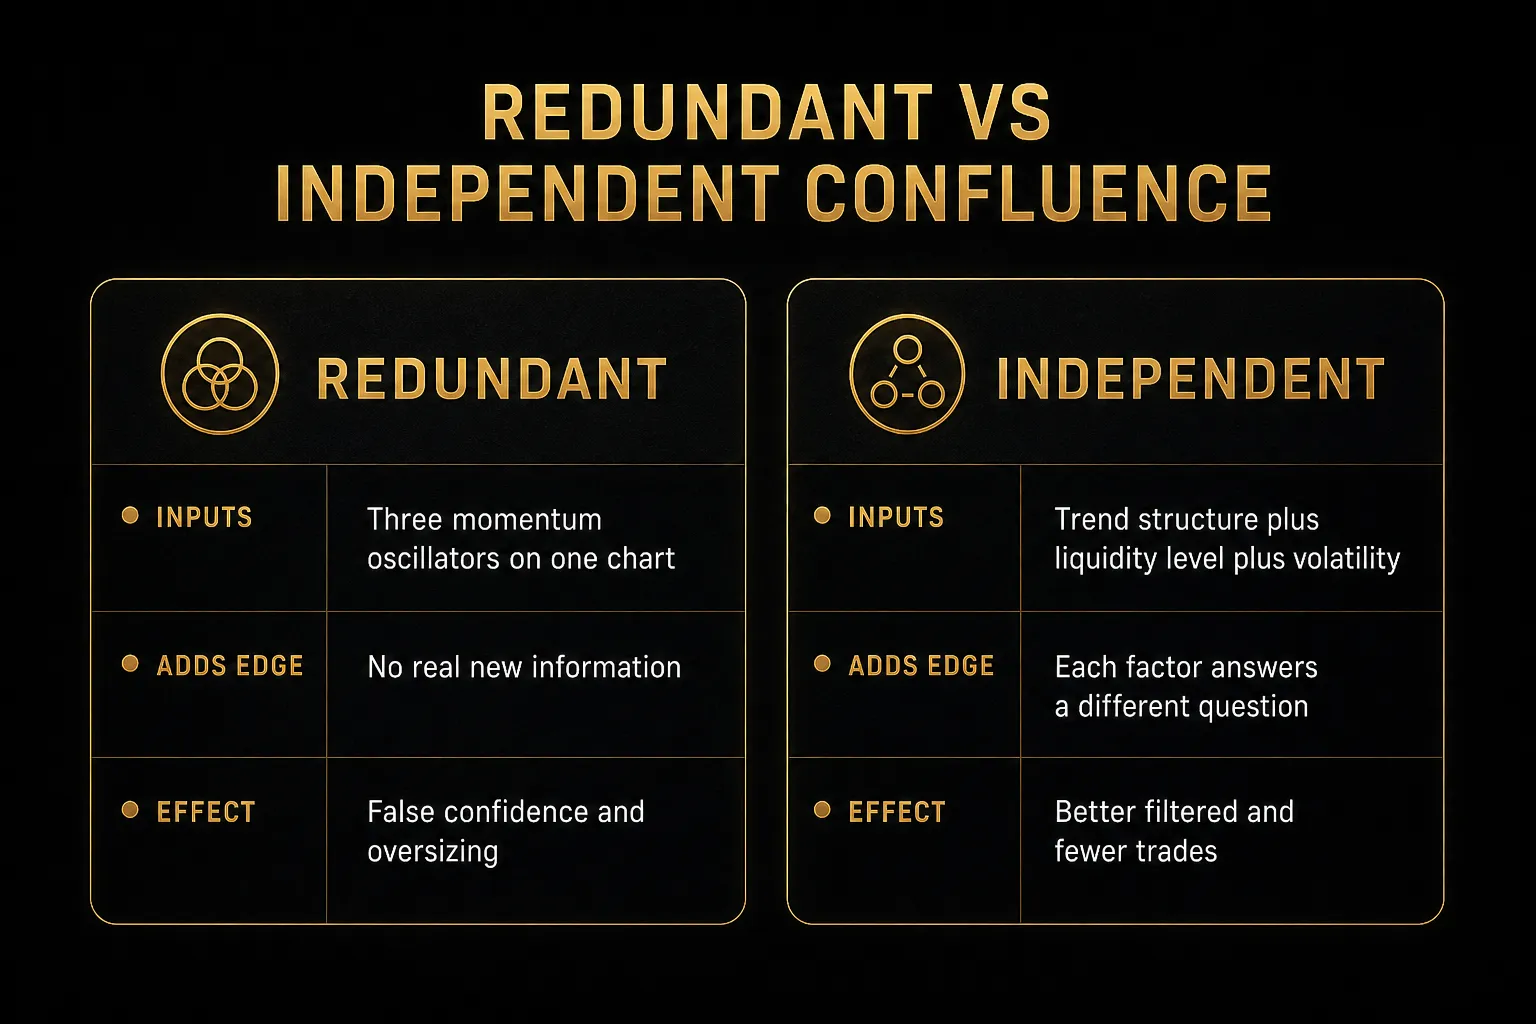
Most of what they call confluence is the same information counted twice.
Stack RSI, Stochastic, and a MACD histogram on one chart and you have three views of recent price momentum. They agree because they are calculated from nearly identical inputs.
That is redundant confluence, and it inflates your confidence without improving your odds.
Independent confluence combines factors that measure genuinely different things.
Trend direction from higher-timeframe market structure.
An execution level drawn from liquidity zones, session highs and lows, or VWAP.
A volatility filter that tells you whether the average range currently supports your target distance.
Three sources, three different questions answered: where is the market going, where can I get filled with a tight invalidation, and is the environment capable of paying me?
Market Regimes Change the Odds
The same setup can be a 55% winner in one environment and a 30% loser in another.
This is the single largest hidden variable in retail trading results.
Mean-reversion entries at support and resistance tend to perform well in ranging conditions and get destroyed during sustained trends, where every touch breaks.
Breakout entries invert that relationship completely.
Momentum systems suffer in low-liquidity sessions, where thin order books produce whipsaws that look like signals.
News-driven conditions deserve their own rule.
Around scheduled releases, spreads widen, slippage jumps, and stop placement becomes guesswork. Many profitable systems become negative-expectancy for those thirty minutes.
Which is why regime filtering comes before signal evaluation.
Classify the environment first using higher-timeframe structure, an ATR-based volatility read, and session timing. Then ask whether your setup belongs there at all.
Using a Structured Signal System
A well-built system makes this separation explicit rather than leaving it to discretion. Take PipTrend as a practical illustration of the architecture.
Its signal engine and multi-timeframe analysis table handle one job only: establishing directional bias and trend confirmation across timeframes. Entry location is handled separately, using session highs and lows, VWAP, and supply and demand zones.
Direction and execution are decoupled, which is exactly what non-redundant confluence requires.
The structural point matters more than the specific tool. When one module tells you where the market is likely headed and a different module tells you where to engage with minimal risk, you are combining independent information rather than double-counting price action from the same source.
PipTrend also publishes a results page.
Treat that as the transparency standard you apply to every vendor: predefined rules, tracked outcomes, and a visible sample, rather than a folder of winning screenshots.
If a provider cannot show you the losers, you are looking at advertising.
Validating an Edge Before You Trust It
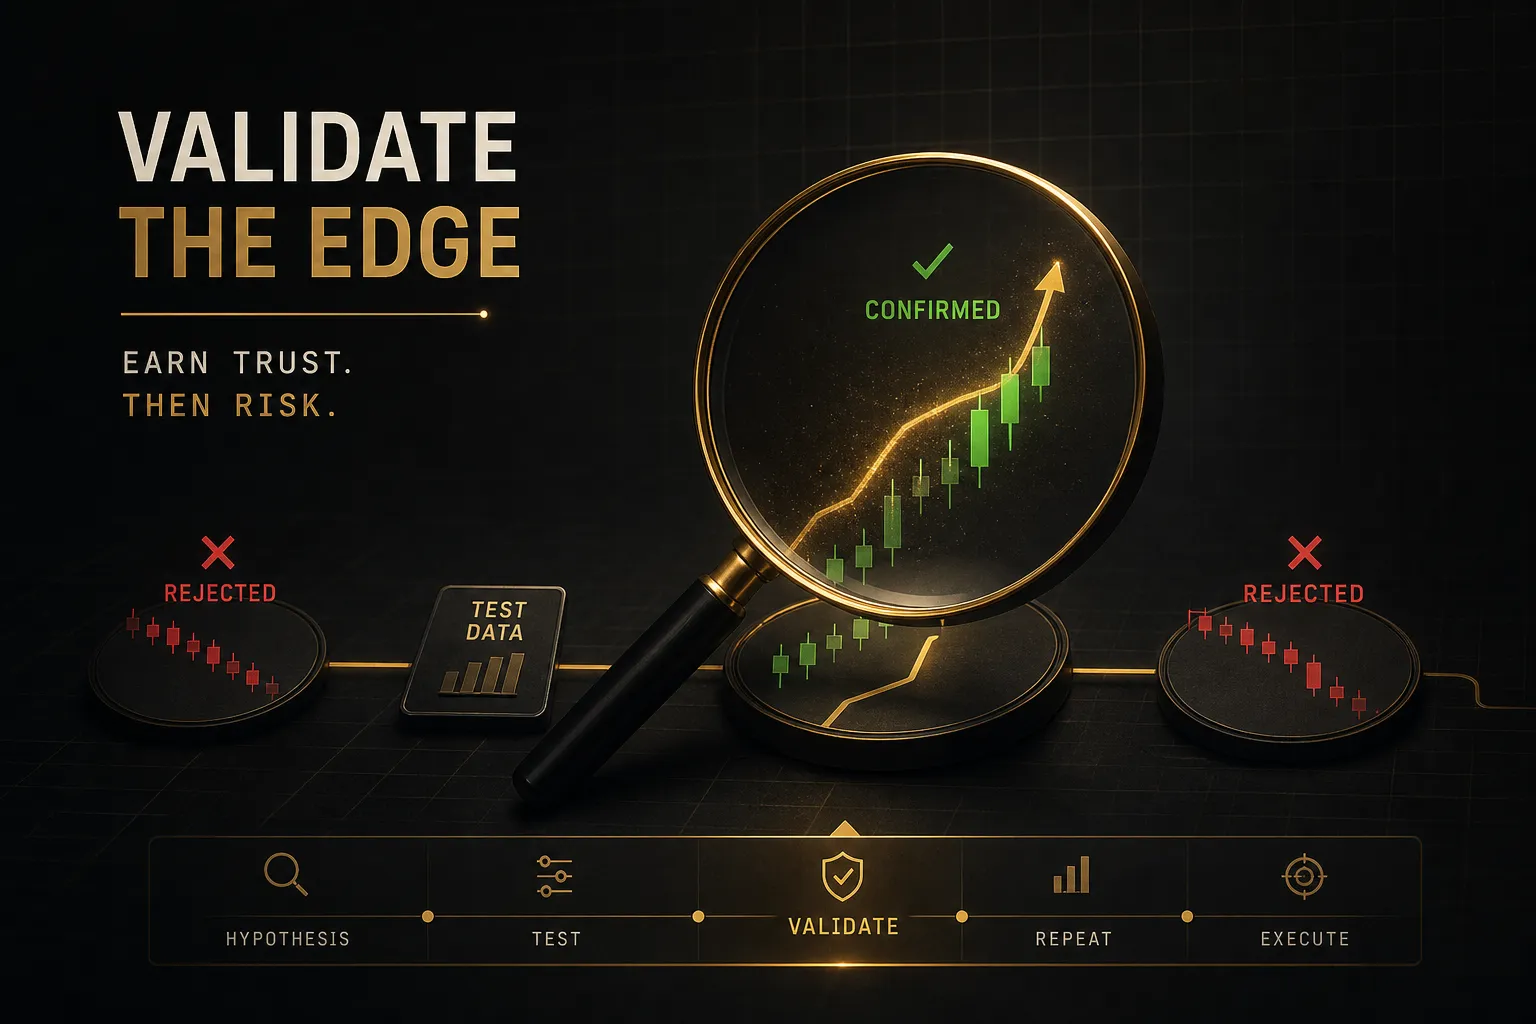
Every strategy looks brilliant on the data it was built from.
That is not a flaw in your strategy. It is a flaw in how humans read charts backwards.
Avoiding Repainting and Look-Ahead Bias
Repainting is when an indicator changes or removes historical signals after the fact. On a saved screenshot it appears to have called every turn.
In live trading it flickers, prints, and vanishes.
Test for it in two steps.
First, confirm that signals only finalise on candle close and never redraw once the bar completes. Second, screenshot live forward signals daily for two weeks, then reload the same chart and compare prints against your record.
Any discrepancy is a repaint.
Look-ahead bias is subtler.
It happens when a backtest uses information that was not available at decision time: a session high referenced before the session finished, a daily close used for an intraday entry, an indicator sampling the current unclosed bar.
Related traps compound it.
Hindsight bias makes past charts feel obvious, so you unconsciously code rules that fit known outcomes. Data leakage occurs when optimisation touches your test data, quietly turning validation into curve fitting.
Each one inflates apparent win rates, sometimes by fifteen or twenty percentage points.
Then there are costs, which backtests love to ignore. Include all of them: spread at your actual execution times, commission per round turn, realistic slippage on stops, latency between signal and fill, and missed fills where price never came back.
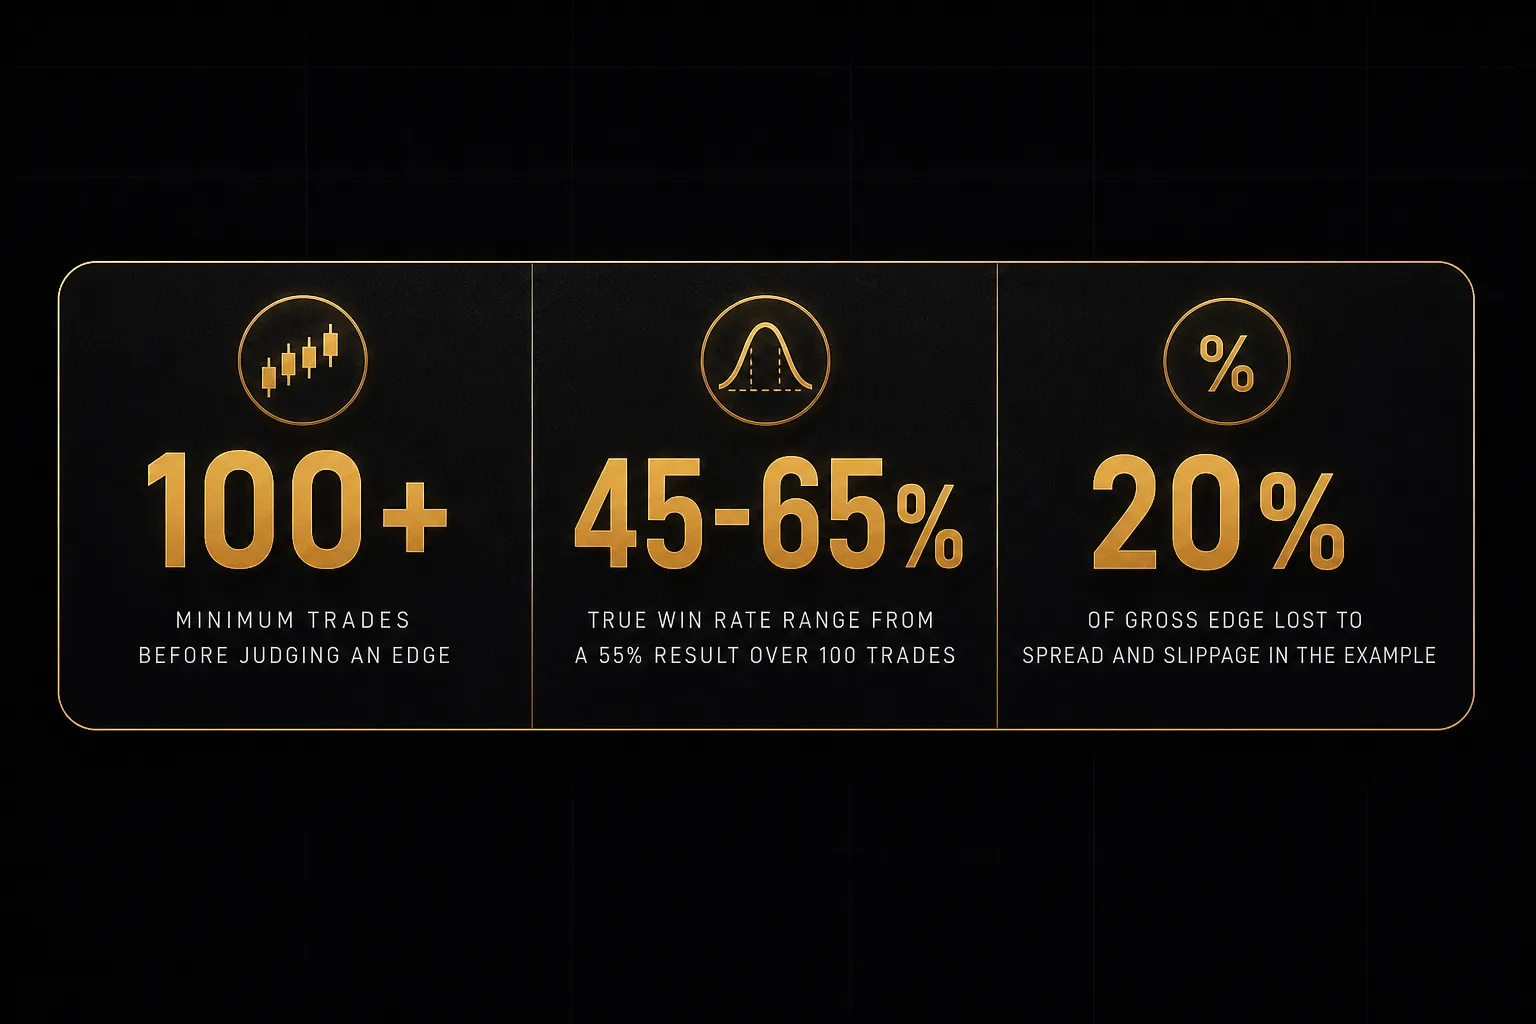
A strategy averaging 12 pips of profit per trade with a 1.6 pip spread and 0.8 pips of slippage has just lost 20% of its gross edge.
Sample Size and Confidence
A 12-trade winning streak feels like discovery. Statistically, it is noise you could reproduce by flipping coins in a decent afternoon.
Use 100 trades as a working minimum before drawing conclusions, and understand that 100 still leaves wide uncertainty. With 100 trades and a measured 55% win rate, the true win rate plausibly sits somewhere between roughly 45% and 65%.
That range straddles profitable and unprofitable at 1:1 R:R.
Confidence intervals in plain terms: the smaller your sample, the wider the fog around your number. Doubling the sample tightens it by roughly 30%.
Four hundred trades give you a genuinely usable estimate.
Finally, split your data.
Walk-forward testing means building rules on one period, say 2020 to 2023, then testing untouched on 2024 to 2026 without adjusting anything. Out-of-sample performance within 70-80% of in-sample results suggests a real edge.
A collapse suggests you fitted history.
Do this before you scale size.
Not after.
Risk Management for High Probability Trades
You can be right about direction, right about level, right about timing, and still blow up. Sizing is where correct analysis becomes a survivable business.
Position Sizing From Stop Distance
Position size is an output, not a preference. It falls out of three inputs: account equity, risk percentage, and stop distance.
- Work the formula in order. Position size = (Account equity x Risk %) ÷ (Stop distance in pips x Pip value per lot). With a $25,000 account risking 1%, your risk budget is $250 per trade.
- Apply a real example. Long GBPUSD with a 40-pip stop, where one standard lot equals $10 per pip: $250 ÷ (40 x $10) = 0.625 lots. Widen the stop to 80 pips and size halves to 0.3125 lots. Same risk, different exposure.
- Let the market set the stop, then the stop sets the size. Place invalidation where your thesis is objectively wrong, beyond the structure or liquidity zone, then size down to fit. Never shrink a stop to justify a bigger position.
- Respect the 1% rule as a drawdown ceiling. Risking 1% per trade means ten consecutive losses cost about 9.6% of equity. At 5% per trade, the same streak costs 40%, and the recovery arithmetic turns brutal.
- Treat leverage and margin as separate risks. A 1:500 account lets you open 20 lots on a $25,000 balance. The trade thesis may be sound while the account-level exposure is indefensible, because a single 2% adverse move on that size wipes the account. Leverage should expand your ability to trade wide stops with small size, nothing more.
Correlation and Drawdown Limits
Six trades at 1% each is not 6% of risk if they are all the same bet wearing different tickers.
- Count exposure by risk factor, not by ticker. Long EURUSD, GBPUSD, and AUDUSD simultaneously is one short-dollar position in three costumes. If USD strengthens, all three lose together and your “1% per trade” becomes a 3% single-event loss.
- Cap correlated risk explicitly. A practical rule: no more than 2% total risk against any single currency or macro theme, and no more than 4-6% open risk across the whole book at one time.
- Manage the exit with the same rigour as the entry. Predefine partial profit levels (for example, half off at 1R with the stop to breakeven), trailing logic tied to structure rather than fixed pips, and time-based exits for setups that stall past their expected window.
- Write an invalidation rule that fires before the stop. If the setup’s premise breaks, a failed breakout closing back inside the range, exit at market. Waiting for the stop out of stubbornness converts a 0.3R loss into a full 1R loss repeatedly.
- Plan for losing streaks mathematically. At a 45% win rate, a run of seven consecutive losses has roughly a 60% chance of occurring somewhere in 200 trades. It is expected, not evidence your system broke.
- Set hard circuit breakers. Common limits: stop trading for the day at 3% down, review the system at 10% drawdown, and halve size at 15%. These rules protect you from the version of yourself that appears after four losses.
Frequently Asked Questions
What is the best high probability trading strategy?
There is no universally best strategy, and any source claiming otherwise is selling something.
What works depends on your market, timeframe, capital, execution costs, and the amount of screen time you realistically have.
The best strategy for you is the one with positive expectancy in your conditions that you can execute identically on trade 200 as on trade 3.
How do you identify high probability setups?
Start with market regime, then layer independent confluence.
Classify the environment as trending, ranging, or volatile using higher-timeframe market structure and a volatility read, confirm that your setup historically performs in that regime, then require agreement between factors that measure different things: directional bias from multi-timeframe analysis, an entry at a defined liquidity zone or support and resistance level, and momentum confirmation on the trigger.
Finally, check that the available target distance justifies the stop.
What is the 90% win rate trading strategy?
Strategies advertising 90% win rates almost always hide terrible risk-reward or unsustainable risk practices.
The two usual mechanisms are tiny targets against enormous stops, where one loss erases twenty wins, and martingale-style position adding into losers, which produces a beautiful equity curve until the single day it terminates the account.
At 1:0.1 risk-reward, a 90% win rate is a losing system before costs.
What is the most accurate trading indicator?
No indicator is reliably accurate on its own, because all of them derive from past price and none forecast the future.
Accuracy claims should be verified against transparent, predefined, published results covering a full sample of trades across multiple market regimes, not marketing screenshots or curated highlight reels. Ask for the losers, the drawdown figure, and the cost assumptions.
Indicators are useful as structured inputs to a decision process, not as answers.
Can you make consistent profits with high probability trading?
Yes, but consistency comes from process discipline and risk control rather than from a high win rate.
A validated edge with positive expectancy, position sizing capped near 1% per trade, correlation limits, and predefined exits produces results that compound across hundreds of trades. Monthly returns will still vary, and drawdowns are guaranteed.
Consistency describes your behaviour, not your equity curve.
What is the 1% rule in trading?
The 1% rule means risking no more than 1% of account equity on any single trade, measured from entry to stop loss. On a $50,000 account that caps loss at $500 per position regardless of how confident the setup looks.
Its purpose is arithmetic survival: at 1% risk, even ten straight losses cost under 10% of capital, keeping you solvent long enough for your statistical edge to express itself.
Trading the Odds, Not the Outcome
The shift that changes results is unglamorous.
Stop asking how often a system wins and start asking what it earns per trade, net of costs, over a sample large enough to mean something.
That means expectancy over accuracy, capped losses over hopeful ones, independent confluence over indicator stacking, and validated out-of-sample performance over a convincing backtest.
One action tonight.
Pull your last 20-30 trades, calculate the real expectancy using the formula in section two, and work out your average risk-to-reward ratio.
Most traders discover their R:R is well below what they assumed, and the fix is exit discipline rather than a new indicator.
Then hold this in mind on your next entry.
Probability improves the quality of your decisions across hundreds of trades. It predicts nothing whatsoever about the one in front of you… and that is exactly why the rules exist.
Sources
Risk Disclaimer: Trading involves risk. Past performance doesn't guarantee future results. Only trade with money you can afford to lose. PipTrend is a tool to assist your trading decisions, not financial advice.